Final report for FS23-355
Project Information
The solution:
To inexpensively solve the difficulty of determining when chestnuts are ready for consumption (by visual or tactile inspection, particularly for those kept at low temperatures and high humidity to maximize shelf life), this solution is to develop guidelines via statistically designed experimentation, the results of which can reasonably forecast curing rates under various temperature/RH circumstances. So given knowledge of the thermal and RH history of the nuts, one can then prescribe the time required at a certain temperature/RH combination to accelerate, delay or maintain cure to bring nuts to optimal sweetness at the intended time of consumption/use.
With this grant I will be funding North Carolina State University Kannapolis Laboratory (‘Plants for Human Health Institute’ ) to carry out the analytical methods (wet chemistry results) of this designed experiment (described in the 'Approaches and Methods' section of this submission). This study and its results will then be peer review published (open access) in a suitable journal for use by academia, industry and consumers with the aim of educating and arming them so that more of what the chestnut has to offer can be obtained.
Chestnuts will be supplied by Mountain Grown Chestnuts, LLC, Burnsville NC 28714, from the 2024 harvest. They will be kept at 32 F and 90% humidity until pulled from the cooler for 72 F/50% RH curing.
The study will be comprised of a 2^5-1 fractional factorial, fully replicated designed experiment. Factors and levels will be as shown below. The primary response will be '% soluble solids' (brix content) and will be determined via best practice 'wet chemistry' (WC) methodologies, done for each of the 32 treatment combinations (with approximately '0.33' lbs. of nuts/treatment combination):
| FACTORS | '-' LEVEL | '+' LEVEL |
| Harvest Drop Timing | Early in Harvest (nuts dropping 9/15 - 9/19) | Late in Harvest (nuts dropping 9/30 - 10/2) |
| Nut Size | Small (avg. = 5.69g, stdev = 1.29g) | Large (avg. = 12.51g, stdev = 2.75g) |
| Nut Color | Light | Dark |
| Nut Shape | 2 Flat Sides (Center Nut)1 | Flat Side (End Nut) |
| Days Cold Stored (34F, 90% RH) | 6 days | 20 days |
The above full factorial experiment will be conducted at four different dwell times as shown below (with all dwells at 72 F and 50% RH):
- 0 hrs. dwell at 72F/50% RH
- 48 hrs. dwell at 72F/50% RH
- 96 hrs. dwell at 72F/50% RH
- 144 hrs. dwell at 72F/50% RH
Statistical linear models for each of these 4 dwells will be created, from which curing curves will be developed for combinations of the statistically significant factors found.
Research
Chestnuts will be harvested twice daily, 7 days/week during harvest (late September thru October). The intent is for chestnuts to be gathered at harvest as close as possible to when they naturally fall from trees. Harvested chestnuts will then be inspected (standard inspection to ensure they are marketable nuts), washed (with cold water) and immediately refrigerated at 34F, 90% RH. This will be done twice daily immediately after their harvesting from the orchard (so to minimize time from falling from trees to being refrigerated).
Then each Monday, for four consecutive Mondays, four select treatment combinations (n=8 for each, so 32 separate samples) will be assembled at the orchard (as per the experimental matrix - see attachment) and then 'immediately' (asap as distance is 3 hours drive) cold delivered to NC State's Kannapolis laboratory (‘Plants for Human Health Institute’ ) for analyses (Brix and Moisture done via NIR Spectrometry to gather data for a possible future NIR model for this on the Dunstan variety in North America, then Brix and Moisture done via best practice wet chemistry methods). On the day of receipt of nuts, the Lab will analyze several nuts for each of the four treatment combinations and repeat this at 48, 96 & 168 hours later with the balance of the samples, with these combinations being stored at 72F, 50% RH.
The above is then repeated each week for the remaining 12 treatment combinations.
Experimental Design (as of 2-29-24)
72 young, healthy Dunstan trees (ages 8 – 11, averaging 9 years old) were used in the study. They are in the Blue Ridge Mountain portion of Southern Appalachia, part of Mountain Grown Chestnuts, LLC orchard. The study trees are positioned on a steep west facing slope (20° to 33°, averaging ~ 26°), at approximately 2,600’ elevation above sea level. Tree trunk diameters (measured 12” above ground level), assessed one month prior to the study’s harvest ranged from 4.4” to 9.6”, averaging 6.4”. All 72 trees flowered in the summer prior to the 2024 study season. 57 of those trees produced nuts, with most producing in the 0.01 – 2.3 kg range. See Figure 1 for distribution of chestnut yield by tree. Individual nut weight ranged from 2.75 g up to
20.8 g, a wide range compared to many other cultivars/genotypes (Aydin et al., 2021).
Harvest started 9/11/24 as nuts first started to fall that day. Most nuts dropped during the 2nd and 3rd weeks. Nuts were allowed to open and drop naturally as part of the harvesting approach and then were manually harvested.
Harvested chestnuts were picked up twice daily as they fell, then immediately inspected, with those with split skins and other defects discarded. They were then immediately cold washed with floaters discarded, and then cold stored in 1 gallon size microperforated ziploc brand bags at 1° C (+/- 2) with 90% (+/- 5) RH. They were later re-inspected and put into appropriate treatment combinations for lab analysis.
Analyses Performed
Experimental units (i.e., chestnuts) were individually assessed via wet chemistry for:
1. % Total Soluble Solids Concentration (%TSS) and
2. % Moisture Content (%MC)
NOTE: Prior to the above analyses, experimental chestnuts were individually scanned using near-infrared spectrometry (NIR). This was done to build NIR models for the two key measures above.
Experimental analyses were then conducted using these individual chestnut %TSS and %MC values, done for the Temperature/RH/Time intervals below:
1. ‘1° C/90% RH’ six days after harvest
2. ‘1° C/90% RH’ 20 days after harvest
3. ‘22° C/50% RH’ for seven days after #2 above
4. ‘22° C/50% RH’ for two days after #1 above
5. ‘22° C/50% RH’ for four days after #1 above
6. ‘22° C/50% RH’ for seven days after #1 above
7. ‘22° C/50% RH’ for two days after #2 above
8. ‘22° C/50% RH’ for four days after #2 above
The testing of the above ‘Temperature/RH/Time’ combinations is to allow for curing characterization of standard storage regimens, the ultimate pursuit of this research. Standard storage regimens are where nuts are immediately put into cold storage on the day of harvest (to maximize their shelf life), then ‘warm cured’ at room temperature by the producer or consumer to bring them to optimal sweetness and moisture content at the time of consumption.
Plots of this %TSS curing, accompanied by corresponding plots of %MC during curing are as found in the eight analyses outlined above. This is considered the research’s primary contribution.
For brevity’s sake, detailed factor effect results are provided just for the ‘Temperature/RH/Time’ combinations of 1 - 3 above, as they have been found
representative of comparable findings uncovered in analyses 4 – 8.
Analytical Methods
All laboratory analyses were conducted at North Carolina State University’s ‘Plants for Human Health Institute’ laboratory in Kannapolis, NC. Approaches utilized for the two key measures of interest (%MC, %TSS) are outlined below.
%MC
Nuts were cracked using a chestnut scoring tool (Urban Basics) and peeled. Shell (exocarp) and nut flesh (mesocarp) were weighed separately for each nut. Mesocarp was then sliced into thin sections (4-8) with single edged razor blades. Several sections were weighed and recorded to achieve a final weight of 1.0 to 2.2 g (for %TSS) and this sample placed in 15 ml polystyrene Genogrinder vials and capped. Both mesocarp and
endocarp lose weight quickly after shelling (about 0.05 g within 30 minutes) so nuts were peeled and processed as batches of 12 to avoid extra exposure after shelling. Remaining mesocarp and exocarp were placed on metal trays and put into a drying oven on racks, and baked at 60-65 °C for 24-36 hours, then removed and cooled for 30 minutes and weighed. Data indicated that 24 hours was sufficient to get a stable dry weight. Dry weights were collected for both exocarp and mesocarp samples. Percent moisture (%MC) for mesocarp in these analyses was then determined.
%TSS
For % total soluble solids (%TSS), the mesocarp slices in vials had two 8 mm (3/16 inch) stainless steel balls added (4RJJ3, Grainger), and slices were then pulverized for 2 minutes using a 2010 Genogrinder (SPEX, NJ) set at 1200 strokes per minute. About 0.5 g of the resulting paste was weighed into 2 ml microcentrifuge tubes using an analytical scale (Mettler-Toledo AB204-S Classic Plus), and weights to 4 decimal places were recorded. Distilled water (1.5 ml) was added to each microtube, tubes were capped, and vortexed for 30 sec with a Benchmark Bench Mixer PL 3002 (Grainger). Preliminary trials indicate that %TSS variation in readings is greatly reduced when using a clear supernatant rather than the mix of chestnut paste and water. Therefore, tubes were centrifuged for 8 minutes at 13,000 xg at room temperature (Eppendorf 5430R microcentrifuge). About 0.5 ml of clear supernatant was placed on a digital refractometer (PAL-1, Atago, Bellevue, WA) and ‘initial %TSS’ reading was recorded. Final %TSS was then calculated.
RESULTS and DISCUSSION
% Total Soluble Solids Content (%TSS)
Factor X5, ‘Days Cold Stored’ (1° C, 90% RH) with its tested settings of six days vs. 20 has been found to have a significant effect on %TSS. Consequently, statistical analysis of the other 4 factors has been done separately for each of the two settings of X5.
- When X5 is ‘-’, i.e., %TSS after Six Days of Cold Storage at 1° C /90% RH
Figure 1 shows what is termed a ‘Pareto of Effects’ for observed factor effects at the ‘-‘ setting of X5. This type of plot is where factor effects are organized left to right in descending order. It is named for Pareto, as typically most tested factors tend not to matter much, while a few do. This follows Vilfredo’s Pareto’s conclusion that a few causes tend to create most observed influences (i.e., the 80/20 rule) (Sanders, 1987); therefore, it’s named a ‘Pareto of Effects’.
By definition, a factor effect is the average of outcomes for a factor’s tested ‘+’ setting minus the average of outcomes for it’s tested ‘-’ setting. In Figure 1, factors exceeding the ‘bar of statistical significance’, called C.L.effects, are considered statistically significant (with 95% confidence at the bar, increasing above 95% with increasing height above it). Factors below C.L.effects, are considered ineffectual (effect = 0) demonstrating insufficient evidence of a statistically significant effect on the response of interest. The factor effects shown here are independent of each other, so those deemed significant are additive (as they are not confounded with each other in this experimental design).
Figure 1 shows that ‘Harvest Drop Timing’ (X1) and ‘Nut Color’ (X3) have demonstrated statistical evidence of having effects on this response. Their diagonal shading indicates that their ‘+’ setting averaged higher %TSS than their ‘-‘ setting did.
Interpretation of X1’s effect is that after six days of cold storage (1° C, 90% RH) chestnuts that dropped late, i.e., around the end of the 3rd week to the beginning of the 4th week (of the ~ five week harvest period), averaged nearly 5 percentage points more %TSS than early drop nuts, i.e., those that dropped near the end of week 1/beginning of week 2. Specifically, late drop nuts averaged 14.85% %TSS vs. 10.02% %TSS for their early drop counterparts. These averages are not just statistically different but considerably so; p-value = 6.53E-27. This suggests that some curing may be occurring on the tree, as those hanging on longer end up with a higher initial %TSS (and therefore higher initial sweetness) than do earlier dropping chestnuts.
Nut color also shows a statistically significant influence on %TSS, albeit just barely (statistically). It is a modest influencer from a practical standpoint as well, with dark nuts averaging ~ 0.70% points more %TSS than light nuts (p-value = 0.05).
Nut size and shape exhibited no apparent impact on %TSS, at least at this point in the cold storage process.
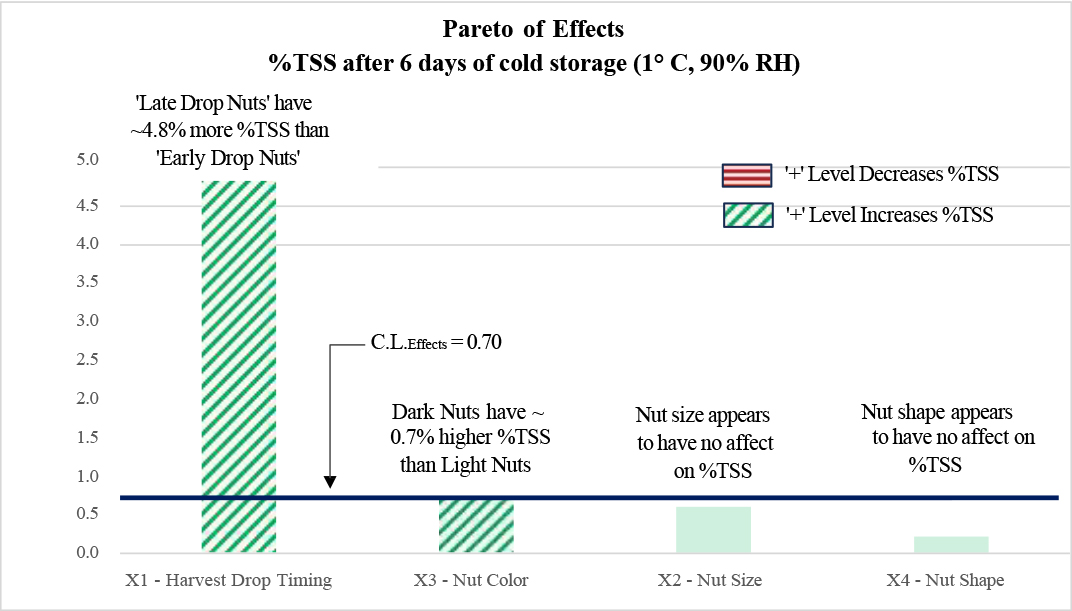
Figure 1. Pareto of Effects for %TSS after six days of cold storage.
- When X5 is ‘+’, i.e., %TSS after 20 Days of Cold Storage at 1° C/90% RH
Figure 2 shows factor effects at the ‘+‘ setting of X5 (i.e., after 20 days of cold storage). As before, the effects exceeding the C.L.effects are considered statistically significant (with at least 95% confidence).
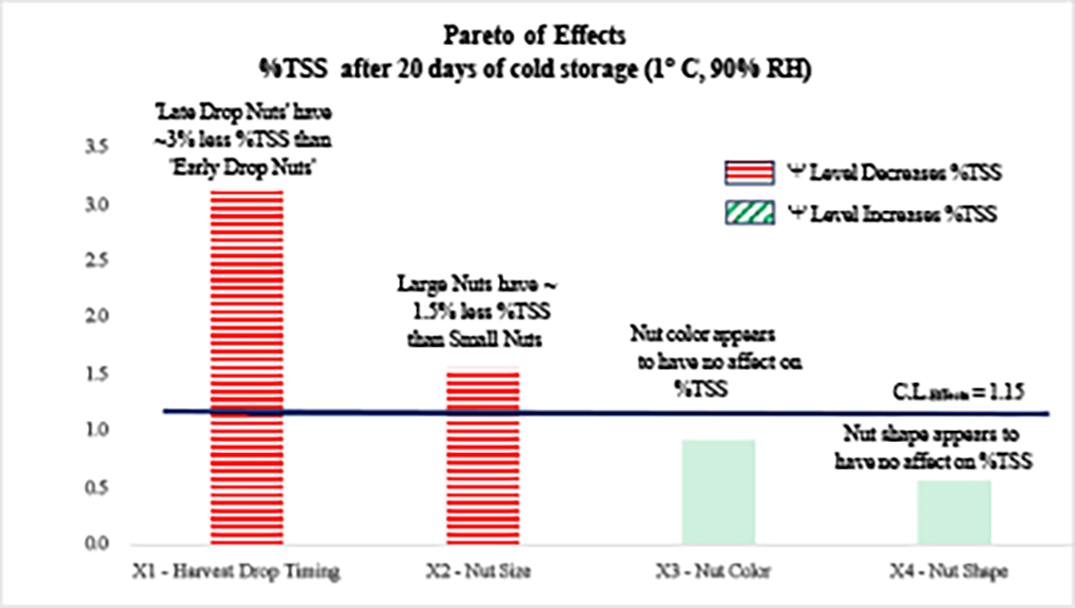
Figure 2. Pareto of Effects for %TSS after 20 days of cold storage.
So, compared to factor effects after six days of cold storage, we have some differences 14 days later.
First, nut color potency has remained about the same as two weeks earlier (0.92% vs. 0.73% earlier), but now has dropped out of statistical significance due to a bit more noise in this post 20 day cold storage dataset (inflating C.L.effects to 1.15 from the previous 0.70 for the six days of cold storage analysis).
Nut size has increased in potency becoming statistically significant (rising from an insignificant +0.59% to a statistically significant -1.55% now). Its horizontal shading in figure 8 indicates that the ‘+’ setting now averages below the ‘-‘ setting. This means that large nuts have not increased their %TSS over this 14 day cold storage period as much as small nuts have, with small nuts now averaging 22.20% %TSS vs. 20.65% for large nuts (p-value = 0.018). So, after six days we had no discernable effects due to nut size, but now two weeks later, small nuts are converting starch to sugars at a higher rate than their counterparts; becoming sweeter faster. The dynamics behind this are unclear at this time.
Finally, and most importantly (due to the magnitude of its influence), harvest drop time is not only significant after 20 days of cold storage but has reversed its effect from two weeks earlier. It has gone from late dropping nuts averaging ~4.8% points more %TSS (after six days of cold storage) to now averaging ~3% less points than early drop nuts 14 days later. Late dropping nuts at this point now average 19.83% %TSS vs. 22.93% for early droppers; p-value = 4.82E-07.
This phenomenon is illustrated in the interaction plot below in Figure 3.
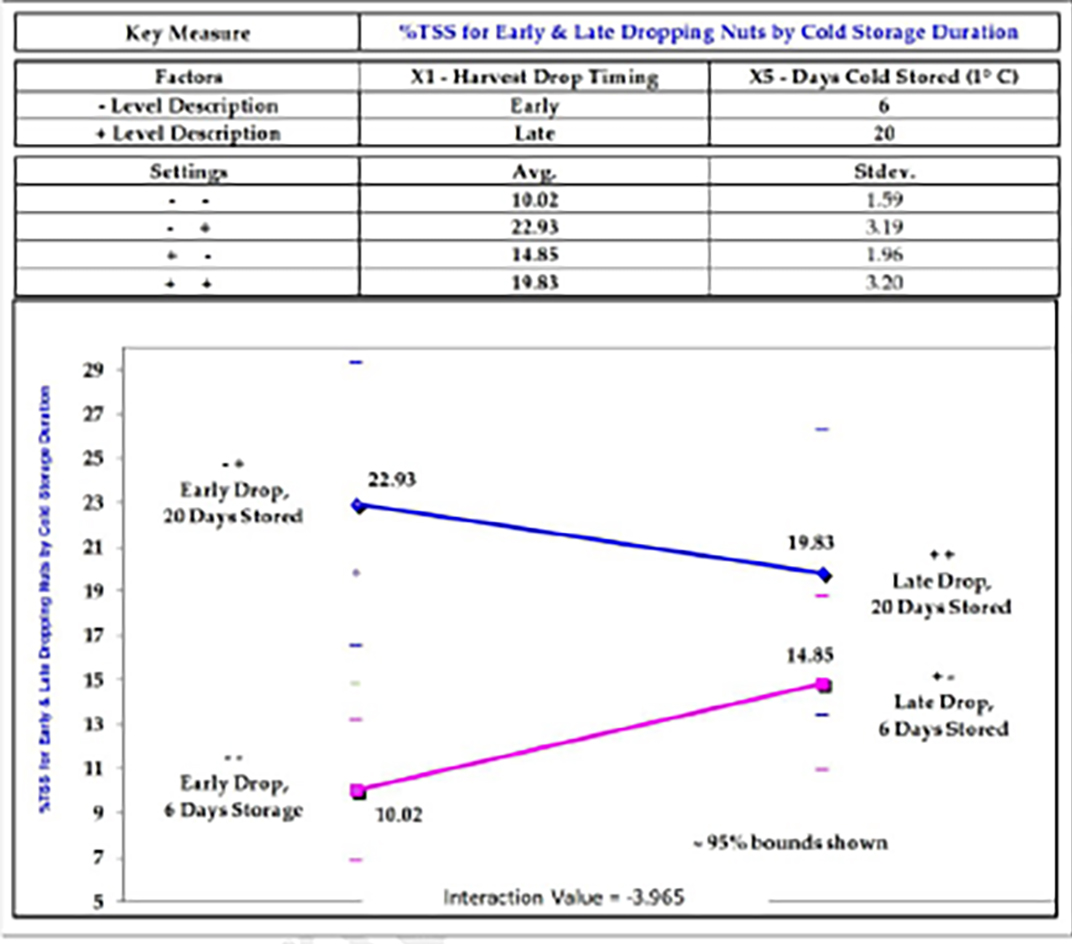
Figure 3. Interaction plot of X1X5 showing how early drop nuts start with lower %TSS (than late drop nuts), but then increase more during additional cold storage compared to late dropping ones. Each of the 4 points in this interaction plot are statistically different from the other three.
In Figure 3, one can see that late dropping nuts start off with more natural sugars (i.e., %TSS) than early droppers do, apparently curing on the tree a bit with the extra two weeks they have to do so (averaging %TSS = 14.85% after six days of cold storage vs. 10.02% for early droppers after the same six days of cold storage) as mentioned earlier. But then in cold storage over another two weeks the late dropping nuts have a much lower rate of increase (from 14.84% to just 19.83%) than do their early dropping counterparts (rising from 10.02% to 22.93%). These two rates of %TSS increasing over cold storage time, namely 0.356%/day for late droppers vs. 0.922%/day for early droppers are statistically different from each other (p-value = 1.71E-25).
- %TSS for Seven Days at 22° C/50% RH, after 20 Days Cold Storage at 1° C /90% RH
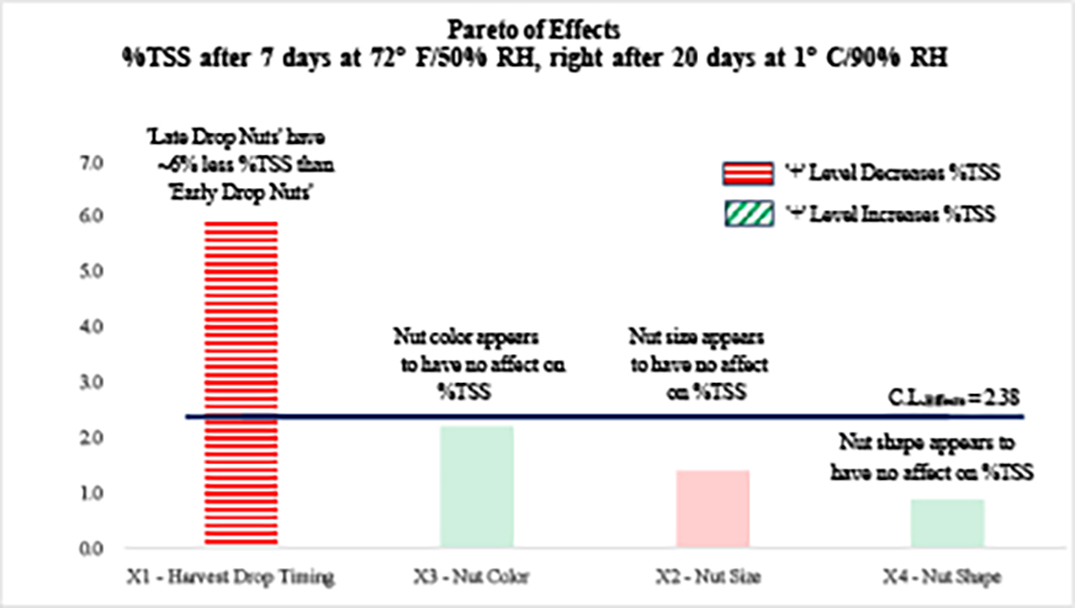
Figure 4. Pareto of Effects for %TSS after 20 days of cold storage followed by seven days of room temperature curing.
Figure 4 shows factor effects at the ‘+‘ setting of X5 (i.e., after 20 days of cold storage), but after another seven days of room temperature storage (22° C/50% RH). As before, the effects exceeding the C.L. effects are considered statistically significant (with at least 95% confidence).
In Figure 4, we see a number of changes due to the room temperature cure of seven days. The effect for drop timing nearly doubles (relative to before this room temperature cure), that for ‘nut size’ is reduced (becoming statistically insignificant), nut color remains insignificant (despite more than doubling its effect) and finally nut shape continues to be inconsequential as before.
The key finding here is that early drop nuts continue to extend their difference in %TSS, relative to late drop nuts (33.38% vs. 27.41% respectively; p-value = 9.03E-07).
- %TSS Overall Cure Rate Characterization
Taking all of the above into account we can now develop %TSS curing characterization plots for the experimental timeframe tested. Figure 5 shows those results.
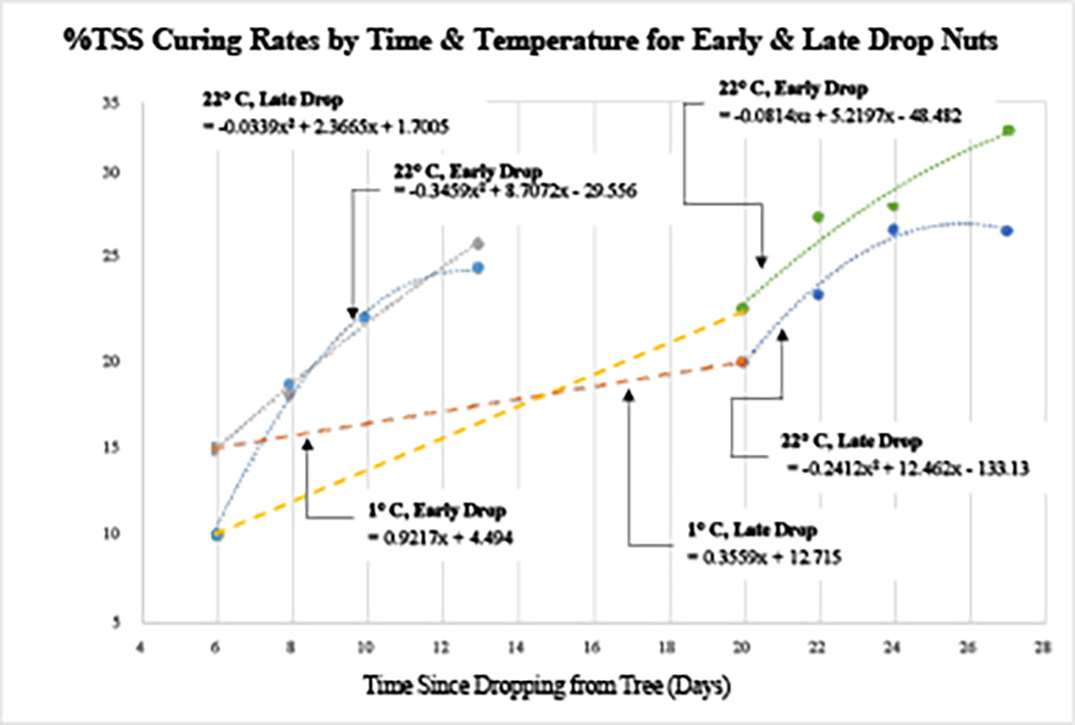
Figure 5. Dunstan chestnut curing for early and late dropping nuts under storage regimens simulating typical producer cold storage followed by consumer room temperature curing to bring nuts to maximum sweetness (i.e., %TSS).
First, starting in the middle of the Figure 5 plot, shown in heavy dashed orange, we see how early and late drop nuts cure at statistically differing rates when under cold storage (p-value = 1.71E-25).
Next, on the lefthand side of the plot, we see observed cure rates over seven days of room temperature (after six days of cold storage) for both late and early drop nuts. We see that starting this seven day room temperature period (starting on day 6), late drop nuts are higher in initial %TSS than early drop nuts (14.85% vs. 10.02% respectively; p-value = 6.53E-27). Now, looking at the end of the seven day room temperature curing period we see the late droppers maintaining a slightly higher %TSS there as well, however the difference here is no longer statistically significant (i.e., 26.7% for late droppers vs. 25.3% for early ones; p-value = 0.184). So, technically we conclude no evidence of a difference here. The shape of the plot for the early drop, warm cured chestnuts might lead one to conclude its topping off, whereas the late drop plot does not. But speculating outside of the experimental range is unadvised, so no conclusions are made here regarding ultimate %TSS obtainable under this regimen. At least we know attainable %TSS for the Dunstan chestnut (after a six day cold storage period followed by seven days of warm cure) is in the mid to upper twenty percentage range, comparable to that found for Chinese chestnuts (castanea mollissima; Blume cultivar) (Miller, 2009).
To summarize results for room temperature cure after six days of cold storage, we have a %TSS difference at the beginning of the seven day warm cure (between early and late drop chestnuts), and then all else is roughly equal thereafter.
Moving on to the righthand side of Figure 5, we see the extension of curing rates for early and late drop nuts under seven days of room temperature curing after 20 days of cold storage. This graphically shows how early drop nuts progressively attain higher %TSS at the end of this room temperature cure period relative to late drop nuts (averaging 33.38% vs. 27.415% respectively; p-value = 9.03E-07), and also how these early drop nuts exceed both early and late dropping nut’s %TSS after a shorter, six day cold storage period (with those values being 25.30% vs. 26.65% respectively). This implies that somehow the lengthier cold storage followed by room temperatures taps into otherwise latent %TSS, but for early dropping nuts only, as late droppers end up comparable whether experiencing six days of cold storage or 20 (26.65% vs. 27.41% respectively; p-value = 0.417).
This value of 33.38% may be one of the highest published %TSS averages for any chestnut variety or cultivar/genotype in the technical literature. The only other comparable results found were 30.7% for sucrose plus fructose for European chestnuts (castanea sativa; Miller-Famosa cultivar) (Chenlo et al., 2010) and 31.0% for total sugars for Japanese chestnuts (castanea cretana; Eunki Miller cv. Marrone Fiorentino) (Kwon et al., 1998). But since %TSS includes all dissolved solids (with most being sugars) these other results could be considered comparable or possibly exceed that of 33.38% %TSS found here.
- Discussion of %TSS Cure Rate Characterization Results.
There are a number of %TSS curing findings uncovered in this research. Those of lesser impact are dark nuts averaging 0.7% points more %TSS than light colored nuts (after six days of cold storage), and small nuts averaging 1.5% points more %TSS than large nuts (after 20 days of cold storage).
Findings of higher impact will be the focus of the discussion here. They relate to harvest drop timing and are:
- Early drop nuts average ~5% points less %TSS than late drop nuts (after six days of cold storage).
- Early drop nuts increase in %TSS (from six days to 20 days of cold storage) ~2.6x faster than late droppers, ending with ~3% points more %TSS on average (at day 20).
- Under room temperature curing for 1 week (after 20 days of cold storage), early drop nuts average ~6% points more %TSS than late drop nuts, reaching over 33% %TSS.
These findings show that harvest drop timing has an impact on:
- initial %TSS off the tree (presumably, as the first assessment made here was after six days of cold storage)
- the rate at which %TSS increases under postharvest cold storage and
- the ultimate value of %TSS obtainable.
Since sweetness is the primary quality characteristic of chestnuts, and %TSS is used as a surrogate for sweetness here, understanding what is occurring with %TSS and harvest drop timing has practical significance.
It is beyond the scope of this research to comprehensively explain potential morphological differences within nuts driving these observed drop timing differences. However, there is anecdotal evidence that may explain the cause of them.
That is, nut location on a tree may be correlated with drop timing. So, nuts on the sunnier SSE to WNW side may be maturing and dropping earlier than those elsewhere on the tree, benefiting from a sunnier location. Conversely, those elsewhere on a tree may tend to drop later having struggled more to develop (relative to their sunnier side counterparts). Consequently, perhaps late dropping nuts start with higher %TSS as observed here, having cured a bit on the tree with their longer time there, but have been hampered in their overall propensity to sweeten, due to inhibited development due to their location on the tree. Aydin et al. ( 2021), have characterized significant within chestnut tree variability of other phytochemical contents which may lend support to this theory.
Chestnuts would not be the only fruit subject to this ‘location on tree’ phenomenon. Oranges for instance, have substantial within tree %TSS variability related to where the fruit sits relative to sun exposure. Significant %TSS differences have been found around orange tree’s circumference, as well as between inside and outside canopy locations and on branch heights of trees; with more sun equating to higher %TSS (Reitz and Sites, 1948).
It is worth noting that drop time herein however, was not originally based on timing within a tree’s drop cycle, but rather based on the overall, typical five week harvest calendar. Early droppers were simply gathered during the period of 9/15 - 9/19 and late droppers between 9/30 – 10/2, independent of what was happening within their host tree (Figure 6). In retrospect, factor levels based on tree’s early and late droppers may have been more insightful.
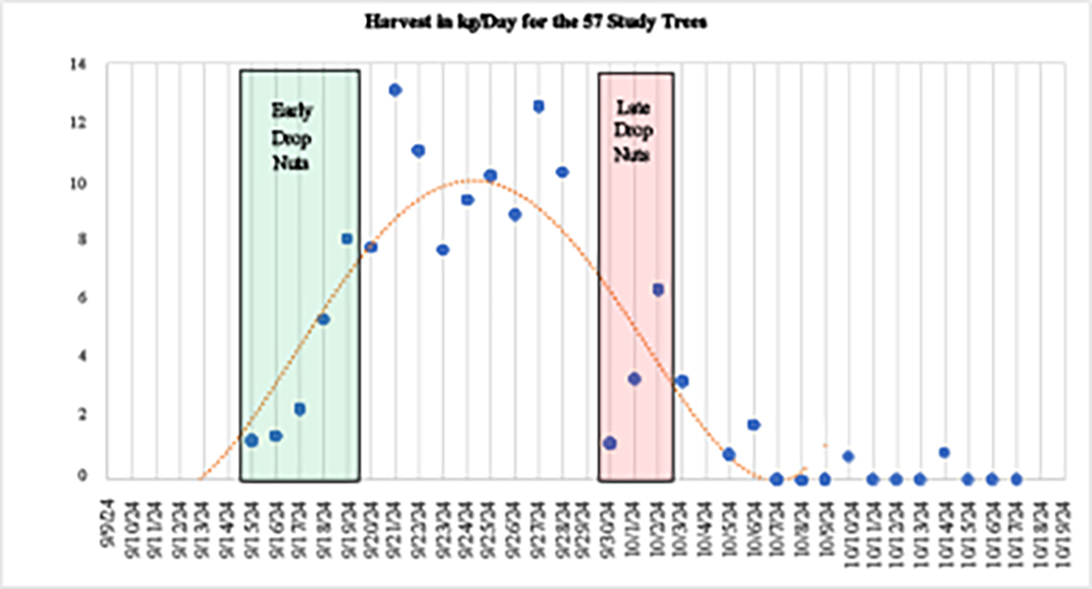
Figure 6. Timing of early and late dropping nuts used in lab analyses.
Figure 7 illustrates where early and late dropping study nuts happened to fall within their respective tree’s drop cycles (which averaged 17 days duration for those trees yielding >= 0.5 kg). Figure 7 shows that early drop nuts were dropping early in their tree’s drop cycle (1st quartile) while late drop nuts were not quite so extreme, being more in their tree’s 3rd quartile of drop timing. Consequently, it’s possible the drop timing factor effect estimated herein may be slightly understated.
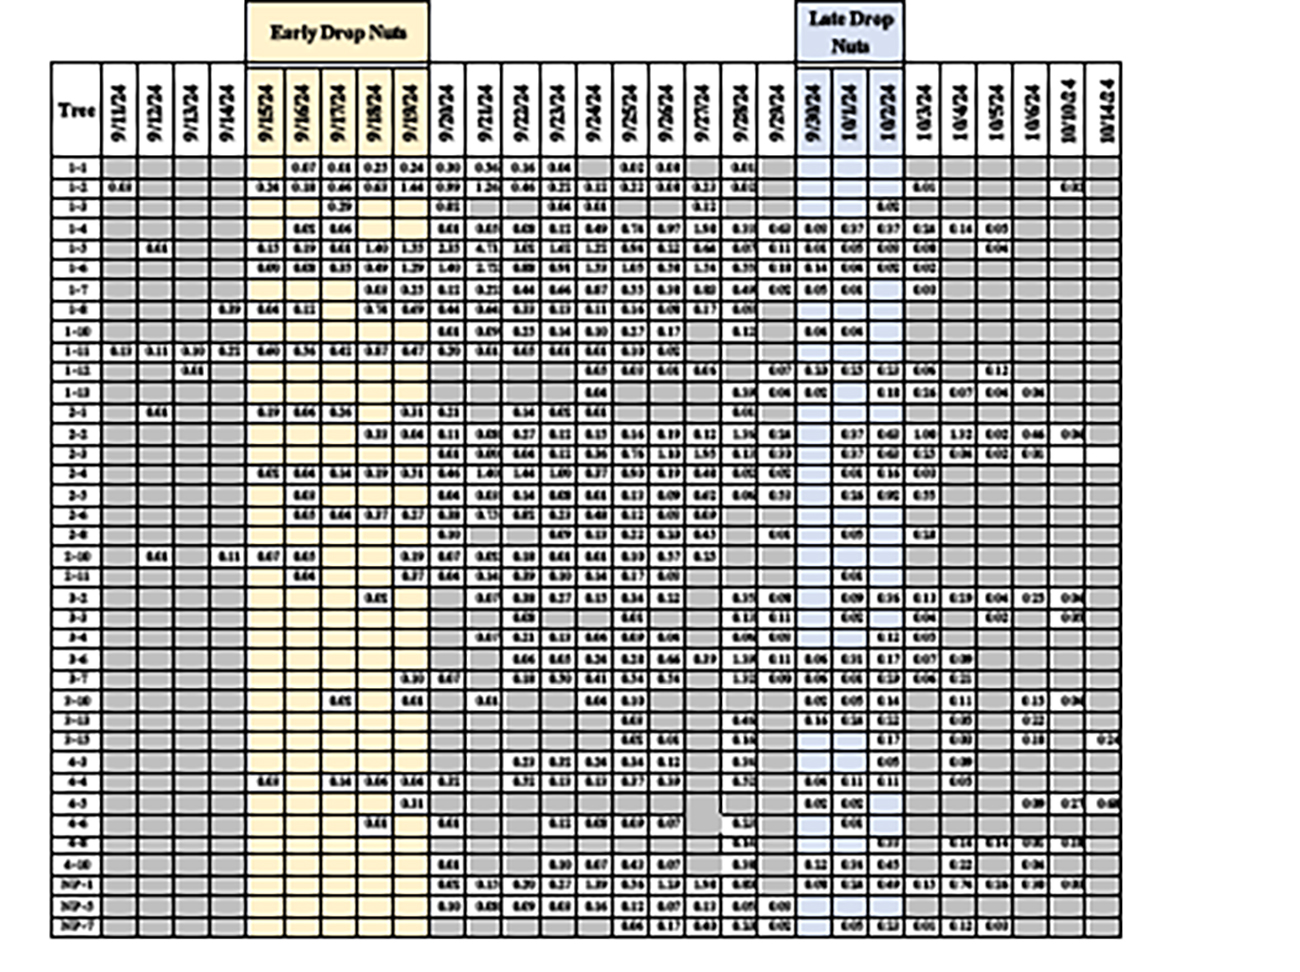
Figure 7. Chestnut harvest yield (in kg by day for the 38 study trees that yielded > 0.50 kg yield), showing early drop nuts are very early during their trees drop cycle (‘1st quartile’) and late drop nuts are not quite as extreme (being more from the ‘3rd quartile of their drop cycles).
If the theory of drop time being correlated with sun exposure (and affecting nut morphology) is true, future studies assessing sweetness (and other characteristics such as moisture content addressed below) should take this influencer into account. A study like Reitz and Sites, evaluating %TSS as a function of sun exposure ‘within tree’, would be beneficial to validate and better understand why early and late dropping nuts differ in terms of this key measure of chestnut quality.
% Moisture Content (%MC)
Like for %TSS, Factor X5, ‘Days Cold Stored’ (1° C, 90% RH) with its tested settings of six days vs. 20 has been found to have a significant effect on %MC. Consequently, statistical analysis of the other 4 factors has been done separately for each of the two settings of X5.
- When X5 is ‘-’, i.e., %MC after Six Days of Cold Storage at 1° C /90% RH
Figure 8 shows factor effects at the ‘-‘ setting of X5 (i.e., after six days of cold storage). Factors exceeding the ‘bar of statistical significance’, called C.L.effects in Figure 8, are considered statistically significant (with at least 95% confidence).
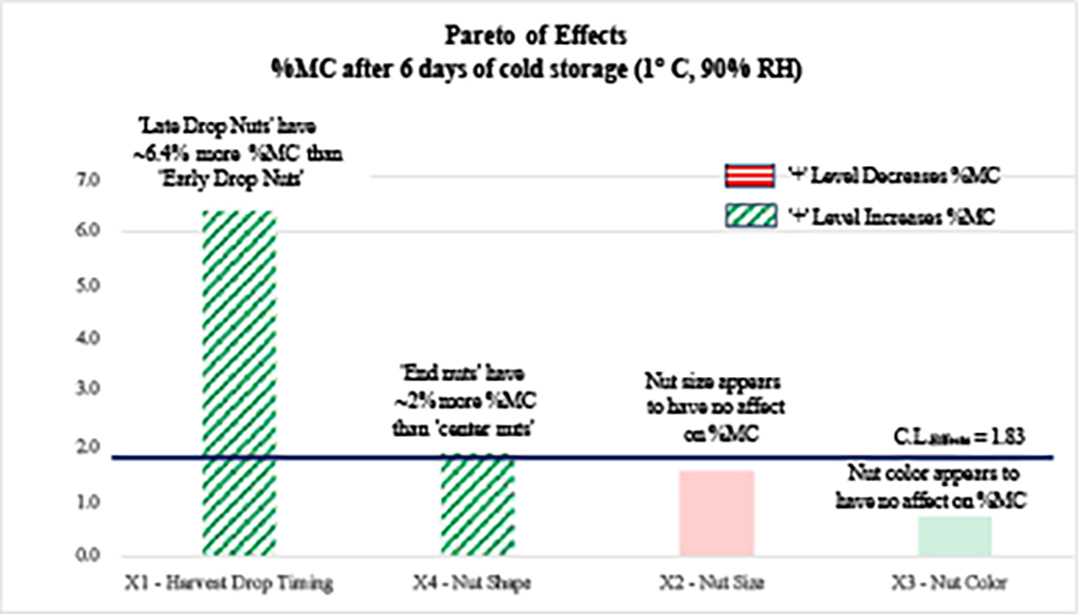
Figure 8. Pareto of Effects for %MC after six days of cold storage.
We can see in Figure 8 that two factors are influencing nut moisture content (%MC) after six days of cold storage. Like for %TSS, drop timing is the more potent, with late dropping nuts possessing more moisture (they also possessed more %TSS) than early dropping nuts (57.97% vs. 51.59% respectively; p-value = 5.57E-17).
Along with this, end nuts were observed to contain slightly more moisture on average than center nuts (55.53% vs. 53.40%; p-value = 0.016).
- When X5 is ‘+’, i.e., %MC after 20 days of Cold Storage at 1° C /90% RH
Factor effects after 20 days of cold storage are shown in Figure 9.
Here we see that after 20 days of cold storage (compared to six days cold storage just discussed), the previously significant influences of harvest drop timing and nut shape have disappeared, so no evidence of them having an effect on resultant moisture content after 20 days. It’s possible these effects at six days are remnants of initial ‘off the tree’ circumstances, diminishing slowly over time, but that is speculative.
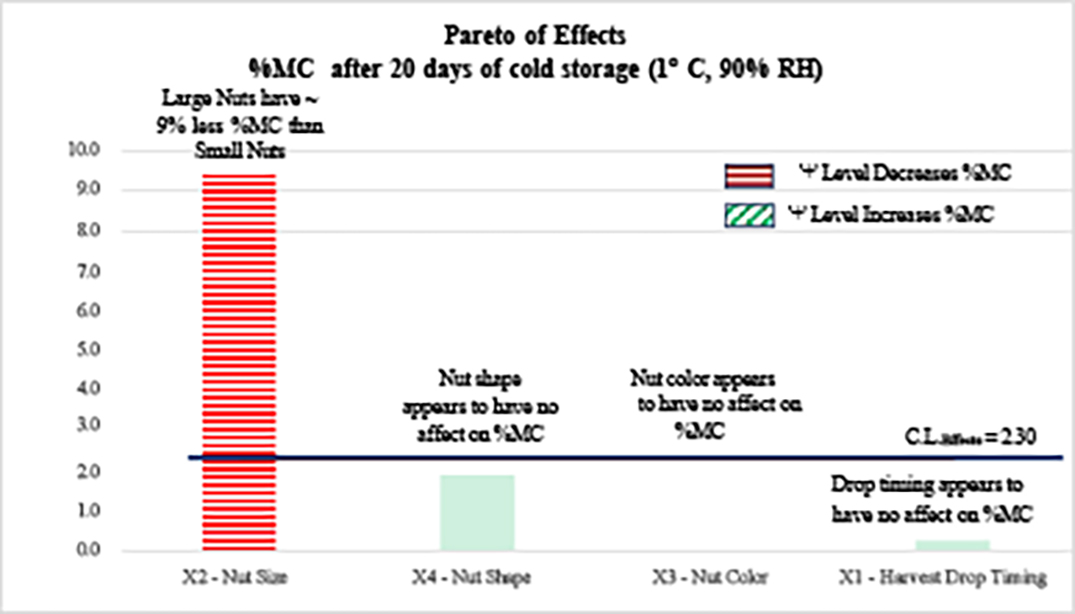
Figure 9. Pareto of Effects for %MC after 20 days of cold storage.
Nut size however, has increased its potency significantly. Now, after 20 days of cold storage, large nuts possess on average 9.38% points less moisture than small nuts (50.76% vs. 60.14%; p-value = 1.07E-17). This is an increase from the previous insignificant 1.57% difference observed 14 days earlier.
Checking into this further, we see that while drop timing has no overall effect now, it does have an influence on large nuts only and not small ones, thereby masking its influence.
Figure 10 illustrates this, where we see that small nuts hardly differ based on harvest drop timing (60.7% for early droppers vs. 59.21% for late droppers; p-value = 0.279), but large nut’s moisture content differs significantly depending on whether they dropped early or late (47.32% and 53.58% respectively; p-value = 2.16E-08). So, for large nuts, when they drop significantly influences their ability to retain moisture over this lengthier time of cold storage.
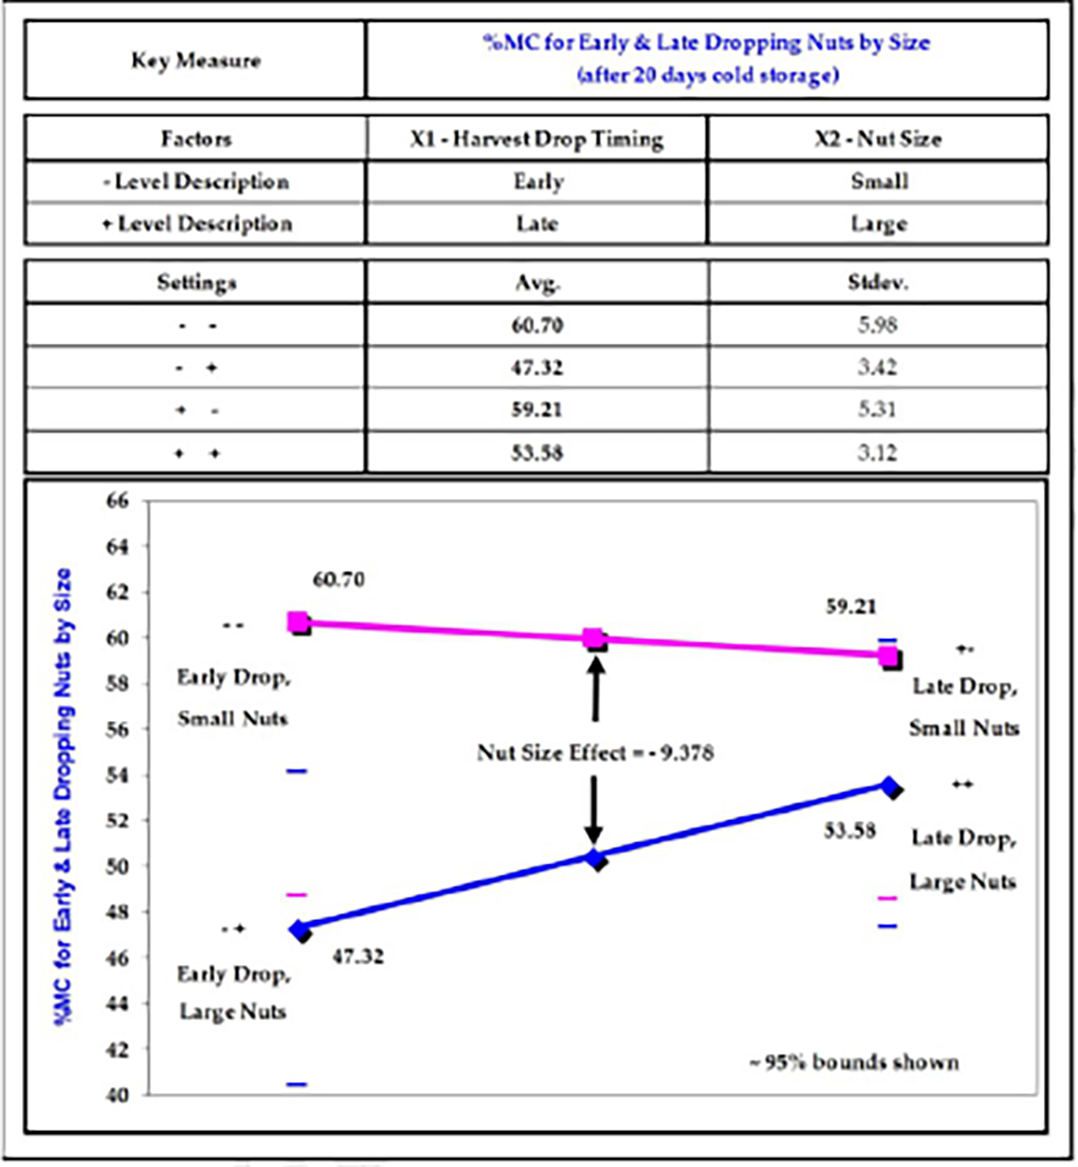
Figure 10. Interaction plot of Harvest Drop Timing (X1) vs. Nut Size (X2) after 20 days of cold storage.
There is another important aspect of moisture content based on nut size and harvest drop timing. That is how moisture content changes from early in cold storage to later. Figure 11 illustrates this.
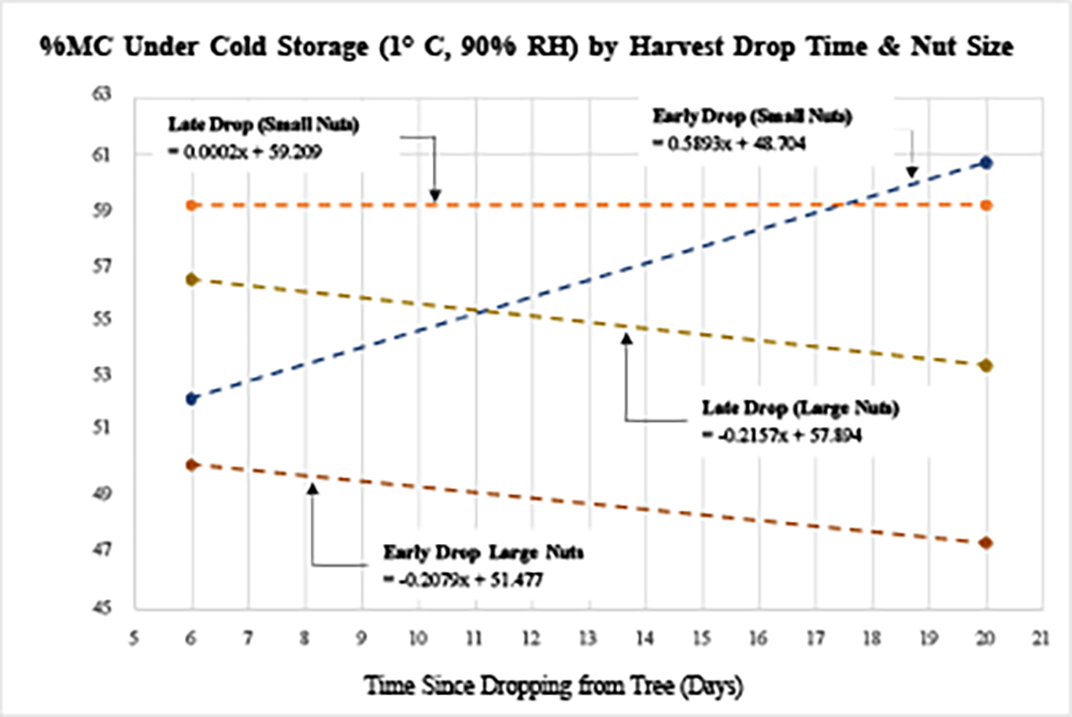
Figure 11. Moisture content under cold storage over time by harvest drop timing and nut size.
Here in Figure 11, we see that large nuts lose moisture at comparable rates for both harvest drop times (~0.21%/day each), with late droppers starting off higher (56.6%) and early droppers lower (50.07%). We also see that small late droppers remain steady in terms of moisture content across this time frame (59.210% to 59.213% 14 days later), and lastly that small early droppers actually increase in %MC, rising from 52.39% after six days of cold storage to 60.70% %MC 20 days later (p-value = 1.05E-10). This rate of increase for small early droppers (0.5893%/day) statistically differs from the flat line rate exhibited by small late droppers (p-value = 5.15E-07).
So, what’s causing these differences between large and small nuts in terms of their moisture content, with large ones losing ~ 0.21%/day and small ones either losing none (late droppers), or increasing ~0.59/day (early droppers)? Clearly, there are differences in chestnut morphology based on drop timing and nut size like that discussed for %TSS.
- %MC for Seven Days at 22° C/50% RH After 20 Days Cold Storage at 1° C/90% RH
Figure 12 shows factor effects after seven days of room temperature curing performed after 20 days of cold storage.
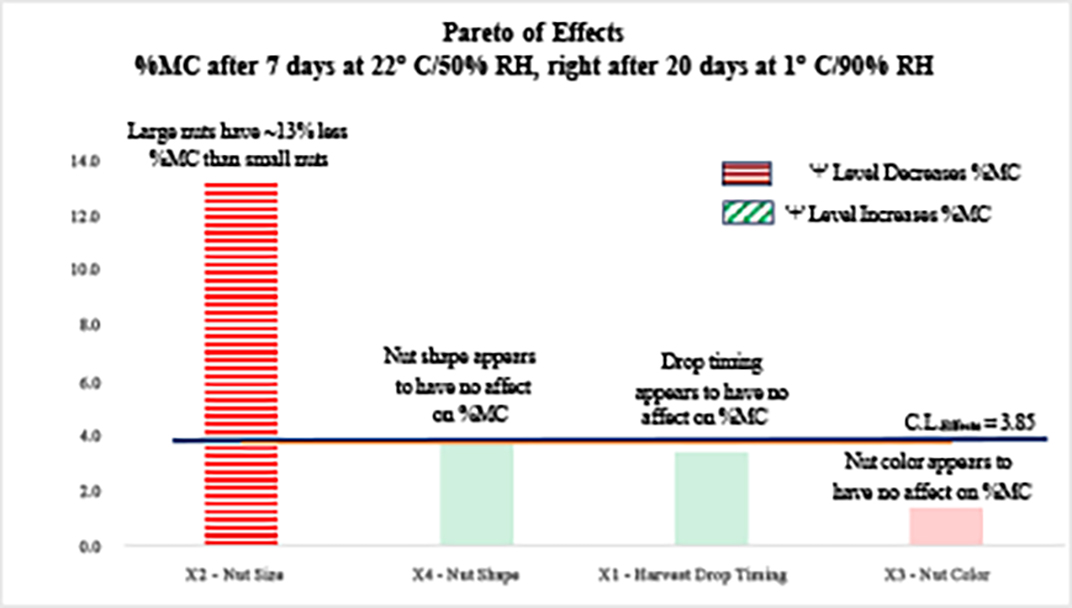
Figure 12. Pareto of Effects for %MC after seven days of room temperature following 20 days of cold storage postharvest.
Now we see that after seven days of room temperature curing (on top of 20 days of cold storage), nut shape and harvest drop timing are close to being statistically significant, with late droppers averaging ~3.4% points more than early droppers (47.88% vs. 44.48%; p-value = 0.082) and end nuts averaging ~3.7% points more than center nuts (47.87% vs. 44.16%; p-value = 0.055). Technically, they are insignificant but close enough to keep in mind.
The big finding here however is that nut size further increases its influence on moisture content of these chestnuts. Large nuts now have over 13.3% points less moisture than their small nut counterparts (51.75% vs. 38.42% respectively; p-value = 7.99E-15). So, going back to the circumstance after six days of cold storage, large nuts averaged just 1.57% points less than small ones, then after 20 days of cold storage this grew to 6.38%, and now after seven days of room temperature (on top of 20 days of cold storage), large nuts average 13.33% points less moisture.
- %MC Characterization During Curing
Taking all of the above in to account, Figure 13 presents moisture content (MC%) rates during the studied timeframes and temperatures, including the significant nut factors of size and drop timing.
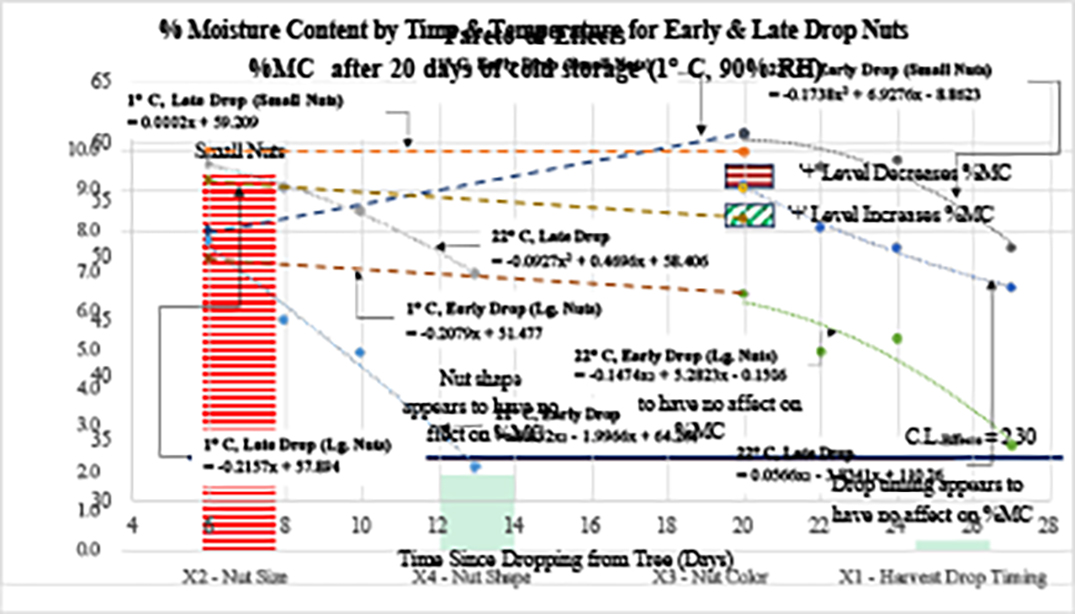
Figure 13. Dunstan chestnut % moisture content (%MC) for early and late dropping nuts under storage regimens simulating typical producer cold storage which is then followed by consumer room temperature curing.
The heavy dashed lines show what was discussed in Figure 11, namely moisture rates from six days of cold storage postharvest to 20 days of the same.
On the lefthand side of Figure 13, we see moisture loss under 22° C room temperature curing (after six days of cold storage), done for both early and late drop nuts where nut sizes have been combined for clarity (as trends for large and small nuts are comparable). Here we see that early drop nuts appear to lose moisture faster, losing ~2.71%/day vs. ~1.31%/day for late drop nuts (p-value = 1.68E-10).
On the righthand side of Figure 13, we see moisture loss under 22° C room temperature curing (after 20 days of cold storage). This is done for small nuts (with early and late droppers combined for clarity as their trends are comparable) and large nuts with early and late drop trends characterized. For these large nut trends, %MC for early drop and late drop nuts are comparable (1.82%/day vs. 1.61%/day moisture loss respectively; p-value = 0.451). Moisture loss for small nuts however, differs from large early droppers (1.14%/day loss vs. 1.82%/day; p-value = 0.017), but does not technically differ from large late droppers (1.14%/day loss for small nuts vs. 1.61%/day for large late droppers; p-value = 0.059), although it’s close.
- Discussion of %MC Rate Characterization During Curing
There are a number of %MC findings uncovered here. One of lesser significance is that end nuts average ~2% points more %MC than center nuts after six days of cold storage, and are close to statistically demonstrating this tendency after 20 days of cold storage (~2%) as well as after room temperature cure for seven days (after 20 days of cold storage) (~3.7%). This tendency is not presently understood. Perhaps future research can pursue understanding of why end nuts possess slightly higher moisture than their center nut counterparts.
Findings of higher importance will be the focus of this discussion here though. These relate to harvest drop timing and nut size influences on %MC. Those influences are:
- Independent of other effects (like drop time and nut shape) large nuts possess lower moisture than small nuts, with the difference being modest early (1.57% points less after six days of cold storage), but then progressively increasing postharvest (being 9.38% points less after 20 days of cold storage and then 13.3% points after seven days of room temperature after that 20 days of cold storage). Consequently, this implies large nuts possess characteristics that allow for faster moisture loss than smaller nuts. A theory of why this is, uncovered here, is that the peel (pericarp) is less robust (thinner or less dense) in larger nuts. Figure 14 illustrates this possibility.
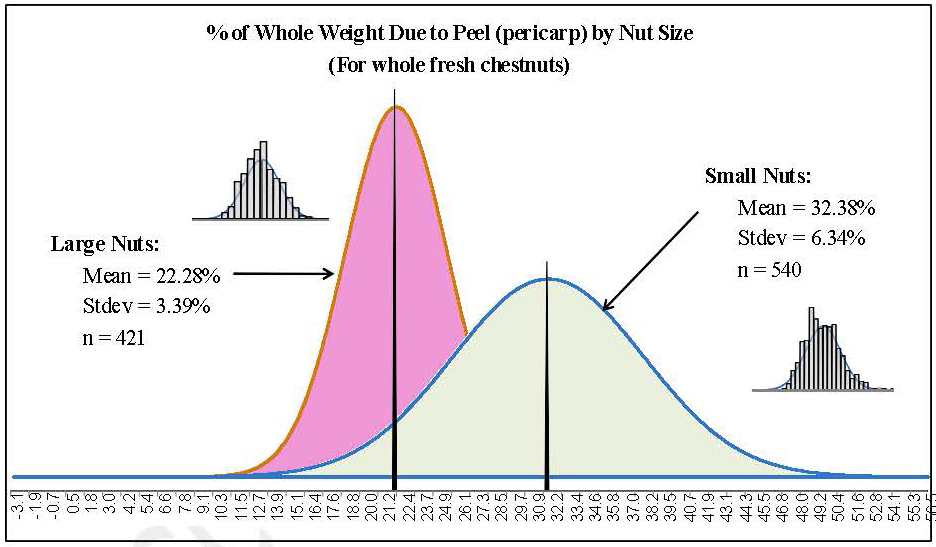
Figure 14. Comparative histogram of percent of whole fresh chestnuts weight due to the peel for large and small nuts.
Here we see that the weight of large nut peels tends to be a smaller percentage of large nut’s total weight, than is the case for small nuts. These peel weight %’s are statistically different; p-value = 1.67E-146, and may be indicating that small nuts possess a more robust pericarp on average than large nuts do, explaining large nut’s propensity to lose moisture faster than small ones. Future research is encouraged to validate or invalidate this theory, which could be done by measuring peel thickness, peel density and other nut characteristics.
- During room temperature curing, after six days of cold storage, the rate of moisture loss for early drop nuts is double that for late dropping ones. So, like for %TSS, it appears harvest drop timing has an impact on nut morphology where it affects moisture loss as well. Pulling %TSS into the discussion, we have early drop nuts starting off with lower %TSS and lower %MC after six days of cold storage, then they become comparable in %TSS with their late drop counterparts after seven days of room temperature curing, but lose ~10% points of moisture in the process (compared to late droppers). These are complicated circumstances beyond the scope of this research to clarify. We again encourage exploration into these dynamics.
- Lastly, going back to what was just mentioned, we observe after six days of cold storage, that early drop nuts average less %MC than late drop ones. At this point in the cold storage process, nut size was at best a modest influence on %MC, mentioned in ‘i’ above. But now, during an extended cold storage period (14 more days), the rate of moisture loss doesn’t appear to simply depend on when nuts fall, but depends on their size as well. During this 14 day period, large nuts lose moisture at roughly the same rate whether they were early droppers or late (~ 0.21%/day each), but in contrast, small late droppers hold steady on their moisture content (59.210% to 59.213% 14 days later), and small early droppers actually increase significantly (rising from 52.39% to 60.70%; a 0.59%/day rate). So, what could be causing small nuts to behave so differently from large ones, and also from each other (based on their drop timing)? Clearly, as mentioned for %TSS above, nut morphology is presumably altered by drop timing, and these moisture losses during extended cold storage appear to be further evidence drop timing affects %MC as well as %TSS. So, basically what we have is a situation where early droppers appear to lose moisture quicker than late droppers when under room temperatures, but they don’t maintain this tendency under cold (as moisture loss is identical for large early and large late dropping nuts in cold conditions, and either holds steady for small late droppers or increases for small early ones). On top of this, we have small early droppers apparently absorbing moisture during cold storage, bucking the trend of the others. All of this suggests some complex dynamics and attempting to explain it is beyond the scope of this paper. Research is again encouraged to pursue answers to these questions, so we can better understand the Dunstan chestnut and the effects these previously untested factors have on chestnut quality characteristics.
CONCLUSION
The key to maximizing chestnut consumer delight is for nuts to be consumed at their optimal cure state; that being maximum sweetness coupled with sufficient moisture content. Providing insight towards this has been the goal of this research. It has aimed to do this by providing a rigorously developed reference to help growers and consumers estimate when nuts are near optimal, and what should be done in terms of a room temperature dwell to get them there. Characterizations of %TSS and %MC are considered the key contributions in this vein, providing rates of cure, rates of moisture loss, indications of nut’s potential sweetness and associated moisture content at various stages of the storage process. It is hoped these findings prove useful and inspire new research to answer the numerous questions raised.
“Regarding new research, a meta-analysis combining these findings and those of previous chestnut curing rate studies (Kawano et al., 1984; Normura et al., 1995; Nha and Yang, 1996; Kwon et al., 1998; Jermini et al, 2006; Miller, 2009; ; Chenlo et al., 2010; Cecchini et al., 2011; Ertan et al., 2015) is encouraged and believed worthy of pursuit. Direct comparisons between studies are hindered due to combinations of study differences such as knowledge of chestnut thermal/RH history prior to initial sweetness/%MC assessments (some unknown), storage approaches postharvest (beyond time, temperature and RH) such as nut containers used (paper bags, poly film, poly pouches, trays), postharvest treatments (water curing, controlled atmospheres), assessment approaches used (individual sugars vs. %TSS), methodologies employed to obtain assessments (HPLC, spectrophotometer, refractrometer, ion-exchange chromotography) as well as of course differences in varieties, cultivar/genotypes and locations studied. A meta-analysis across these studies, accounting for differences, may provide valuable insight useful to growers of various cultivar/genotypes across diverse locations.”
Educational & Outreach Activities
Participation summary:
A manuscript detailing this research and its findings is currently under peer review in the Journal of Agriculture, Food, Environment and Animal Sciences. This is an open access journal and once accepted for publication will be attached to this report for dissemination.
Learning Outcomes
Project Outcomes
This new to the world insight into curing rates (and associated moisture loss) of the popular Dunstan chestnut (as grown in the Southern Appalachian Blue Ridge Mountains), enables growers the necessary knowledge to bring chestnuts to their optimal cure at the moment of consumption, thereby improving the consumer experience with the sweetest and moistest nut experience possible.
This replaces the current hit and miss approach, where consumers blindly consume chestnuts unaware of their cured state, often experiencing under-cured nuts that are bland and over-cured ones that are dry.
This resultant improvement in the consumer experience is believed key to increasing demand for this product, a product that once prospered Appalachia, perfect for chestnut orcharding but plunged into poverty with the great chestnut blight of the early 1900's. These research findings therefore facilitate Appalachia's return to its pre-blight prosperous roots, aiding in the re-introduction of this pre-blight staple, and re-establishing Appalachia as the home of world's finest and sweetest chestnuts.
This research has shown that the morphology of chestnuts is different in terms of key quality characteristics (brix and moisture content) based upon when they drop during harvest. More in depth research into this would be beneficial. This may be the subject of a future grant submission.