Final report for FW20-360
Project Information
The integration of cover crops is gaining popularity with producers as a way to improve soil health, minimize inputs and create more resilient agricultural systems. While cover cropping is gaining attention nationally, only a handful of producers in the Palouse region of the inland Pacific Northwest are experimenting with cover crops due to a lack of regionally specific research and resources. To address this need, Lester Wolf Farms INC., the Palouse Conservation District and local Natural Resource Conservation Service staff worked together to develop an economically sustainable cropping system, integrating cover crops in the high precipitation zone of the Palouse region to promote soil health, and reduce synthetic fertilizers and herbicides. This three-year project experimented with fall seeded cover crops in the traditional winter wheat-spring wheat-pulse rotation. A block design containing six strips, three business-as-usual strips (control) and three cover crop strips (treatment), was set up in all three of the traditional crops planted, resulting in 3 blocks and 18 strips. Soil physical and chemical data were collected from each strip along with crop yields and farm level inputs to calculate relative profitability. Results were shared through field tours, stakeholder workshops, fact sheets, a peer reviewed article and a video. Outcomes included: a reduction in glyphosate application by 62%; new information on cover crops as a weed management tool was gained such as the fact that the cover crop triggered weed germination; the discovery of cover crop mixes, rates and timing in order to successfully utilize cover crops in our region; and decreased synthetic fertility needs as a result of soil biodome health.
The overarching goal of this study was to develop an economically sustainable cropping system that integrated cover crops with cash crops in the high precipitation zone of the Palouse to promote soil health, and eventually reduce or eliminate synthetic fertilizers and herbicides.
This goal was accomplished through the following objectives:
- Assessed the effects of successfully established fall and spring cover crop mixes on weed pressure and key chemical and biological indicators of soil health.
- Evaluated and compared the economic returns of the selected cover crop mixes vs. business-as-usual (no cover crops) in the high precipitation zone of the Palouse.
- Developed and disseminated management recommendations for farmers based on these results through field tours, stakeholder workshops, fact sheets, a peer reviewed article and a video featuring the project that highlights successes, failures and recommendations for new adopters.
All major milestones and activities associated with the objectives detailed in this project can be found in the attached timeline.
Cooperators
- - Technical Advisor
- (Researcher)
- - Producer
Research
Lester Wolf Farm INC. will partner with the Palouse Conservation District (PCD) and the Colfax Natural Resource Conservation Service (NRCS) office to meet the goals and objectives outlined for the project. The materials and methods used to achieve these objectives are outlined below.
Objective 1: Assessing the effects of cover crop mixes
The Lester Wolf Farm is typically cropped with soft white winter wheat, soft white spring wheat, and garbanzo beans in a 3-year rotation. Cover crop treatments will be tested at each point in this rotation, so trials will be conducted in three separate fields at the different rotation intervals over three years. Paired plots will be used to compare the cover crop treatment to control (randomly assigned within each block). Each plot will consist of a minimum 400 ft long strip planted with a 36ft wide Cross Slot drill (2 passes). There will be three replications per treatment; refer to Figure 1. Following winter wheat harvest, the goal is to test a fall planted winter hardy cover crop mix, and allow this mix to grow into spring, seeding the next year’s spring wheat crop into the growing cover crop, and terminating the cover crop with appropriate herbicides based on both the cash crop and cover crop’s growth characteristics. The goal is to prolong growth of the cover crop to maximize nitrogen fixation.
Following spring wheat harvest, a different fall planted winter hardy cover crop mix will be tested, and allowed to grow into spring, seeding the next year’s garbanzo crop into the growing cover crop, and terminating the cover crop with appropriate herbicides based on both the cash crop and cover crop’s growth characteristics.
Succeeding garbanzo harvest, winter wheat will be planted with an inter-seeded cover crop mix. This mix will be allowed to grow into the following spring and terminated based on both the cash crop and cover crop’s growth characteristics.
Cover crop establishment and success will be measured using a point intercept method to estimate percent cover of cover crop species, cash crop, and weeds; once prior to snow fall, approximately mid to late November, and prior to termination in the spring. Five clip plots along each transect will be taken to estimate cover crop, cash crop, and weed biomass prior to termination. Every spring, when the soil is at field capacity, soil samples will be taken and soil physical measurements will be collected. A minimum of 10 soil samples will be collected randomly assigned locations in each strip to a depth of 30 centimeters. The samples will be well mixed and composited into a single sample representing the entire strip. Soil chemical and physical parameters will include total soil organic carbon, ratios of active fungi and active bacteria, permanganate oxidizable carbon (POXC), micro and macro nutrients, penetrometer readings and infiltration rates. The cash crop will be harvested with a combine, and yield data will be collected with one combine pass per plot.
Paired t-tests will be used to compare control to treatment for the following data parameters: a) percent cover of cash crop, cover crops, and weeds; b) Biomass of cash crop and weeds; c) soil organic carbon, active fungi/active bacteria, POXC, nitrate and ammonia and; d) cash crop yields. Analysis will be conducted in R, statistical software, using a linear regression model and model assumptions of normality will be used to verify the validity of analysis, and to inform any data transformations.
By conducting this research at every rotation interval, this allows adaptive management to adjust seed mixes, timing of seeding, timing of termination, and other necessary adjustments. Initial cover crop mixes and rates will be based on the resources available from the Natural Resources Conservation Service, and on-farm experimentation that Lester Wolf Farms INC has collected over the last 10 years. The fall seeded cover crop mix following winter wheat currently consists of a three clover blend, radish, and turnip. The fall planted cover mix following spring wheat includes fall triticale, fall oats, canola, turnip, and chicory. Winter wheat will be inter-seeded with a blend of three clovers.
Objective 2: Economic return of cover crops vs. business as usual
An economic analysis of the strip trials associated with this experiment is important in determining the feasibility of integrating cover crops into the traditional cropping systems of the Palouse Region. Lester Wolf Farms will diligently track all input costs including seed, fertilizer, fuel, and pesticides for each crop year and control and treatment strip in the block design outlined in Figure 1. Crop yields for each strip will be collected with a yield monitor on the combine and recorded. Relative profitability for both control and treatment will be calculated by subtracting input costs from crop yields multiplied by relevant wheat price data. A paired t-test will be used to compare control and treatments using R statistical software.
Objective 3: Develop and disseminate management recommendations
The lack of regionally specific information on integrating cover crops into typical crop rotation has been noted by many producers in the Palouse Region as a barrier to adoption. This project will address this need by hosting field days, facilitating stakeholder focus groups, attending conferences, disseminating fact sheets, writing a scientific publication and producing a video about the project. More specifics about the educational outreach activities and materials can be found in the next section and are outlined in the attached timeline.
Materials and methods in year one of the project (2020):
In the first year of this project eight one acre strips of cover crop mixes were seeded and compared to two one acre control strips in spring wheat, winter wheat and pea crop rotations. Four strips were interseed with spring wheat examining warm season mixes (SW_interseed, SW_interseed_mix_1, SW_interseed_mix_2) and one strip of a cool season mix was broad cast over growing spring wheat (Over_Winter_3). In winter wheat, two strips were broadcast over the wheat in June focusing on a cool season mix with different seeding dates (Over_Winter_Winter_1, Over_Winter_Winter_2) and one strip of a warm season mix was interseeded in May (Nestor_Mix). The final strip trial contained a warm season mix interseeded with peas in April (Pea_interseed). Table one below outlines the cover crop mixes, seeding method, seeding dates, seeding rates, termination method and dates, and cost of seed in both the winter wheat and spring wheat trials. The strips were seeded between April 8 and June 18, 2021.
Table 1. Cover Crop Information Table
Within five of the above mentioned strip trials and winter wheat and spring wheat controls soil samples were collected following seeding in late June. A minimum of five sampling locations were randomly selected in each strip and five samples were collected in a circular pattern at each location. Samples were collected with a JMC backsaver soil probe to a depth of 30 centimeters, and all of the samples were well mixed into a composite sample representing each strip. The samples were stored in a cooler and composite samples were shipped to Woods End Laboratories, INC and Soil Test Farm Consultants Inc. for analysis. Our initial plan was to sample each of the strips but this became logistically challenges due to Covid-19. All of the strip trials will be sampled in early April, 2021. Photos of the strip trials can be seen in Figure 2 below.
Figure 2. Photos of the cover crop strip trials
Cover crop establishment and success was planned to be measured with the point intercept method to estimate percent cover of cover crop species, cash crop, and weeds. Our original plan was to do this once in the spring prior to termination and once in the fall prior to the first snow fall. Logistical complications due to the Covid-19 pandemic stopped this from occurring in spring but visual assessments did occur following harvest for the cool season cover crop strips.
Following harvest, crop yield data and input costs were compiled in an excel spreadsheet and differences in net income were calculated between the control and the cover crop strips. Gross income for each strip trial was calculated by multiplying the crop yield by 2020 crop selling prices. The selling prices were as follows: Winter wheat = $5.15/bushel, Spring Wheat = $ 5.97/bushel, and peas = $0.12/Lb. Net income was calculated as Gross income mins total input costs. Finally, The difference in net income from the control strips were calculated as net income minus the input costs for cover cropping.
Materials and methods in year two of the project (2021):
The lessons learned from the first year of the project guided the selection of three spring seeded cover crop mixes that were compared to three control plots. The one-acre strips were expanded to cover additional acreage to accommodate equipment and assess diverse landscape positions. The cover crop mixes selected included interseeded golden flax with garbanzo beans (Garb_Flax interseed); interseeded spring forage pea, brown mustard, and purple top turnip with spring wheat (SW_interseed); and a cover crop hay mix that included peas, oats, barley, purple top turnip, triticale, millet, YBS clover (CC_hay). The cover crop plots were assessed against business-as-usual crop rotations of garbanzo beans, and spring wheat. The plots were seeded between April 15th and May 1st, 2021. Seed mixes seeding rates and costs can be seen in Table 4 below.
Table 3. 2021 cover crop information
Soil sample were collected in all of the plots mentioned above and in the and spring wheat and garbanzo controls. Similar to the first year of the project soil samples were collected following seeding. Five sampling locations were randomly selected in each plot and ten samples were collected in a circular pattern at each location. Samples were collected with a JMC backsaver soil probe to a depth of 30 centimeters, and all of the samples were well mixed into a composite sample representing each plot. The samples were stored in a cooler and composite samples were shipped to Soil Test Farm Consultants Inc. in Moses Lake, WA for analysis. The plots were sampled between April 15th and May 15th 2021. Photos of the strip trials can be seen in Figure 3 below.
Figure 3. Photos of 2021 cover crop mixes
Following harvest, crop yield data and input costs were compiled in an excel spreadsheet and differences in net income were calculated between the control and the cover crop strips. Gross income for each strip trial was calculated by multiplying the crop yield by 2021 crop selling prices. The selling prices were as follows: Garbanzo beans = $0.22/lb, spring wheat = $7.00/bushel, hay = $0.40/lb. Net income was calculated as gross income minus total input costs. Finally, The difference in net income from the control strips was calculated as net income minus the input costs for cover cropping.
Materials and methods in year three of the project (2022):
There were several lessons learned from the first and second years of the project that shaped the selection of cover crop mixes and seeding decisions. Similar to year two, the one-acre plots were expanded to cover additional acreage. Three trials were conducted that included spring-seeded, fall-seeded, and a volunteer cover crop allowed to grow with commodity grains. The spring seeded mix included crimson clover, yellow blossom sweet clover, forage peas, soybeans, berseem clover, grain sorghum, purple top turnip, white mustard, smart radish, brown mustard, and pumpkins (Diverse Cover Crop). The fall seeded mix included Austrian winter pea, crimson clover, alsike clover, yellow blossom sweet clover, arrowleaf clover, winter barley, winter triticale, white mustard, rapeseed, and purple top turnip (Fall CC mix). The final trial was built off of an experiment in year two of this project. In spring 2021 Golden flax was interseeded with garbanzo beans. The hope was that the flax seed would spread across the field with chaff from the combine and volunteer in the proceeding winter wheat crop adding soil health benefits (Volunteer Golden Flax). Seeding dates for the trials are as follows: The spring Diverse Cover Crop was seeded on May 10th, 2022; the Fall CC mix was seeded on October 15th, 2022; and the Volunteer Golden Flax was seeded on October 10th, 2021. Seed mixes, seeding rates, and cover crop costs can be seen in Table 4 below.
Table 4. 2022 cover crop information table
Soil samples were collected in all of the fields mentioned above as well as in a business-as-usual winter wheat field. Similar to the first and second years of the project soil samples were collected following seeding. Five sampling locations were randomly selected in each plot and ten samples were collected in a circular pattern at each location, all of the samples were well mixed into a composite sample representing each field. The plots were sampled between May 16th and June 3rd, 2022. Photos of the strip trials can be seen in Figure 4 below.
Figure 4. 2022 cover crop photos
Following harvest, crop yield data and input costs were compiled in an excel spreadsheet and differences in net income were calculated between the control and the cover crop fields. As in years past gross income for each field was calculated by multiplying the crop yield by 2022 crop selling prices. The selling price for winter wheat was estimated at $9.20/bushel. Net income was calculated as gross income minus total input costs. Finally, The difference in net income from the control field was calculated as net income minus the input costs for cover cropping.
Soils Data:
Results from the 2020 soil sampling in the cover crop strip trials and the control strips indicate both positive and negative differences in the parameters measured (Table 5). In the warm season mixes interseed with spring wheat increased levels of Solvita CO2 burst, total carbon, water soluble organic carbon, and estimated nitrogen mineralization were observed when compared to the controls. Decreased levels of water soluble nitrate-N and Permanganate Oxidizeable Carbon were seen when compared to the controls. The strip seeded with the SW_interseed mix that was made up of collards and purple top turnips was the only strip that had positive differences from the spring wheat control strip for all parameters measured. The sampling in the cool season mix strip trials (Over_Winter_1, Over_Winter_2, and Over_Winter_3) in both the spring wheat and winter wheat strips had mixed results when compared to the control strips. This was somewhat expected as fields are variable and at this point, the goal of sampling these strips was to develop baseline data that can be used to evaluate changes over the next two years.
Soil sampling continued in 2021 assessing the cover crop plots with the control plots. Similar to the first year of data collection both positive and negative differences were observed. Across all of the cover crop plots increased levels of organic matter, water-soluble organic carbon, and estimated nitrogen mineralization were measured. The increase in soil organic matter contributed to an increase or no change in total organic carbon in the cover crop plots compared to the controls (Table 6). Increases in active fungi/active bacteria were measured in Garb_Flax interseed and SW_interseed when compared to the control plots and a decrease was seen in the CC_Hay mix. Additionally, decreases in Solvita CO2 burst were observed in the Garb_Flax interseed and the CC_hay mix when compared to the control plots along with decreases in nitrate concentrations (mg/Kg) in the SW_interseed and CC_hay plots when compared to the control plots (Table 6).
In the third year of the project, soil data were collected in the three cover crop fields and compared to the winter wheat control. Consistent with the first and second years of data collection both negative and positive results were observed. In both the volunteer golden flax and the spring-seeded diverse cover crop mix increased levels of the Solvita CO2 burst, pH, and estimated nitrogen mineralization was observed. Elevated levels of active fungi/active bacteria, organic matter, total carbon, and water-soluble organic carbon were observed in the control when compared to the cover crop fields. All of the soil data collected can be seen in Table 7 below.
After soil sampling cover crop fields for the last three years, there are several lessons learned that should be noted and could be adopted moving forward. First, sampling typically occurred in the early spring, April to May, and at that point, the cover crops were not fully established. Future sampling should be conducted in the treatments and controls during the height of the growing season, late June to early July. It would also be interesting to sample fields the year after cover crops have been seeded and terminated, and compare these results to control fields that have never had cover crops. Finally, it should be mentioned that POXC was not measured in the cover crop fields during this sampling season. There was a mix-up with the lab and these samples were never processed. In the prior two years, POXC has been higher in almost all of the cover crop trials.
Economic data :
Economic data on input costs and crop yields for the 2020 cover crop strip trials can be seen in table 8 below. At this point in the project, this analysis would indicate that all the strips are returning losses between $8.00 and $25.00 when compared to the control strips. While this could be a deal breaker for many producers, the costs and benefits following cover crops have not yet been fully identified. Over the next two years we intend to quantify the risks and returns associated with soil chemical and biological differences associated with the cover crop strip trials.
Economic data on gross and net profits for the 2021 cover crop plot trials compared to a business-as-usual crop rotation can be seen in table 9 below. For the 2021 crop year, all three trials were returning losses that ranged from $32 - $100/acre when compared to the control strips. The losses in net revenue substantially increased in the second year of this study. While this data is not promising for the adoption of cover crops in this region, the losses could be attributed to the 2021 drought. The cover crop trials for this project are located just south of Uniontown, WA in the dryland agricultural region of the Inland Pacific Northwest. Growers in the region rely on winter through early summer precipitation to provide enough moisture for their crops through the growing season. In the spring of 2021, precipitation was 30% below normal impacting both the cover crop plots associated with this project and commodity crop yields across the pacific northwest.
Economic data on gross and net profits for 2022 cover crop fields compared to a business-as-usual, winter wheat, crop rotation can be seen in table 10 below. For the 2022 crop year, we were only able to calculate profits and losses for the volunteer golden flax and the fall cover crop mix. Winter wheat was seeded after the diverse, spring seeded, cover crop mix and will not be harvested until the fall of 2023.
Since the golden flax volunteered in the winter wheat crop there was no change in the cost when compared to the winter wheat control. The field with the fall-seeded cover crop mix returned a loss of $42/acre when compared to the control which is fairly consistent with what we have seen in previous years. It should be noted that we are only measuring gross and net profits for a single year in the crop rotation. While this information is useful it could be worth figuring out a way to calculate the return on investment (ROI) of integrating cover crops into these fields.
Lessons learned from a farming perspective (2020):
This year's trials gave us some important takeaways for next year's trialing of dos and don'ts. We learned the importance of cover crop plant types, seeding dates, seeding depth, seeding rates, and termination response.
Plant Types: We tried a diverse mix of cool and warm season plants within the mixes. We found with all seeding methods and different dates the warm season did not establish or thrive. For spring-seeded cover crops in our area, the warm seasons should be eliminated and subbed out for more aggressive cool season plants that will establish to obtain our goal of O.M. growth, weed controls, and nutrient cycling.
Seed Dates: The establishment of covers did best when applied at the time of seeding of the cash crops. The cover crops inter-seed with a no-till drill, established but caused too much damage to the cash crop along with too much competition from the crop to add any benefit. The broadcast seeding had very limited to no establishment and should not be repeated.
Seeding Depth: If all plantings are to happen at the same time of seeding with the cash crop it is important to pick cover crops that can establish at the same depths the commodity crop is being seeded. This needs to be paired with plants that can establish in the soil/environmental conditions of the cold wet spring in the Pacific North West.
Seeding Rates: While we had great establishment of the cover crop seeds in the inter-seeded plots our rates were just too low. Going forward we will increase the rates higher on the cool season plants along with the elimination of the warm season plants. We lacked competition and gained no weed suppression.
Termination: Plots were terminated at our traditional time of spraying herbicide for weed control. This date should be pushed out to gain effects from the inter-seeded legumes. If a denser establishment of cover crops exists and weed pressure is lowered the hope is to gain an additional 14-21 days of additional growth from the cover crops before termination.
Lessons learned from a farming perspective (2021):
Don't have a drought again:). Needless to say, this past year had its challenges with the extreme drought/high heat index. While the finishing results were less measurable than we were hoping to see, we were still able to take some valuable information going forward with cover crops in the future.:
- Garbanzos/Inter-seeded Flax: Establishment of both plants was easy and neither one struggled with emergence or establishment. The flax did do exactly what we were wanting to see with the effect of a "trigger" crop to promote quicker germination and emergence of the garbs in comparison to the check. Weed control was harder to gauge this year due to the fact that the drought set in early, and no rain came after planting. Weed load was present but not any worse or better than the control that had chemistry applied but not activated due to lack of rain. We also learned the seeding rate of flax 13lbs/ac was too high and should be reduced by half 6lbs/ac. The flax was too competitive and out-competed the garbs in areas. This caused a yield reduction considerably by 50% compared to the control. The other hypothesis was the flax would separate out in the combine at harvest due to the very different seed sizes. We found this was not the case and took a 40% dock on the garb grade due to flax contamination. If pursued in the future we need to find a processor willing to separate both crops so you could have the option to capture and market both for an economic return. Currently, no processor is interested in the immediate area at this time to pursue this. Lastly, we did see some volunteer flax regrowth when the winter wheat crop was planted after the garbs/flax were harvested. It has winter killed but as spring conditions improve the hope is more flax will re-volunteer to add the plant/soil diversity during the early stages of the wheat development. We will continue to monitor this!
- Spring Wheat/Legume Brassica inter-seed. Again, very easy to seed and establish at the same time. The field strip looked incredible early on with a great diversity of plants. Weed control was not as effective as we hoped and an increase in the mustard seed rate might help with this component. However, we did still terminate the "broadleaves" in the mix later than the control to try to capture soil health/nitrogen gains from the peas. Termination proved to be very easy. No yield loss was realized in comparison to the control which is encouraging. Unfortunately, the yields of both were highly affected by the drought conditions. Not sure what the conclusion would be on a more "normal" growing condition year. I believe this has some positive impact potential to soil health and biology and will replicate the study.
- Hay-cover crop mix. This was an attempt to replace a cash crop of garbanzos with an alternative cropping system to gain soil health attributes and reduce exposure to synthetic chemistries. The takeaway was that the mix was very easy to grow and establish. The cattleman that did the first cutting of hay for me was concerned about the brown mustard I originally had in the mix for weed control. He thought it would make the hay non-palatable for the cattle, so I eliminated it from the mix. I believe we lost the effectiveness of the weed control component however felt comfortable taking it out since we agreed upon the cutting before the weeds could establish and seed set. The yield was also less than expected and the thought of an increased fertilizer rate might have aided in yield response to show a better return more in line with the economics of the control field of garbs. All in all, this field showed some very positive outcomes. First, a living annual plant would grow through the drought condition all the way through to planting of the following winter wheat crop in October. Second, while weeds did grow, they were terminated by being hayed off before making a viable seed reducing the chemical exposure. The big takeaway was that this is a very viable cover to integrate into a rotation in lieu of the traditional cash crop. While it might not give the same level of economic return as business as usual. It did show us that all the expenses would be covered at a break-even level while promoting a rotational breakup and increased soil health aspect. We will replicate again with the noted change to gain the findings.
Lessons learned from a farming perspective (2022):
Utilizing cover crops in our growing conditions and cropping system has proven to have its unique challenges, but some very interesting trends have become apparent and should not be overlooked.
- While the cover crops are not having the same success of weed control or mitigation as other places have experienced, we are seeing that the weeds tend to misdetermine in-crop growing conditions. This means the weeds are triggered to grow in the cover crop planting, which gives us a better opportunity to terminate them with a non-select herbicide with 100% control before planting the cash crop. In time, this will help burn up the soil weed seed bank, resulting in less in-crop herbicide use/exposure overall. The cost matrix will need to be studied over time to determine if this trend holds.
- While the cost matrix we have laid out shows the addition of cover crops has a negative financial impact in comparison to “business as usual,” additional information needs to be studied to determine the true positive impact of ROI. There is a tendency to focus directly on hard enterprise cost/return numbers. However, it is also critical to take the indirect numbers into account. The most important of these indirect numbers would be the exposure of chemistries to our soils. The benefit of having a small living root in the soil longer to feed the soil biodome will result in a positive soil impact. In addition, the reduced exposure to toxins results in a direct benefit to soil/human health.
In conclusion, the findings that cover crops in our growing system are not measuring a positive economic return doesn’t reflect the full story. Choosing to implement cover crops is a decision made deliberately by farms and farmers who are seeking the best overall social and economic outcome. I believe there is a fundamental movement to change our food systems to a more “regenerative/health” conscious end product. Cover crops are one of the connective cogs in this change. The best way I can express it would be this: cover crops in tandem with a robust cash crop rotation can promote soil life from the beginning to the end of the system
Research outcomes
Based on the work completed for this project, we have several recommendations for future research projects. The first of these recommendations is to focus on the return on investment (ROI) for the farmers implementing these trials. This ROI could be framed in long-term soil health benefits or shorter term financial gains and losses. We attempted to do that in this study, but the benefits were difficult to quantify because we ended up moving to different parts of the farm each year. A better design would be to follow crop rotations that integrate cover crops for 3 to 5 years on multiple fields on the farm. Additionally, a more in-depth economic analysis could be completed by economists to look at the ecosystem services associated with cover cropping. Some areas of focus could include monetizing nitrogen gained, increases in microbial diversity and communities in general, beneficial insects, C:N ratios, and weed control. One significant qualitative finding in this study was that weeds seemed to be triggered to grow in the seeded cover crop. This gave us a better opportunity to terminate the weeds with a non-select herbicide and resulted in 100% control before planting the cash crop. Over time, this could help burn up the soil weed seed bank, resulting in less in-crop herbicide use and overall exposure. The costs and general economics of this situation could be studied over time to determine if this trend holds on multiple farms in our region.
Another recommendation is to focus on cool season cover crop mixes. One of the barriers to adopting cover crops in eastern Washington is the lack of summer precipitation. Warm season cover crops typically do not have enough moisture and growing degree days to establish as well as they do in other parts of the country. For spring-seeded cover crops in our area, we recommend eliminating the warm-season mixes and focusing on more aggressive cool-season plants. Future work could include plot trials done either on-farm or at a USDA Plant Materials Center for a variety of cool season cover crop mixes. The goals of this project could be to identify those mixes that will perform best in our climate zone to meet the goals of building organic matter, biomass production, weed control, and nutrient cycling.
Our final recommendation for the future is to focus on diversifying crop rotations and interseeding cover crops and cash crops. One of the trials completed in this study was to replace spring wheat with a hay cover crop mix. The hay cover crop mix had a living annual plant root in the ground all the way through to the planting of the following winter wheat crop, even in the 2021 drought year. There were also weed control benefits as the hay cover crop was cut twice before weeds were able to establish a viable seed, reducing the number of spray operations. The big takeaway was that this is a very viable cover to integrate into a rotation in place of the traditional cash crop. While it might not give the same level of economic return as a spring crop, it did show us that all the expenses would be covered at a break-even level while promoting a diversified crop rotation. This could be a great option for farmers in our region who are interested in the soil health benefits of cover crops, but don’t have the capacity or infrastructure to graze livestock.
Further work on spring grain and legume-brassica and garbanzo-flax interseeding should be conducted. Seeding these spring grain legume-brassica crops together was fairly easy as was weed control and termination, but there were no observed financial or soil health benefits due to the drought that occurred the summer they were growing. The garbanzo-flax interseeded trial resulted in a 50% loss in garbanzo yield due to an elevated flax seeding rate. Research efforts that focus specifically on soil health, weed control, and economic benefits and drawbacks could be useful for integrating diversity into existing crop rotations.
Education and Outreach
Participation summary:
Palouse CD will work with Lester Wolf Farms to coordinate a field tour in the third year of the project at the farm. With two years of data collected and analyzed, results will be shared with interested producers and agency personnel in the area. Field days are hosted annually by PCD and have regularly drawn crowds of over 100 producers and agency staff members. In addition to the field day, a stakeholder focus group will be formed, containing producers in the region that are specifically interested in integrating cover crops into their cropping system. This group of seven to 10 individuals will meet three times between November and March for the duration of the project. The group will discuss the status and progress of this project, as well as on farm trials that are being conducted outside of this scope of work. This producer to producer network will help to spread information generated from this study as well as provide a forum for peer to peer education.
The information generated from this project will also be shared in the second and third years at two conferences. The Pacific Northwest Direct Seed Association hosts an annual Cropping Systems Conference, in January in Kennewick, Washington. Producers throughout the Pacific Northwest come together to share lessons learned from on farm trials, learn from innovative producers outside of the region and hear about the latest advances in technology from industry leaders. The second conference, the Palouse Alternative Cropping Symposium is hosted annually in February by PCD in Pullman, Washington. This is a smaller event specifically focused on cover cropping, livestock integration and alternative crop rotations. This project will be featured at both of these events via PowerPoint presentations.
Education and outreach materials will also take on more traditional forms with fact sheets being created at the end of each crop year. The fact sheets will outline the cover crop mixes used, crop yields, relative profitability, and results from the physical and chemical soil tests. The fact sheets will be distributed at PCD events and will be publicly available on their website. Building off of the fact sheets, PCD will work with NRCS Resource Conservationists to compile all the data collected into a peer reviewed article that will be submitted at the end of the third year of the project.
The final component of the outreach and education efforts will include producing a video that documents the progress of the project, the successes and most importantly the lessons learned. Throughout the course of the project Lester Wolf Farms and PCD will record extensive components of the project and will compose the video in the third year. The footage will also include interviews with employees from Lester Wolf Farms, PCD, NRCS as well as other producers that are experimenting with cover crops. The video will be posted on the PCD’s website, social media pages and on Vimeo. Specific details on when each of these activities will be completed can be found in the project timeline.
Education and outreach activities in year one of the project:
Significant progress was made in completing the education and outreach objectives outlined for this project in the first year. There were some delays due to the Covid-19 pandemic, we were unable to form and meet with a stakeholder focus group in this first year. We don't expect this will have significant impacts on meeting any of the objectives moving forward. Preliminary information from the first year of the cover crop plot trials was shared at the "Soil Health Site Down" event hosted by the Palouse Conservation District on January 20, 2020, from 7 to 8 am. There were 41 individuals present, 15 farmers or ranchers, and 26 agricultural professionals. A recording of the presentation can be found here and a pdf of the presentation is pasted below.
Cover Cropping on the Palouse Presentation 2020
Additional education and outreach activities included collecting video footage during seeding and throughout the growing season. This will continue through each growing season. The footage will be used for an educational video that will be released in the fall or winter of 2022. Lester Wolf farms and Palouse Conservation District have also started talking about planning a small, invite-only, field tour that we hope will be able to take place this summer. Additionally, once data is compiled from the over-winter (fall-seeded) strip trials is compiled management summaries will be created and distributed.
Education and outreach activities in year two of the project:
Education and outreach activities were significantly impacted by the COVID-19 Pandemic in the second year of this project. We had planned to compile additional video footage as well as host a field tour at the cover crop plots. This become logistically difficult due to the circumstances. Lester Wolf farms and Palouse Conservation District have started planning a field tour that will occur at the end of June 2022. Palouse Conservation District staff has started to compile existing video footage and plans to collect more during the 2022 growing season.
Education and outreach activities in year three of the project:
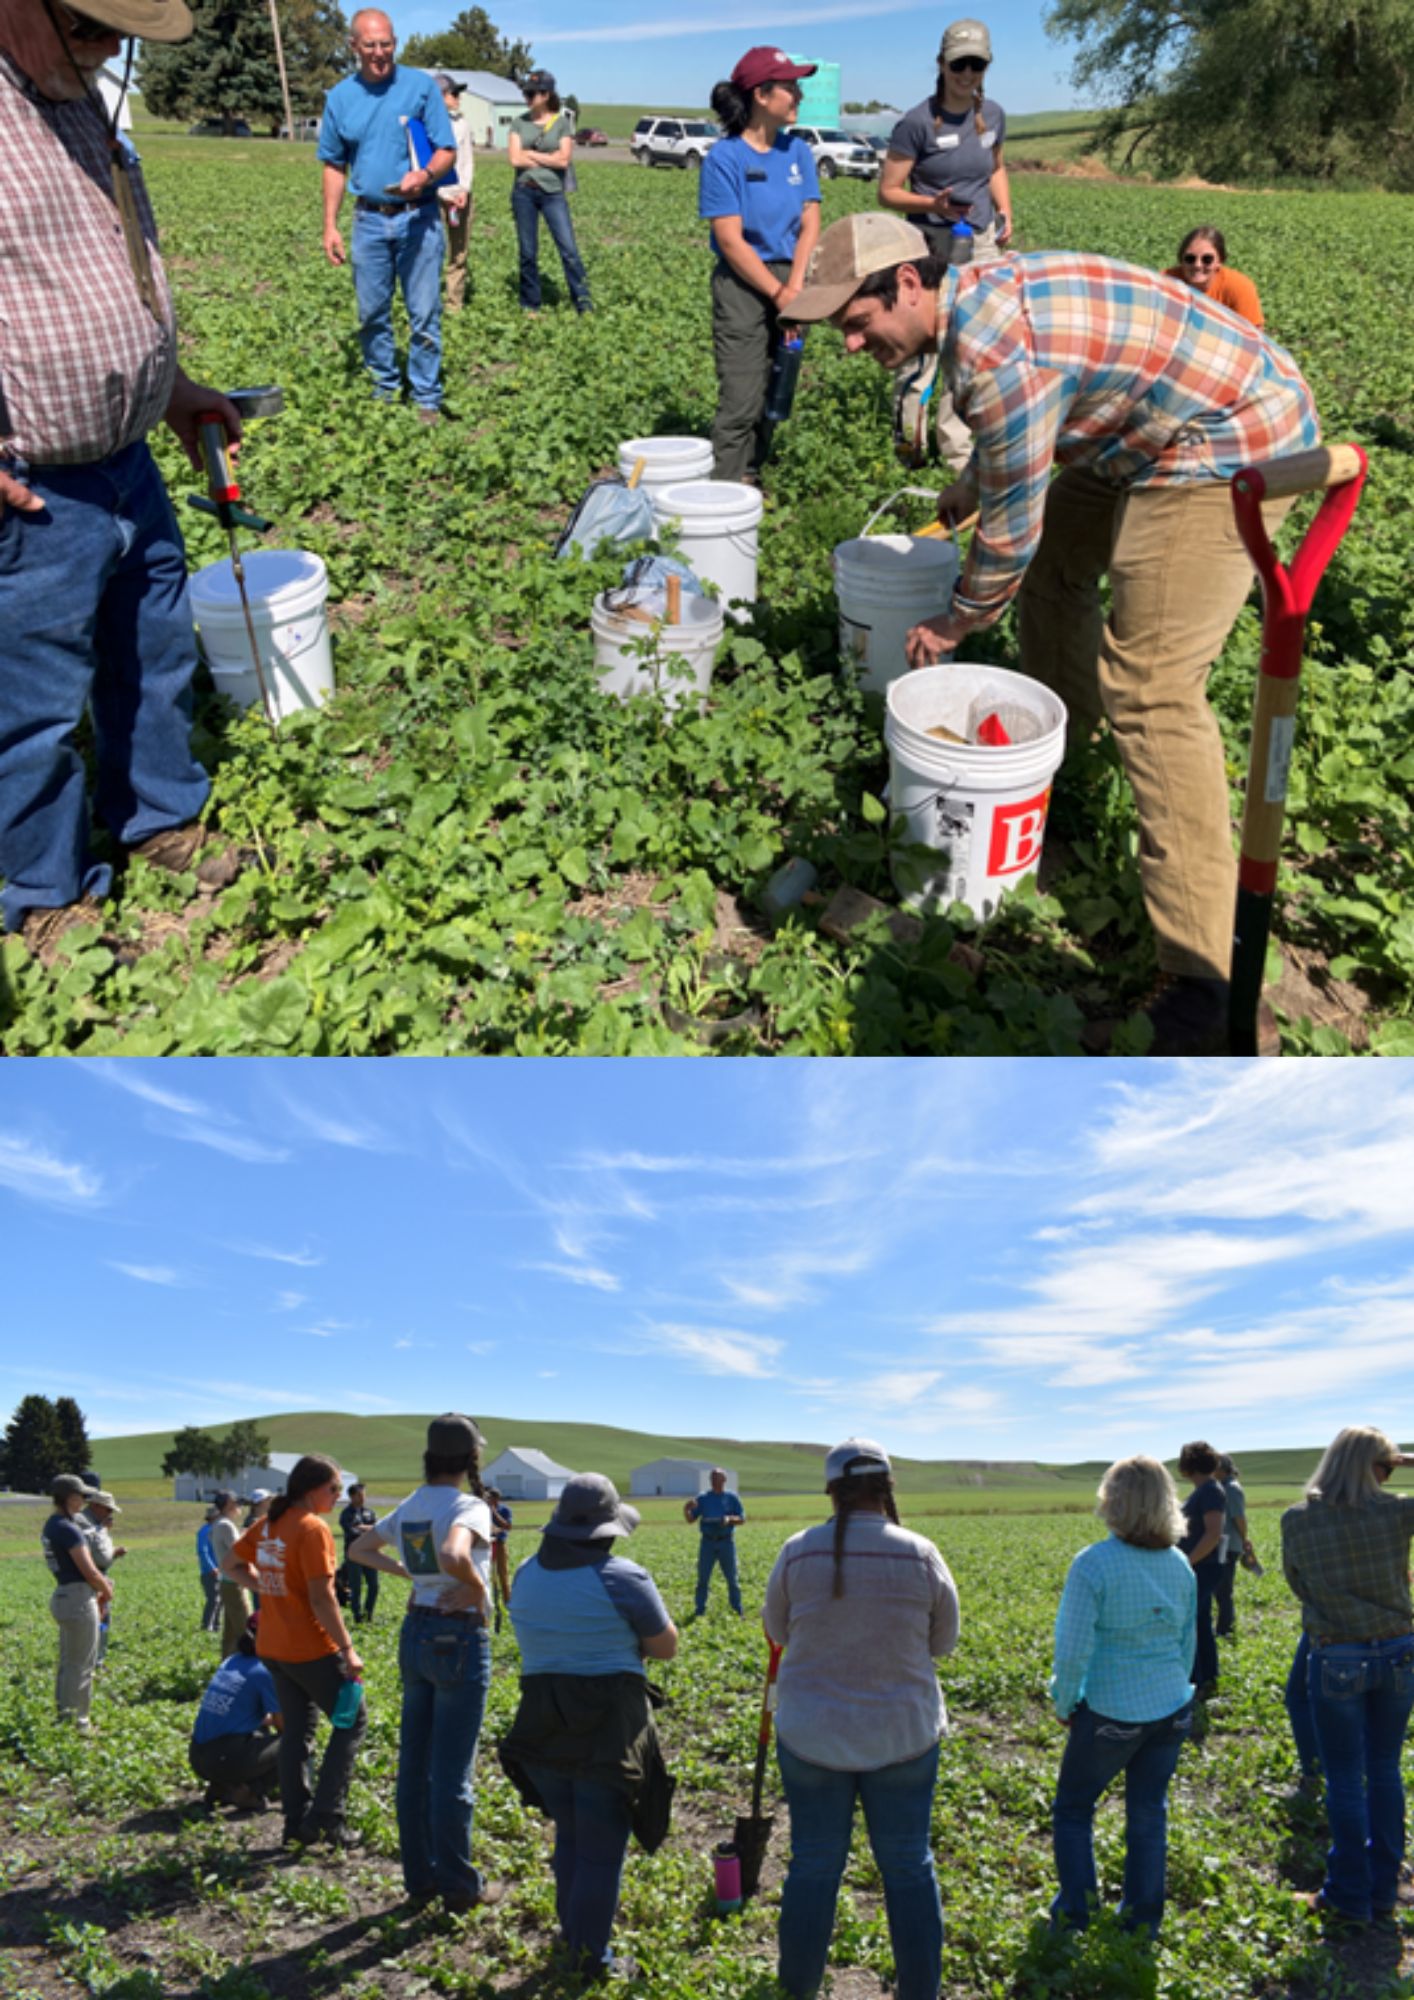
In the third year of the project, Lester Wolf Farms and Palouse CD were able to complete several of the education and outreach activities. On June 20th, 2022 Palouse CD hosted a cover crop field tour on Lester Wolf Farms to highlight the trials funded by WSARE. The agenda included an introduction by Palouse Conservation District Staff and Frank Wolf, a hands-on soil health demonstration in a no-till system by Stephen Johnson, a Whitman County NRCS employee, and Frank Wolf discussed his cover cropping trials as the group stood in one of the fields he seeded that spring. In total there were 28 attendees which included seven farmers and 21 agricultural professionals. Photos from the cover crop field day can be seen below.
In addition to the cover crop field tour, Palouse Conservation District staff worked with Lester Wolf farms to create a short educational video that is hosted on Palouse CD’s Youtube channel. A link to the video can be found here. In the video, Frank Wolf shares his experiences with cover cropping on the Palouse and offers candid insights into the benefits of the WSARE Farmer Rancher program.
Following the end of the 2022 cropping year Palouse Conservation District Staff developed three fact sheets for the three years of cover crop trials on Lester Wolf Farms. The fact sheets contain information on cover crop seed mixes, seeding rates, and cost. This information is valuable for farmers in our region that are interested in experimenting with cover cropping, providing insight into what is being used by their peers. Photos of the fact sheets can be seen below.


The education and outreach efforts for this project included peer-to-peer education events, field tours, an educational video, and traditional print media. For the last five years, the Palouse Conservation District has been hosting the Palouse Alternative Cropping Symposium. The goal of the event was to support farmers who are experimenting with alternative crop rotations and provide a forum to share ideas and learn from each other. The symposiums were moved online in 2020 due to the COVID-19 pandemic and resumed in person again in 2023. The work on Lester Wolf Farms associated with this project was highlighted at two of the events reaching an audience of 122 farmers, researchers, ag professionals, and interested community members. Providing structure and a venue for farmers to communicate successes and failures with cropping trials is an excellent way to communicate results and, in our opinion, more impactful than this information being delivered by researchers or ag professionals.
In addition to the Alternative Cropping Symposium, Lester Wolf Farms and the NRCS teamed up to host a field day in one of the trials associated with this project. The event was held in June 2022 and 28 individuals attended. The day was spent walking through the NRCS soil health test and then conducting the test in both a traditional spring wheat field and the cover crop trial. Attendees were engaged, asking many questions, and were surprised by the results of the infiltration tests. Infiltration rates were much quicker in the cover crop trials. This event was a great way to share information with and engage area farmers, ag professionals, and researchers. Next to the peer-to-peer education event, the field tour was an excellent way to educate individuals on the trials.
To summarize all of the work done on the project and highlight WSARE as a funding source, Palouse Conservation District and Lester Wolf Farms worked together to create a five-minute educational film. Titled “The Learning Curve,” the film highlights Frank Wolf and his brother Ben. Frank shares his experiences with cover cropping in the Palouse region, provides advice for folks interested in trying the practice, and offers insights into the benefits of the WSARE Farmer Rancher program. Since the film was posted in July 2023 it has received 115 views. It is hard to determine how impactful the film has been in educating farmers and the general public. In a relatively short time, it has received several views but with all of the other content available, we are competing with many different agencies, organizations, and individuals. This is an effective way to condense a lot of information
The final outreach component was to develop one-page fact sheets that explained each cover crop trial for each year of the project. These were developed at the end of the growing season in 2022 and are available at the Palouse Conservation District’s office and on their website. While there hasn’t been a high demand for these products, they are a good resource that can be distributed to farmers interested in what other farmers are seeding.
Education and Outreach Outcomes
We learned several lessons from this project that will help inform future education and outreach activities. First, we recommend hosting more field days. Getting people into a cover crop field and demonstrating the benefits, in our case soil infiltration rates, as well as discussing the challenges is a perfect way to convey information. Typically this information is delivered directly from the farmer in a setting that makes most people feel comfortable, making these events highly effective. Comparing our field day to the Alternative Cropping Symposiums, the attendees were much more engaged in the field day. Second, we would focus on enhancing peer-to-peer education through both the Alternative Cropping Symposiums and in forming regional-specific groups of farmers. A lot of research shows that farmers typically get most of their information from their neighbors or other farmers. If we can continue to provide venues for this to occur specifically about sustainable agriculture practices, we could have a large impact on future farming practices.
Identifying regionally specific cover crop mixes that will grow well
Seeding dates
Method of establishment, drill, or broadcast, depending on the seeding date perimeters.
Ease of termination and or persistence of certain cover crop species
Some cover crop species trigger weed germination allowing for a reduced population in cash crops.