Final report for GNC23-367
Project Information
The project title is "Direct Quantification of Manure Derived N Retention in Cover Crops After Fall Applications via 15N Enrichment". The three expected project outcomes are: 1. Direct quantification of manure derived N within cover crops will provide convincing evidence for widespread utilization of cover crops in conjunction with fall manure applications. 2. Producers will be able to adapt knowledge from this project to inform farm-specific management goals, like cover crop selection and termination strategies. 3. Increased producer confidence and improved attitudes towards cover crop implementation with fall manure applications will translate to a higher rate of practice adoption, which translates to increased economic and environmental sustainability for producers and the surrounding communities.
Fall manure applications are a standard practice across Wisconsin, primarily due to manure storage constraints and unpredictable spring field conditions. Unfortunately, manure derived N is at risk for runoff and leaching into groundwater without an appropriate mechanism for N retention leading up to spring planting. Planting winter cover crops with fall manure applications can be well utilized in integrated agricultural systems, especially after silage harvest, for benefits such as N retention. cover crop variety selection is a critical management decision in this regard, specifically when it comes to termination. While winter-killed varieties maximize N uptake and complete plant growth by late fall, overwintering varieties continue growing into the spring, utilizing available N. Consequently, overwintering varieties require spring termination, meaning cost and labor. With those differences in mind, they may vary greatly in their manure N retention capacity. In cover crop research, non-isotopic methods to quantify N uptake in cover crops rely on assumptions of N source (manure or soil derived), but an accurate estimation of N source cannot always be made. Direct quantification and tracing of manure derived N via isotopic labeling provides an opportunity to differentiate N source in cover crop’s and accurately describe N availability within the soil.
We found that integration of overwintering cover crops like wheat and rye offer the greatest potential to prevent environmental N losses, although their performance is subject to interannual variability and other operational constraints like planting and termination timing. Fall cover crop growth was strongly influenced by planting time and study year, which had cascading effects into the springtime, but generally, the earlier planting date in year 2 supported greater late-late fall growth. Winter rye and wheat served as effective N scavengers retaining a notable amount of manure N prior to Spring termination. While limited fall establishment periods remain a concern for cover crop adopters in the North Central region, our work showed that manure N uptake can still be maximized into the spring prior to termination, serving to reduce potential N losses along with other provided ecosystem services like ground cover and erosion control.
There are two main learning outcomes. First, through direct quantification of manure derived N in cover crops, producers will be presented convincing evidence to implement cover crops with fall manure applications. Producers will learn exactly how much manure N they can expect cover crops to retain without relying on assumptions typically made in cover crop N uptake research. Cover crop implementation is a labor and monetary investment, met with skepticism by those looking out for the well-being of their operation potentially, so direct and transparent research is critical. Secondly, producers will learn to adapt the project results to inform individual or farm level management goals. For example, cover crop variety selection based on winter survival and termination requirements is a decision that weighs on many farmers. Comparing manure N uptake between winter-killed and overwintering cover crop varieties will provide useful information that can assist in decision making. The main action outcome is increased producer confidence regarding implementation of cover crops with fall manure application, thereby decreasing N leaching at a regional level and promoting cleaner waterways. A change in producer perception and practice will result from the communication of this research.
Research
Site Description and Experimental Design
The study was conducted for two years from Fall 2023- Spring 2025 at the University of Wisconsin Arlington Agricultural Research Station in Arlington, WI (43°18’ N, 89°20’ W). Two separate adjacent fields were used for both study years, classified as Plano silt loams (fine-silty, mixed, superactive, mesic Typic Argiudoll) (Soil Survey Staff, 2018) and were previously managed under continuous corn silage. Daily rainfall and temperature presented for Arlington are presented in figure 1. for both study years. Twenty- 4m x 3m field plots with plot row spacing of 2m were established in a strip trial design with four experimental blocks and one treatment level of cover crop varieties. Treatments were not randomized within blocks to accommodate drill-seeding of cover crops. Within each plot, 1m x 1m microplots were established and received 15N labeled manure whereas the remaining portion of the main plots outside of each microplot received unlabeled manure. Four cover crop varieties were included in the field trial. These included two overwintering varieties (winter wheat and winter rye) and two winter-killed varieties (barley and oats). An additional row served as a no cover crop control and only received manure without the 15N label. Cover crops were seeded at 5.6g m2 (~56 kg ha-1), and manure was applied at a rate of 25g total N m2 (246 kg total N ha-1 or ~67 kg available N ha-1). Cover crops were seeded within one week of manure application (Table 1).
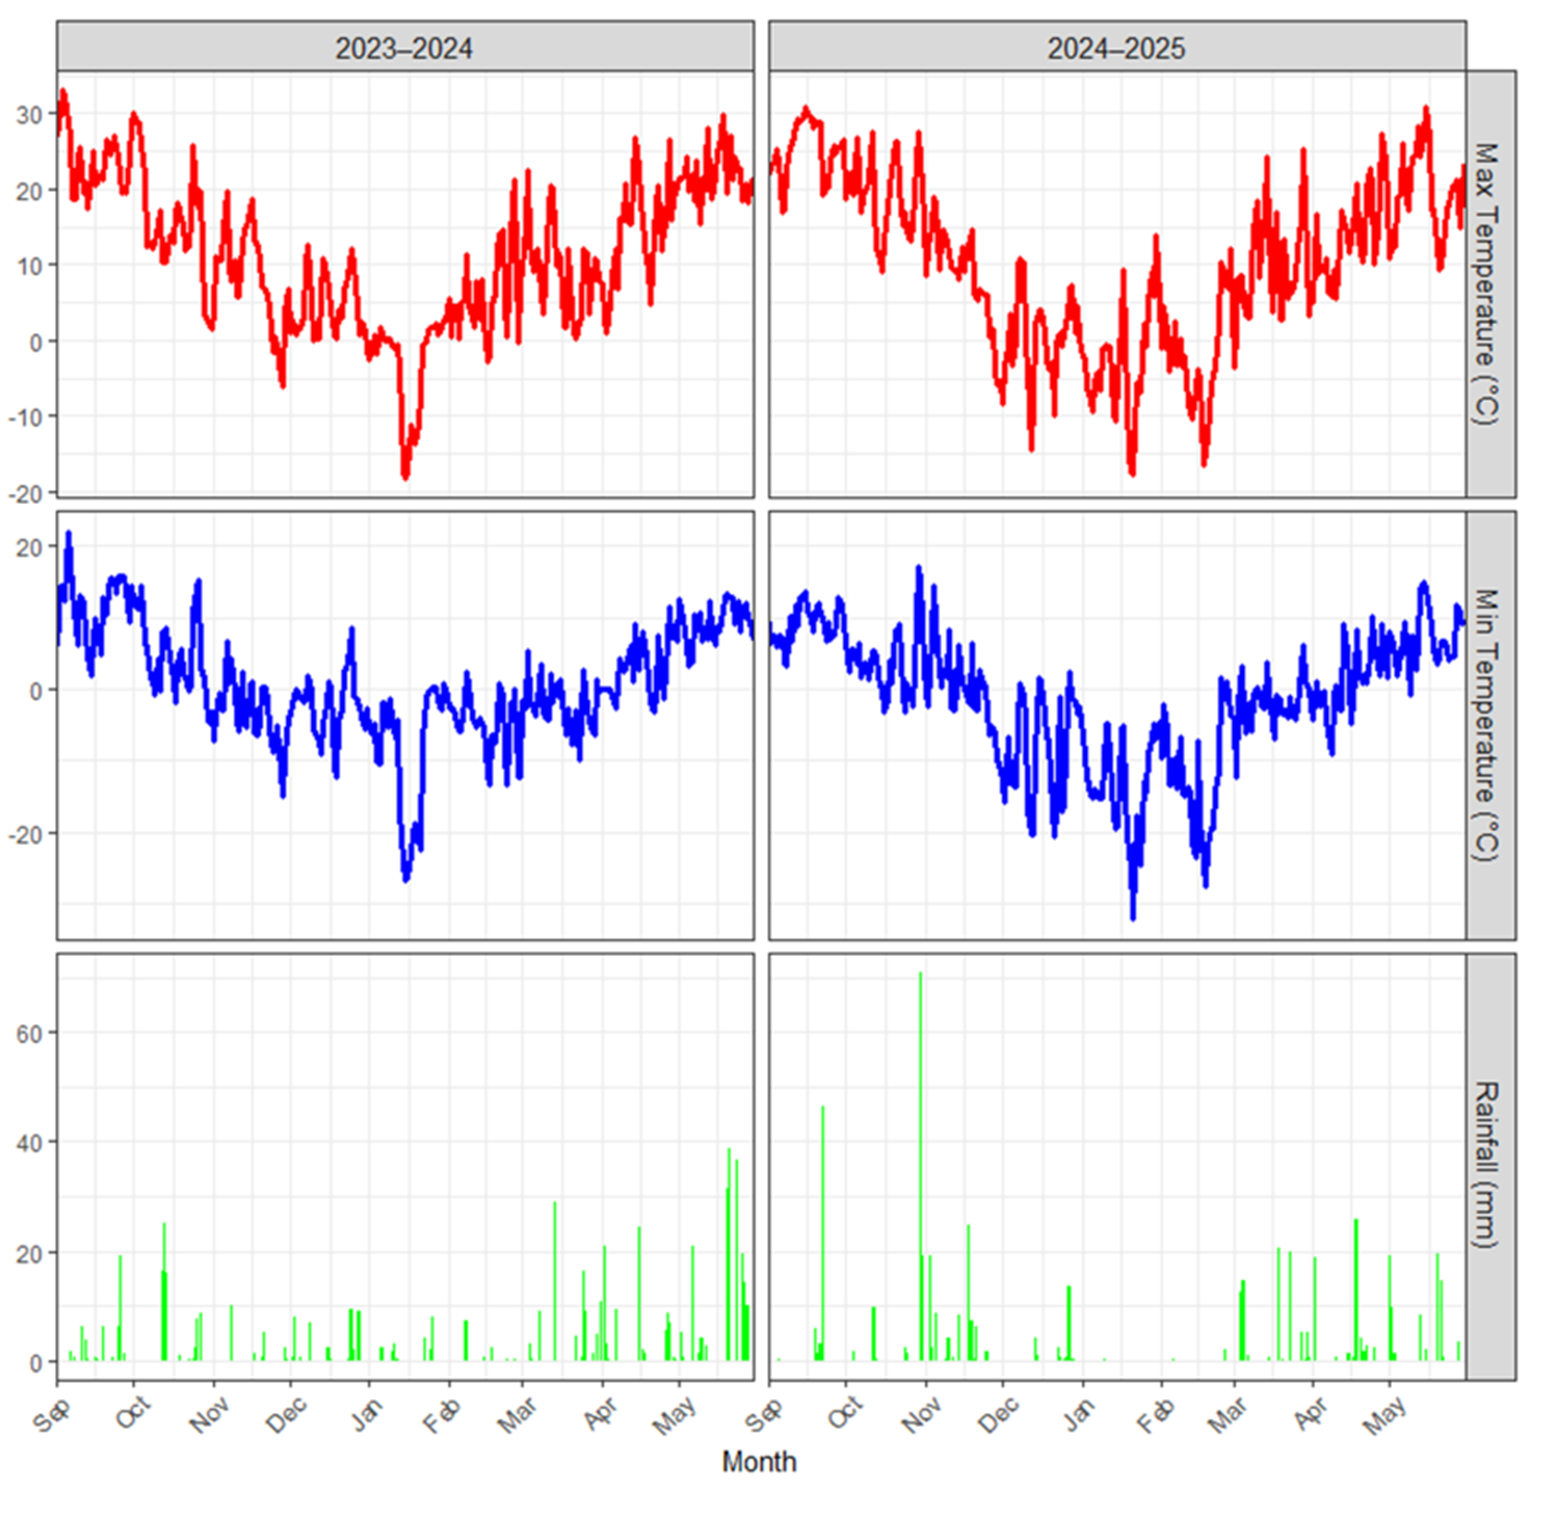
Fig. 1. Daily maximum and minimum temperatures (°C) and rainfall (mm) at Arlington Agricultural Research Station (Arlington, WI) from September to May across two study years: 2023–2024 (left) and 2024–2025 (right).
Table 1. Dates of manure application, cover crop planting, and plant/soil sampling in study year 1 and 2. Three sampling times are represented; early Fall-baseline (T0), late-Fall (T1), and late Spring (T2).
|
Activity |
Year 1 (Fall 2023- Spring 2024) |
Year 2 (Fall 2024- Spring 2025) |
||||
|
Manure Application |
10.6.2023 |
9.20.2024 |
||||
|
Cover Crop planting |
10.10.2023 |
9.25.2024 |
||||
|
Sampling Time |
T0- Baseline |
T1 |
T2 |
T0- Baseline |
T1 |
T2 |
|
Plant |
NA |
12.6.2023 |
5.10.2024 |
NA |
12.9.2024 |
5.15.2025 |
|
Soil |
10.2.2023 |
12.6.2023 |
5.10.2024 |
9.19.2024 |
12.9.2024 |
5.15.2025 |
Production of 15N Labeled Manure
Two cannulated dairy cattle in mid-lactation from the UW-Madison Dairy Cattle Center were utilized to produce manure for this study. One cow was tasked with producing 15N labeled manure and the second cow was tasked with producing unlabeled manure (all manure was a slurry of feces and urine). The protocol described was approved by UW-Madison Institutional Animal Care and Use Committee (IACUC). During the 12-day period, cows were kept without bedding as the high C:N ratio bedding mixed with manure would decrease the in-field N-availability of the manure, potentially limiting the ability to trace 15N into the cover crops. Additionally, it would not have been possible to control how much bedding was mixed with manure between collection periods.
Cow feeding regimes were normal herd diets, with urea N supplemented by direct addition into the rumen of the cannulated cows at 4am each daily. All urea was dissolved in 100mL of distilled water to be evenly applied and mixed over rumen contents. Unlabeled reagent grade urea was fed to both cows on days 1-8 to produce unlabeled manure. To allow for animal adaptation to a nonprotein nitrogen source, unlabeled urea was supplemented through the cannula in increasing increments of 10g per day, up to 50g of urea per day by day 5 (table 2). On days 9-11, reagent grade 15N urea at 98at% enrichment was mixed with unlabeled urea to achieve 15N urea @ 10at%, which amounted to 5g of reagent grade 15N urea in the total 50g fed daily. 15N urea was only fed to one cow due to the lower amount of manure needed for microplots and expense of 15N urea. On day 12, the last fecal sample was collected and both cows returned to normal herd diets.
Manure collection took place twice a day at 4am and 4pm in a pan below the gutter grates that allowed cows to defecate and urinate normally during the study period. Unlabeled manure collection continued through day 8 from both cows. Digested 15N urea takes between 32-96 hours to evenly label between urine and feces (Powell et al., 2004), so labeled manure was collected on days 9-12 and sub-sampled after each collection for 15N analysis to determine the amount of labeled N (table 1). After sub-sampling, the manure was oven-dried at 45°C or frozen at -20°C to conduct isotopic and routine manure analysis, respectively. The remainder of the manure to be field applied was stored in 5-gallon buckets at 4°C for < 2 weeks to minimize chemical decomposition of manure beyond a single day to accommodate the logistics of field application. Immediately prior to field application, both unlabeled and labeled manure was subsampled again for isotopic and routine manure analysis. Manure was enriched to a maximum of 0.57at% or 54% greater than natural abundance 15N (0.37%) for field application (Fig. 2). On average, applied manure N composition had 13.4% dry matter, 2.9% TN, and a C:N of 15.
Table 2. Daily urea feeding and manure collection schedule for production of unlabeled and 15N labeled manure. Cows received increasing amounts of unlabeled urea from Days 1–5, followed by a consistent dose of 50g from Days 6–8. A single cow received 50 g of ¹⁵N-labeled urea (10 atom%) on Days 9–11. Feces and urine were collected as combined manure samples during specified collection periods.
|
Day |
Feed amount/type |
Fecal Collection (Feces + Urine) |
|
1 |
10g unlabeled urea |
None |
|
2 |
20g unlabeled urea |
Unlabeled manure collection |
|
3 |
30g unlabeled urea |
Unlabeled manure collection |
|
4 |
40g unlabeled urea |
Unlabeled manure collection |
|
5 |
50g unlabeled urea |
Unlabeled manure collection |
|
6 |
50g unlabeled urea |
Unlabeled manure collection |
|
7 |
50g unlabeled urea |
Unlabeled manure collection |
|
8 |
50g unlabeled urea |
Unlabeled manure collection |
|
9 |
50g labeled urea (10at% 15N) (1 cow) |
None |
|
10 |
50g labeled urea (10at% 15N) (1 cow) |
15N labeled manure collection |
|
11 |
50g labeled urea (10at% 15N) (1 cow) |
15N labeled manure collection |
|
12 |
Normal TMR |
15N labeled manure collection |
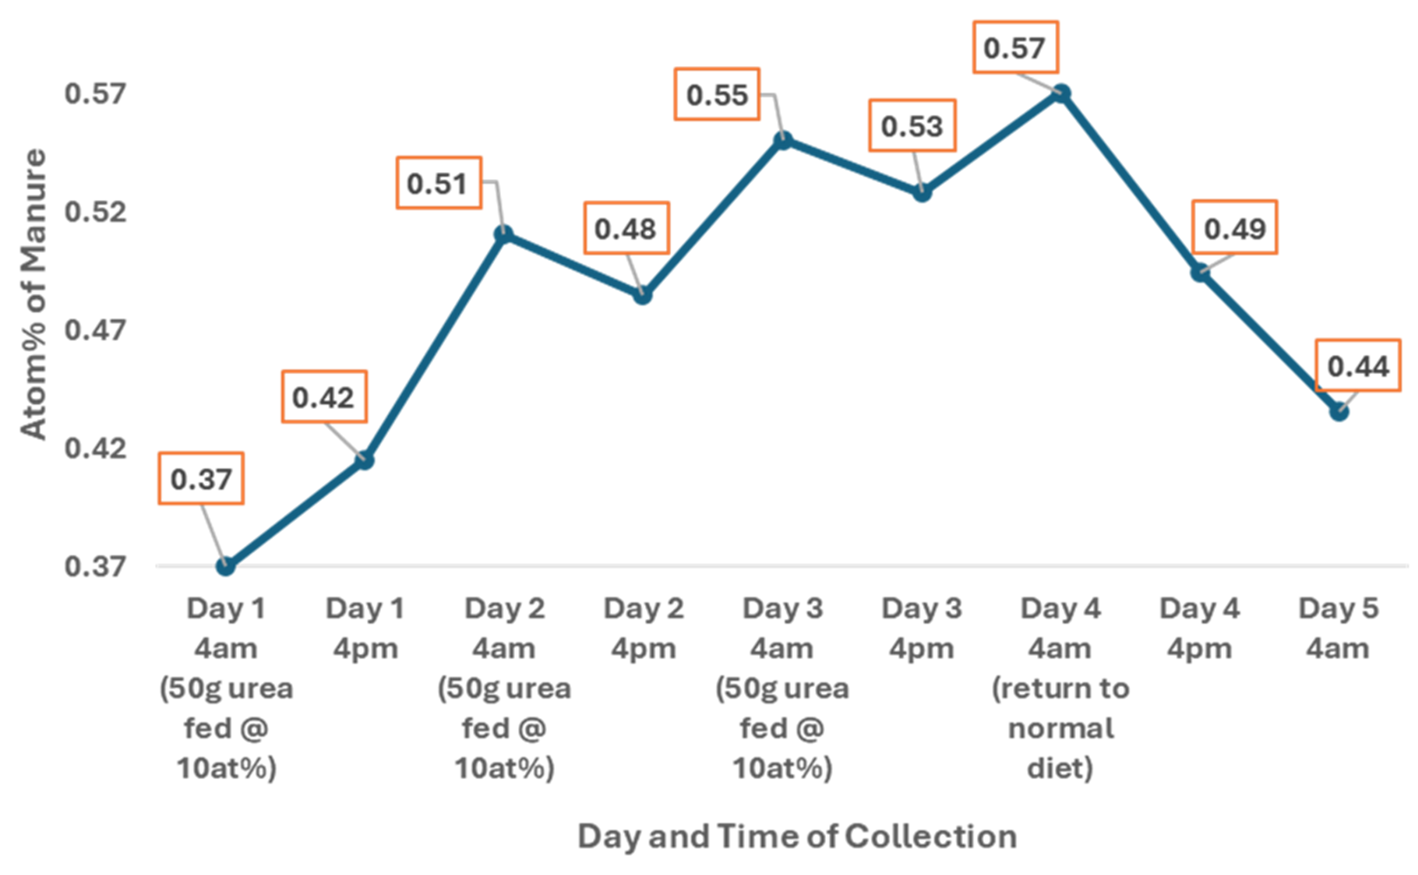
Fig. 2. Change in ¹⁵N enrichment (atom%) of manure across three days of urea feeding. Labeled urea was administered at 4am of Days 1, 2, and 3 and manure samples were collected twice daily at 4am and 4pm. Day 1 at 4am represents manure at natural abundance (control) 15N (0.37%).
Soil and Plant Sampling
Soil sampling occurred three times during each study year. Baseline soil samples were taken prior to manure application and cover crop planting in early fall (time point 0) following silage harvest, and then samples were taken in coordination with cover crop sampling post-winterkill in late fall (time point 1), and prior to spring termination (time point 2; Table 1). Within each main plot, five soil cores were taken using a hand probe and divided between 0-20cm and 20-40cm, then homogenized by soil depth, yielding two homogenized soil samples per plot (control 15N), except in study year 1, where soil depth sampling was restricted to 0-20cm due to excessive rocks. We selected 0-20 and 20-40cm as it best captures the span of the cover crop rooting zone, therefore manure N that remains in the topsoil is more likely to be available to the following cash crop, while N lost below the rooting zone could be assumed to be an environmental loss via leaching or gaseous loss. Baseline samples were composited by treatment replicates in both study years, however both treatment-level values and field averages are presented in table 3. 20 Microplot sampling followed the same protocol except three cores were taken per microplot (sample 15N). Sampled soils were then air-dried, passed through a 2mm sieve, and prepared for 15N/14N analysis. Whole plant biomass sampling occurred for all four cover crops within the main plots (control 15N) and microplots (sample 15N) in late fall immediately following frost termination or the observation of dormancy. Overwintering varieties that continued growing in the spring following dormancy, were also sampled prior to spring termination (Table 1). Fall plant sample results are presented as five plant averages as there was limited biomass to sample at field scale (<100 kg ha-1). Spring plant biomass was estimated using a 1.5m by 1.5m quadrat. Within both the main and microplots at each sampling time, five plants were gently extracted from the soil to preserve intact shoot and root biomass. Roots were carefully washed with DI water to remove excess soil particles, then root biomass was separated from shoot biomass before being oven-dried @ 60°C, ground, and prepared for 15N/14N and inorganic N analysis.
Calculations and Statistical Analysis
All calculations were derived from Ma et al. (2022).
Plant 15N/TN
- At% 15N Excess = Sample at% 15N − Control at% 15N
- % Manure Derived N = at% 15N excess plant ÷ at% 15N excess manure × 100
- Manure Derived 15N in Plant (mg) = (Plant at% 15N excess ÷ 100) × (% Total N ÷ 100) × plant weight (5 plant avg; g) × 1000
- % of Manure 15N in Whole Plant Recovered by Plant Part = (Manure Derived 15N in shoot or root) ÷ (Manure Derived 15N in shoot + Manure Derived 15N in root)
- Manure N Uptake (kg ha-1) = plant biomass (kg ha-1) × (% Total N ÷ 100) × (% Manure derived N ÷ 100)
6. % Manure N Utilization (of total or estimated available manure N applied) = Manure N uptake (kg ha-1) ÷ Application level of manure N (kg ha-1) × 100
Soil 15N/TN
- At% 15N Excess = Sample at% 15N − Control at% 15N
- % Manure Derived N = at% 15N excess soil ÷ at% 15N excess manure × 100
- Manure N in Soil (kg ha-1) = soil weight (kg ha-1) × (% Total N ÷ 100) × (% Manure derived N ÷ 100)
All statistical analysis was performed in program R (version 4.2.1; R Core Team, 2022). To assess treatment effects of cover crop variety on manure derived nitrogen in cover crop roots, shoots and through the soil profile, we ran linear mixed effects ANOVA’s using the nlme package. Blocks were coded as random effects. Soil depth intervals and sampling times were analyzed separately. Residual normality and homoscedasticity were confirmed with diagnostic plots and data transformations were used when necessary. R package emmeans was used for post-hoc analysis of significant effects between treatment means (p<0.05).
Fall 2023/2024 plant data
Plant biomass and N content showed significant variation among cover crop varieties in both shoot and root across both study years at Fall sampling (Table 3; Variety; P < 0.05). In Fall 2023, rye shoot weights (5 plant average) were significantly greater than all other varieties, and barley was greater than both oats and wheat (Table 3; Variety; P < 0.001). However, in Fall 2024, barley shoots accumulated significantly greater biomass than all other varieties by 79-148% prior to winterkill (Table 3; Variety; P < 0.001). In Fall 2023, wheat root weights were >50% less than all other varieties (Table 3; Variety; P = 0.003), but no variety effects on root weight were apparent in Fall 2024. Shoot N content (%) varied significantly between varieties at Fall sampling (Table 3; Variety; P < 0.05). In both years, barley shoots had the greatest N content on average, however, barley shoots were only significantly greater than wheat and rye in Fall 2023 (Table 3; Variety; P = 0.006) and wheat in Fall 2024 (Table 3; Variety; P = 0.03). Root N content was greatest in barley in Fall 2023 (Table 3; Variety; P < 0.001) but did not signifiantly differ in Fall 2024.
Both at% excess 15N and % manure derived N did not differ between cover crop varieties in either study year for shoot or root. For shoot, at% excess ranged between 0.075- 0.110% in Fall 2023 and 0.103-0.127% in Fall 2024. For root, at% excess ranged between 0.062-0.094% in Fall 2023 and 0.074-0.113 in Fall 2024. % manure derived N for shoot ranged between 42-61% in Fall 2023 and 69-86% in Fall 2024. % manure derived N for root ranged between 34-52% in Fall 2023 and 48-77% in Fall 2024.
Manure N uptake significantly differed across varieties in both root and shoot in both study years (Table 3; Variety; P < 0.05). Manure N uptake in rye and barley shoot was greater than in wheat, but did not differ from oats in Fall 2023 (Table 3; Variety; P = 0.004). Likewise in Fall 2024, rye and barley shoot had the greatest manure N uptake, significantly more than both oats and wheat (Table 3; Variety; P = 0.006).
The % of manure 15N in whole plant recovered by plant part did not significantly differ across varieties in either study year. On average across varieties, 81% and 96% of 15N was distributed to the shoots in Fall 2023 and Fall 2024, respectively.
Table 3. Cover crop weight, Nitrogen uptake, and ¹⁵N enrichment of shoot and root biomass in four cover crop varieties (barley, oats, wheat, rye) measured in Fall 2023 and Fall 2024. Values are means ± standard error for five-plant averages. Metrics include plant weight (g), % total nitrogen, atom% ¹⁵N excess plant, % manure derived N in plant, manure-derived ¹⁵N in plant (mg), and recovery of manure ¹⁵N by plant part. Different letters indicate significant differences between varieties within each plant part and study year (p < 0.05).
|
Study Year |
Plant Part |
Variety |
Plant Weight (g; 5 plant avg.) |
% Total N |
At% 15N Excess Plant |
% Manure Derived N in Plant |
Manure 15N in Plant (mg; 5 plant avg.) |
% of Manure 15N in Whole Plant Recovered by Plant Part |
|
Fall 2023 |
Shoot |
Barley Oats Wheat Rye |
0.42 ± 0.05b |
5.49 ± 0.30c |
0.081 ± 0.02 |
45.1 ± 8.6 |
0.019 ± .004b |
77.4 ± 4.22 |
|
0.28 ± 0.05ab |
5.21 ± 0.30bc |
0.075 ± 0.02 |
41.8 ± 8.6 |
0.013 ± 0.004ab |
75.5 ± 3.66 |
|||
|
0.15 ± 0.05a |
4.06 ± 0.30a |
0.079 ± 0.02 |
43.7 ± 8.6 |
0.004 ± 0.004a |
83.9 ± 3.66 |
|||
|
0.65 ± 0.05c |
4.18 ± 0.3ab |
0.110 ± 0.02 |
61.1 ± 8.6 |
0.029 ± 0.004b |
89.0 ± 4.22 |
|||
|
P-Value (Variety) |
<0.001 |
0.006 |
0.256 |
0.256 |
0.004 |
0.155 |
||
|
Root |
Barley Oats Wheat Rye |
0.22 ± 0.02b |
3.37 ± 0.17b |
0.083 ± 0.02 |
46.1 ± 9.4 |
0.006 ± .001b |
22.6 ± 4.22 |
|
|
0.24 ± 0.02b |
1.86 ± 0.14a |
0.074 ± 0.01 |
41.0 ± 8.1 |
0.003 ± .001ab |
24.5 ± 3.66 |
|||
|
0.07 ± 0.02a |
1.93 ± 0.14a |
0.062 ± 0.01 |
34.1 ± 8.1 |
0.001 ± .001a |
16.1 ± 3.66 |
|||
|
0.21 ± 0.02b |
1.89 ± 0.17a |
0.094 ± 0.02 |
52.4 ± 9.4 |
0.004 ± .001ab |
11.0 ± 4.22 |
|||
|
P-Value (Variety) |
0.003 |
<0.001 |
0.522 |
0.522 |
0.054 |
0.155 |
||
|
Fall 2024 |
Shoot |
Barley Oats Wheat Rye |
3.79 ± 0.33b |
4.39 ± 0.20b |
0.127 ± 0.02 |
85.8 ± 9.5 |
0.172 ± 0.019b |
97.7 ± 0.83 |
|
1.68 ± 0.33a |
4.30 ± 0.20ab |
0.113 ± 0.02 |
76.1 ± 9.5 |
0.070 ± 0.019a |
95.2 ± 0.83 |
|||
|
1.53 ± 0.33a |
3.91 ± 0.20a |
0.103 ± 0.02 |
69.2 ± 9.5 |
0.057 ± 0.019a |
96.4 ± 0.83 |
|||
|
2.12 ± 0.33a |
4.31 ± 0.20ab |
0.110 ± 0.02 |
74.2 ± 9.5 |
0.111 ± 0.019ab |
94.6 ± 0.83 |
|||
|
P-Value (Variety) |
<0.001 |
0.030 |
0.682 |
0.667 |
0.006 |
0.109 |
||
|
Root |
Barley Oats Wheat Rye |
0.34 ± 0.05 |
1.77 ± 0.10 |
0.102 ± 0.02 |
68.4 ± 9.0 |
0.004 ± 0.001ab |
2.3 ± 0.83 |
|
|
0.26 ± 0.05 |
1.47 ± 0.10 |
0.096 ± 0.02 |
64.1 ± 9.0 |
0.004 ± 0.001ab |
4.8 ± 0.83 |
|||
|
0.23 ± 0.05 |
1.68 ± 0.10 |
0.074 ± 0.02 |
48.2 ± 9.0 |
0.002 ± 0.001a |
3.6 ± 0.83 |
|||
|
0.33 ± 0.05 |
1.78 ± 0.10 |
0.113 ± 0.02 |
76.7 ± 9.0 |
0.006 ± 0.001b |
5.4 ± 0.83 |
|||
|
P-Value (Variety |
0.336 |
0.195 |
0.195 |
0.188 |
0.059 |
0.109 |
||
While we found that all four cover crop varieties successfully established prior to winter-kill or dormancy, none of the varieties likely accumulated an environmentally relevant amount of biomass (<100 kg ha-1) or N to support their use as N scavengers. Despite this, manure N transfer could be confirmed in all varieties, and accumulated biomass of barley and oats may have provided additional ecosystem services like groundcover for erosion control over the winter. Both study years were marked by early to mid-Fall planting dates, a consequence of later corn silage harvest, highlighting the challenges of relatively short growing seasons and time for post-harvest cover crop establishment in South Central Wisconsin. Other previous studies have explored the relationship between fall planting dates and biomass potential in cereal rye, showing critical drops in biomass accumulation and, therefore N uptake, when planting is delayed even a few weeks from mid-September to early October (Duiker, 2014; Farsad et al., 2011). We observed similar trends between year 1 and 2 of our study, as planting two weeks earlier in year 2, compared to year 1 (Table 1) related to greater fall biomass growth and N uptake across all varieties. In corn silage systems, options for pre-harvest establishment include modified drill seeding mid-summer or late-summer broadcast inter-seeding. Both approaches require specialized or modified equipment, and may present nutrient or water competition with corn, but offer a longer establishment period and greater potential for manure N uptake prior to winter (Baributsa et al., 2008; Brooker et al., 2020; Klopp, 2024; Malone et al., 2022).
Spring 2024/2025 plant data
Plant biomass and N content also showed significant variation between rye and wheat in both shoot and root across both study years at Spring sampling (Table 4; Variety; P < 0.05). Rye accumulated significantly greater root and shoot biomass than wheat in both study years (Fig. 3 Table 4; Variety; P < 0.001). Rye shoot and root biomass were 45% and 111% greater than wheat in Spring 2024 and 2025, respectively. Wheat shoot N content (%) was significantly greater than rye at Spring sampling for both study years (Table 4; Variety; P < 0.05). Wheat shoot content was 70% and 132% greater than in rye for Spring 2024 and 2025, respectively. Likewise, wheat root N content was greater than rye, but only significantly differed in Spring 2025 by 85% (Table 4; Variety; P = 0.005).
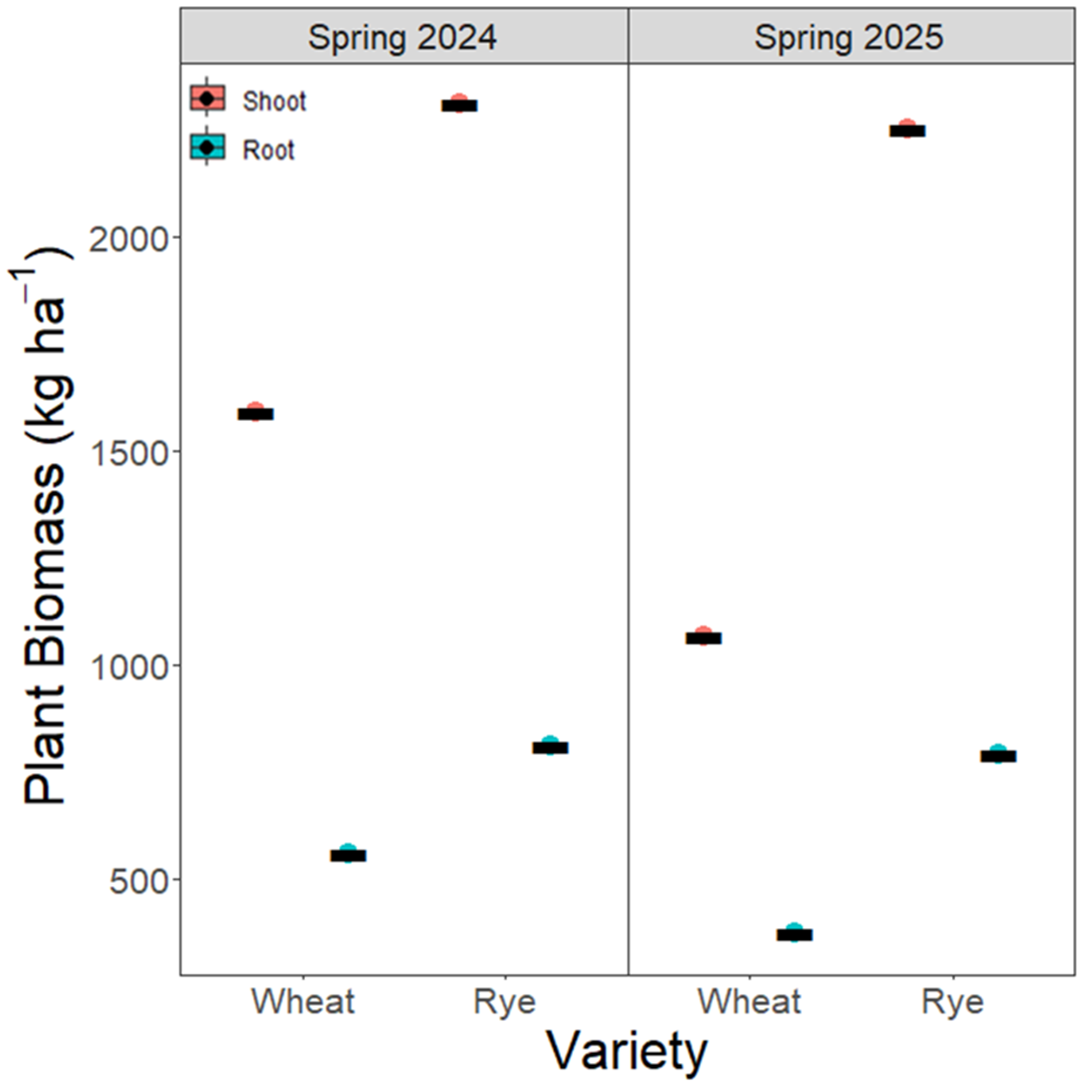
Fig. 3. Shoot and root biomass (kg ha⁻¹) of wheat and rye measured in Spring 2024 and Spring 2025. Biomass values are presented separately for shoots and roots within each variety and year. Colored points show individual treatment values, with black bars indicating treatment means.
Table 4. Cover crop biomass, Nitrogen uptake, and ¹⁵N enrichment of shoot and root biomass in two cover crop varieties (wheat and rye) measured in Spring 2024 and Spring 2025. Values are means ± standard error. Metrics include plant biomass (kg ha-1), % total nitrogen, atom% ¹⁵N excess plant, % manure derived N in plant, manure N uptake (kg ha-1), total N uptake (kg ha-1), and % manure N utilization of total and estimated available manure N. Different letters indicate significant differences between varieties within each plant part and study year (p < 0.05).
|
Study Year |
Plant Part |
Variety |
Plant Biomass (kg ha-1) |
% Total N |
At% 15N Excess Plant |
% Manure Derived N in Plant |
Manure N Uptake (kg ha-1) |
Total N Uptake (kg ha-1) |
% Manure N Utilization (of total manure N) |
% Manure N Utilization (of est. 1st year available N) |
|
Spring 2024 |
Shoot |
Wheat |
1591a |
3.13 ± 0.15b |
0.041 ± 0.003a |
22.9 ± 1.7a |
12.8 ± 1.2 |
52.6 ± 2.6b |
5.17 ± 0.48 |
19.0 ± 1.8 |
|
Rye |
2310b |
1.84 ± 0.15a |
0.064 ± 0.003b |
35.4 ± 1.7b |
14.7 ± 1.0 |
41.3 ± 2.6a |
5.95 ± 0.48 |
21.8 ± 1.5 |
||
|
P-Value (Variety) |
<0.001 |
0.008 |
0.010 |
0.010 |
0.345 |
0.053 |
0.345 |
0.345 |
||
|
Root |
Wheat |
497a |
1.02 ± 0.04 |
0.033 ± 0.004 |
18.4 ± 2.1 |
1.22 ± 0.21 |
6.01 ± 3.1 |
0.50 ± 0.01 |
1.82 ± 0.31 |
|
|
Rye |
721b |
0.89 ± 0.04 |
0.043 ± 0.004 |
23.9 ± 2.1 |
1.69 ± 0.18 |
7.00 ± 3.1 |
0.69 ± 0.01 |
2.51 ± 0.27 |
||
|
P-Value (Variety) |
<0.001 |
0.134 |
0.157 |
0.157 |
0.203 |
0.104 |
0.203 |
0.203 |
||
|
Spring 2025 |
Shoot |
Wheat |
1066a |
2.81 ± 0.12b |
0.064 ± 0.013a |
43.2 ± 9.5a |
13.3 ± 3.2a |
30.0 ± 1.3 |
5.39 ± 1.28a |
19.8 ± 4.7a |
|
Rye |
2253b |
1.21 ± 0.12a |
0.088 ± 0.013b |
60.0 ± 9.5b |
16.5 ± 3.2b |
27.3 ± 1.3 |
6.70 ± 1.28b |
24.6 ± 4.7b |
||
|
P-Value (Variety) |
<0.001 |
0.001 |
0.016 |
0.021 |
0.045 |
0.146 |
0.045 |
0.045 |
||
|
Root |
Wheat |
372a |
1.11 ± 0.05b |
0.062 ± 0.008 |
40.9 ± 6.0 |
1.79 ± 0.34 |
4.14 ± 0.2 |
0.72 ± 0.14 |
2.65 ± 0.51 |
|
|
Rye |
789b |
0.60 ± 0.05a |
0.028 ± 0.007 |
19.4 ± 5.2 |
0.94 ± 0.30 |
4.74 ± 0.2 |
0.38 ± 0.12 |
1.40 ± 0.44 |
||
|
P-Value (Variety) |
<0.001 |
0.005 |
0.084 |
0.095 |
0.206 |
0.128 |
0.206 |
0.206 |
||
Both at% excess 15N and % manure derived N significantly varied between wheat and rye shoot (Table 4; Fig. 4; Variety; P < 0.05), but not root. Rye shoot at% excess was 56% and 38% greater than wheat in Spring 2024 and 2025, respectively. Root at% excess for wheat and rye, on average, was 0.038 and 0.045%, respectively. % manure derived N in rye was 55% and 39% greater than wheat in Spring 2024 and 2025, respectively.

Fig. 4. % manure derived N in plant shoots and roots of wheat and rye measured in Spring 2024 and Spring 2025. Values are presented separately for shoots and roots within each variety and year. Colored points show individual treatment values, with black bars indicating treatment means.
Manure N uptake in rye shoot was significantly greater than wheat in Spring 2025 by 24% (Table 4; Fig. 5; Variety; P = 0.045) but did not differ for shoot in Spring 2024. Root manure N uptake did not differ between wheat and rye in either study year. Manure N uptake ranged between12.8- 16.5 kg ha-1 and 0.94-1.79 kg ha-1 for shoot and root, respectively, across both varieties and study year. In contrast, total N uptake in rye root was significantly greater than wheat in Spring 2024 by 27% (Table 4; Fig. 6; Variety; P = 0.053) and did not differ in root for either study year. Total N uptake ranged between 27.3-52.6 kg ha-1 and 4.14-7.00 kg ha-1 for shoot and root, respectively. Similar to manure N uptake, manure utilization rates (both of total manure N and estimated 1st year available N) of rye shoot, was significantly greater than wheat by 24% (Table 4; Fig. 7,8; Variety; P = 0.045). Total manure N utilization rate ranged between 5.17-6.70% and 0.38-0.72% for shoot and root, respectively. 1st year available manure N utilization rate ranged between 19.0-24.6% and 1.40-2.65% for shoot and root, respectively.
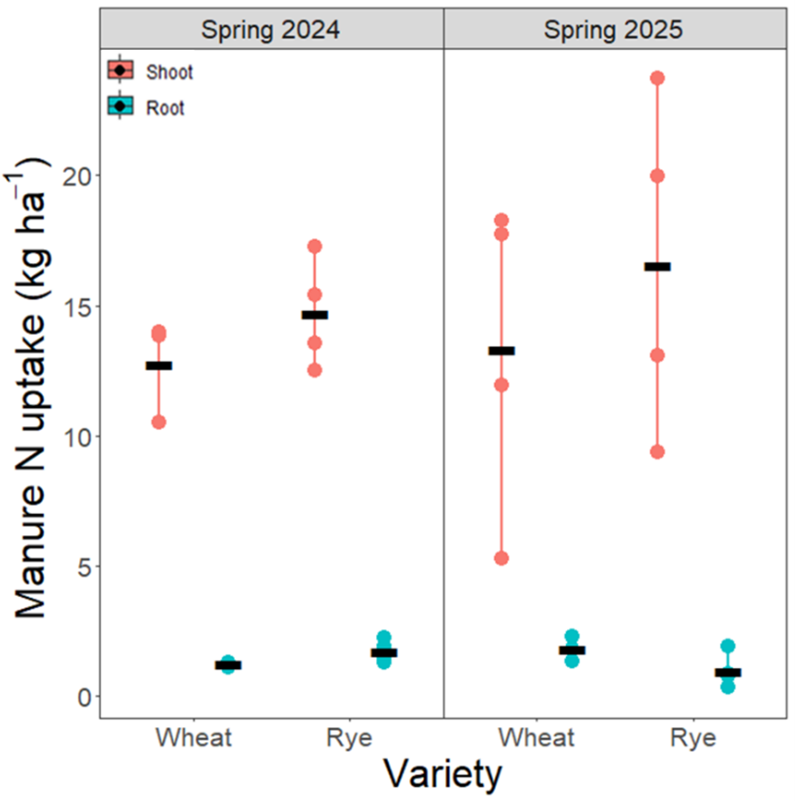
Fig. 5. Manure N uptake (kg ha⁻¹) plant shoots and roots of wheat and rye measured in Spring 2024 and Spring 2025. Values are presented separately for shoots and roots within each variety and year. Colored points show individual treatment values, with black bars indicating treatment means.
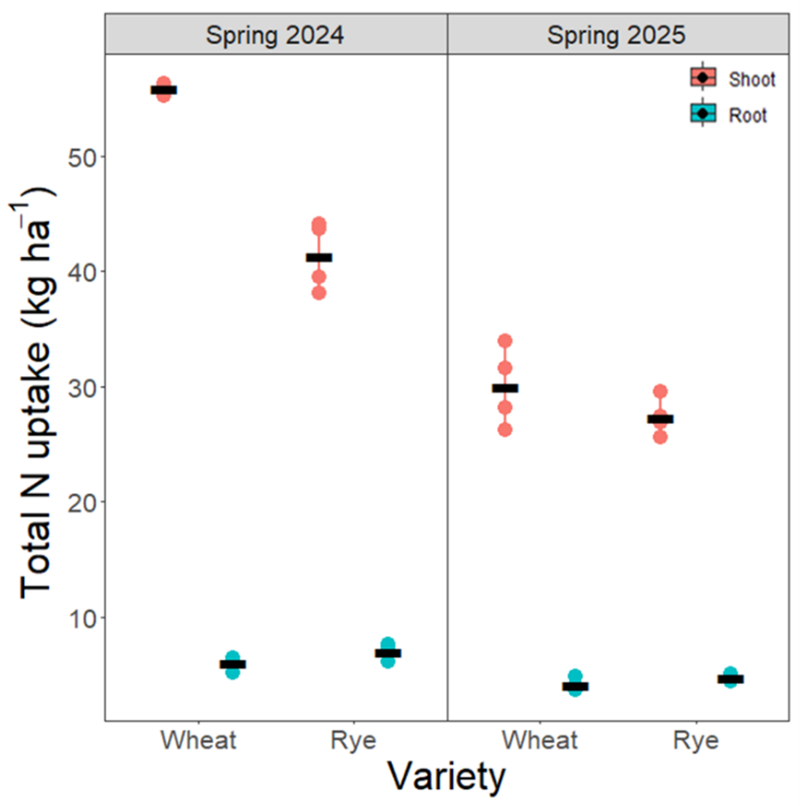
Fig. 6. Total N uptake (kg ha⁻¹) plant shoots and roots of wheat and rye measured in Spring 2024 and Spring 2025. Values are presented separately for shoots and roots within each variety and year. Colored points show individual treatment values, with black bars indicating treatment means.
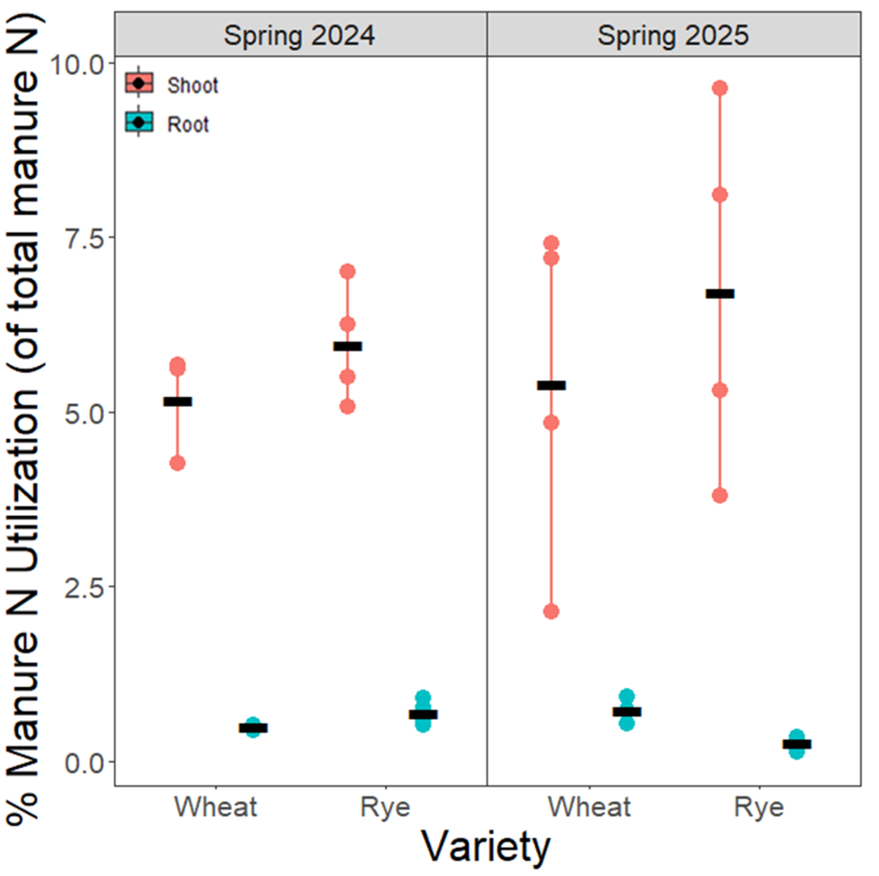
Fig. 7. % manure N utilization of total manure N applied (~247 kg ha-1) in plant shoots and roots of wheat and rye measured in Spring 2024 and Spring 2025. Values are presented separately for shoots and roots within each variety and year. Colored points show individual treatment values, with black bars indicating treatment means.
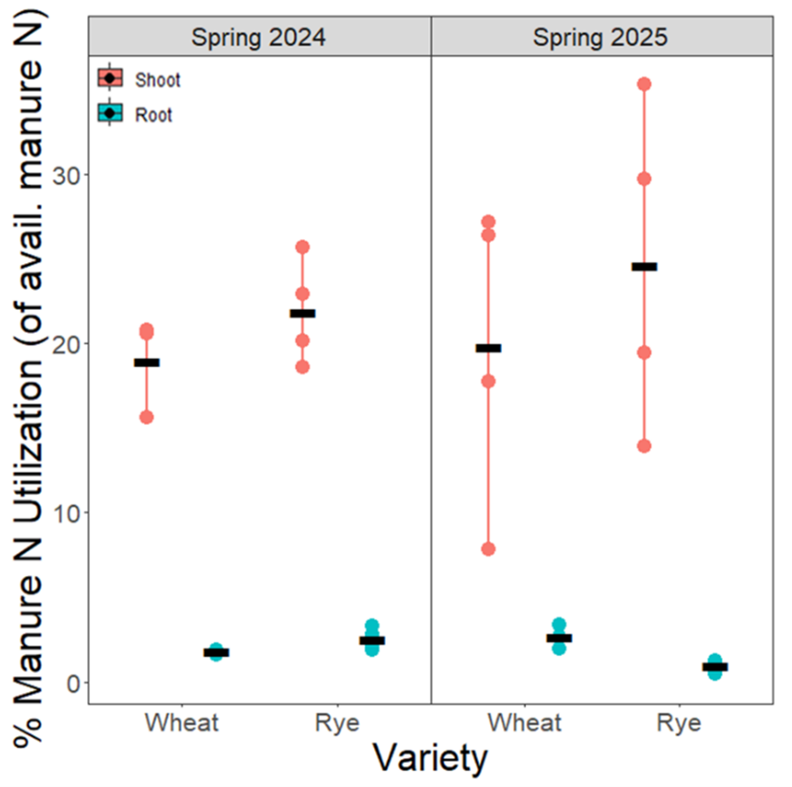
Fig. 8. % manure N utilization of estimated available manure N applied (~67 kg N ha-1) in plant shoots and roots of wheat and rye measured in Spring 2024 and Spring 2025. Values are presented separately for shoots and roots within each variety and year. Colored points show individual treatment values, with black bars indicating treatment means.
Despite differences in fall planting dates in our study, Wheat and Rye both had successful continued growth post-dormancy in Spring 2024 and 2025, accumulating early spring biomass and effectively scavenging 30-60 kg N ha-1 (shoot and root) prior to termination, 23-60% of which was manure derived N. Although rye consistently re-established with greater biomass than wheat in both study years, greater N content of wheat shoot amounted to significantly greater total N uptake overall, especially in year 1. This result aligns with previous literature describing winter hardiness and robust spring as defining qualities of rye, likely contributing to its place as the top cover crop planted into corn silage in the US (Huddell et al., 2024; Roth et al., 2023). However, the greater N content of wheat, combined with less aggressive spring growth, make wheat another appealing option for many producers (Wallander et al., 2021). While this does not imply that rye truly has preferential uptake of manure N, it does suggest that physiological and architectural root system differences play a significant role in nutrient acquisition potential, as previous studies have addressed (Fujii, 2024; Kristensen and Thorup-Kristensen, 2004; Shtangeeva et al., 2011).The greater accumulated root biomass of rye, along with its dense fibrous root system may simply provide greater surface area, and thus, greater accessibility to highly mobile manure N in plant available forms.
Fall 2023/2024 soil data
In early Fall 2023 (T0), pre-treatment baseline TN and at% 15N did not differ across the field in the top 20cm of soil. Soil contained a %TN of 0.206 and at% 15N of 0.373. Similarly for early Fall 2024 (T0), baseline soil conditions did not differ across the field at 0-20cm or 20-40cm. At 0-20cm, soil contained a %TN of 0.172 and at%15N of 0.373. At 20-40cm, soil contained a %TN of 0.101 and at%15N of 0.372.
In late Fall 2023 (T1), immediately following cover crop winterkill and overwintering, At% 15N excess soil was not significantly different across treatments, but ranged from 0.0009-0.0032 across treatments, translating to between 0.49-1.79% of total soil N or 23.9- 89.4 kg ha-1 manure derived N in soil (Table 5, Fig. 9,10). In late Fall 2024 (T1), like 2023,at 0-20cm, at% 15N excess soil was not significantly different across treatments, but ranged from 0.0026-0.0044, translating to between 1.83- 3.14% of total soil N or 72.8- 137.4 kg ha-1 manure derived N in soil (Table 6; Fig. 12,13). At 20-40cm, at% 15N excess soil was also not significantly different across treatments, but ranged from 0.0017-0.0042, translating to between 1.21- 3.00% of total soil N or 24.9- 62.7 kg ha-1 manure derived N in soil (Table 5; Fig. 9,10).
Table 5. T1 soil % total N, atom% 15N soil, % manure derived N in soil, and manure N in soil (kg ha-1) across five cover crop treatments (no cover crop (NoCC), barley, oats, wheat, rye) measured in Fall 2023 and Fall 2024. In year 1, soil samples were only taken at 0-20cm due to soil conditions. In year 2, soil samples were taken at 0-20cm and 20-40cm. Different letters indicate significant differences between varieties within each plant part and study year (p < 0.05).
|
Study Year |
Depth |
Variety |
% Total N |
At% 15N excess Soil |
% Manure Derived N in Soil |
Manure N in Soil (kg ha-1) |
|
T1 Fall 2023 |
0-20cm |
No CC |
0.227 ± 0.007 |
0.0032 ± 0.0009 |
1.79 ± 0.48 |
64.1 ± 21.9 |
|
Barley Oats Wheat Rye |
0.219 ± 0.006 |
0.0032 ± 0.0009 |
1.78 ± 0.48 |
89.4 ± 21.9 |
||
|
0.227 ± 0.007 |
0.0009 ± 0.0010 |
0.49 ± 0.55 |
23.9 ± 25.3 |
|||
|
0.233 ± 0.006 |
0.0021 ± 0.0009 |
1.17 ± 0.48 |
63.0 ± 21.9 |
|||
|
0.221 ± 0.006 |
0.0031 ± 0.0009 |
1.72 ± 0.48 |
89.2 ± 21.9 |
|||
|
P-Value (Variety) |
0.459 |
0.374 |
0.374 |
0.345 |
||
|
T1 Fall 2024 |
0-20cm |
No CC |
0.173 ± 0.006 |
0.0034 ± 0.0010 |
1.78 ± 0.08 |
97.3 ± 32.2 |
|
Barley Oats Wheat Rye |
0.177 ± 0.006 |
0.0026 ± 0.0014 |
1.82 ± 0.08 |
72.8 ± 45.5 |
||
|
0.173 ± 0.006 |
0.0027 ± 0.0014 |
1.76 ± 0.08 |
73.5 ± 45.5 |
|||
|
0.187 ± 0.006 |
0.0028 ± 0.0010 |
1.80 ± 0.08 |
85.7 ± 32.2 |
|||
|
0.190 ± 0.006 |
0.0044 ± 0.0010 |
2.07 ± 0.08 |
137.4 ± 32.2 |
|||
|
P-Value (Variety) |
0.255 |
0.770 |
0.463 |
0.720 |
||
|
20-40cm |
No CC |
0.107 ± 0.003b |
0.0031 ± 0.0009 |
1.01 ± 0.05 |
54.3 ± 12.9 |
|
|
Barley Oats Wheat Rye |
0.091 ± 0.003ab |
0.0017 ± 0.0009 |
0.81 ± 0.05 |
24.9 ± 12.9 |
||
|
0.085 ± 0.003a |
0.0032 ± 0.0009 |
0.79 ± 0.05 |
44.6 ± 12.9 |
|||
|
0.100 ± 0.003ab |
0.0018 ± 0.0009 |
0.94 ± 0.05 |
29.4 ± 12.9 |
|||
|
0.092 ± 0.003ab |
0.0042 ± 0.0012 |
0.86 ± 0.06 |
62.7 ± 18.3 |
|||
|
P-Value (Variety) |
0.020 |
0.485 |
0.140 |
0.452 |
||
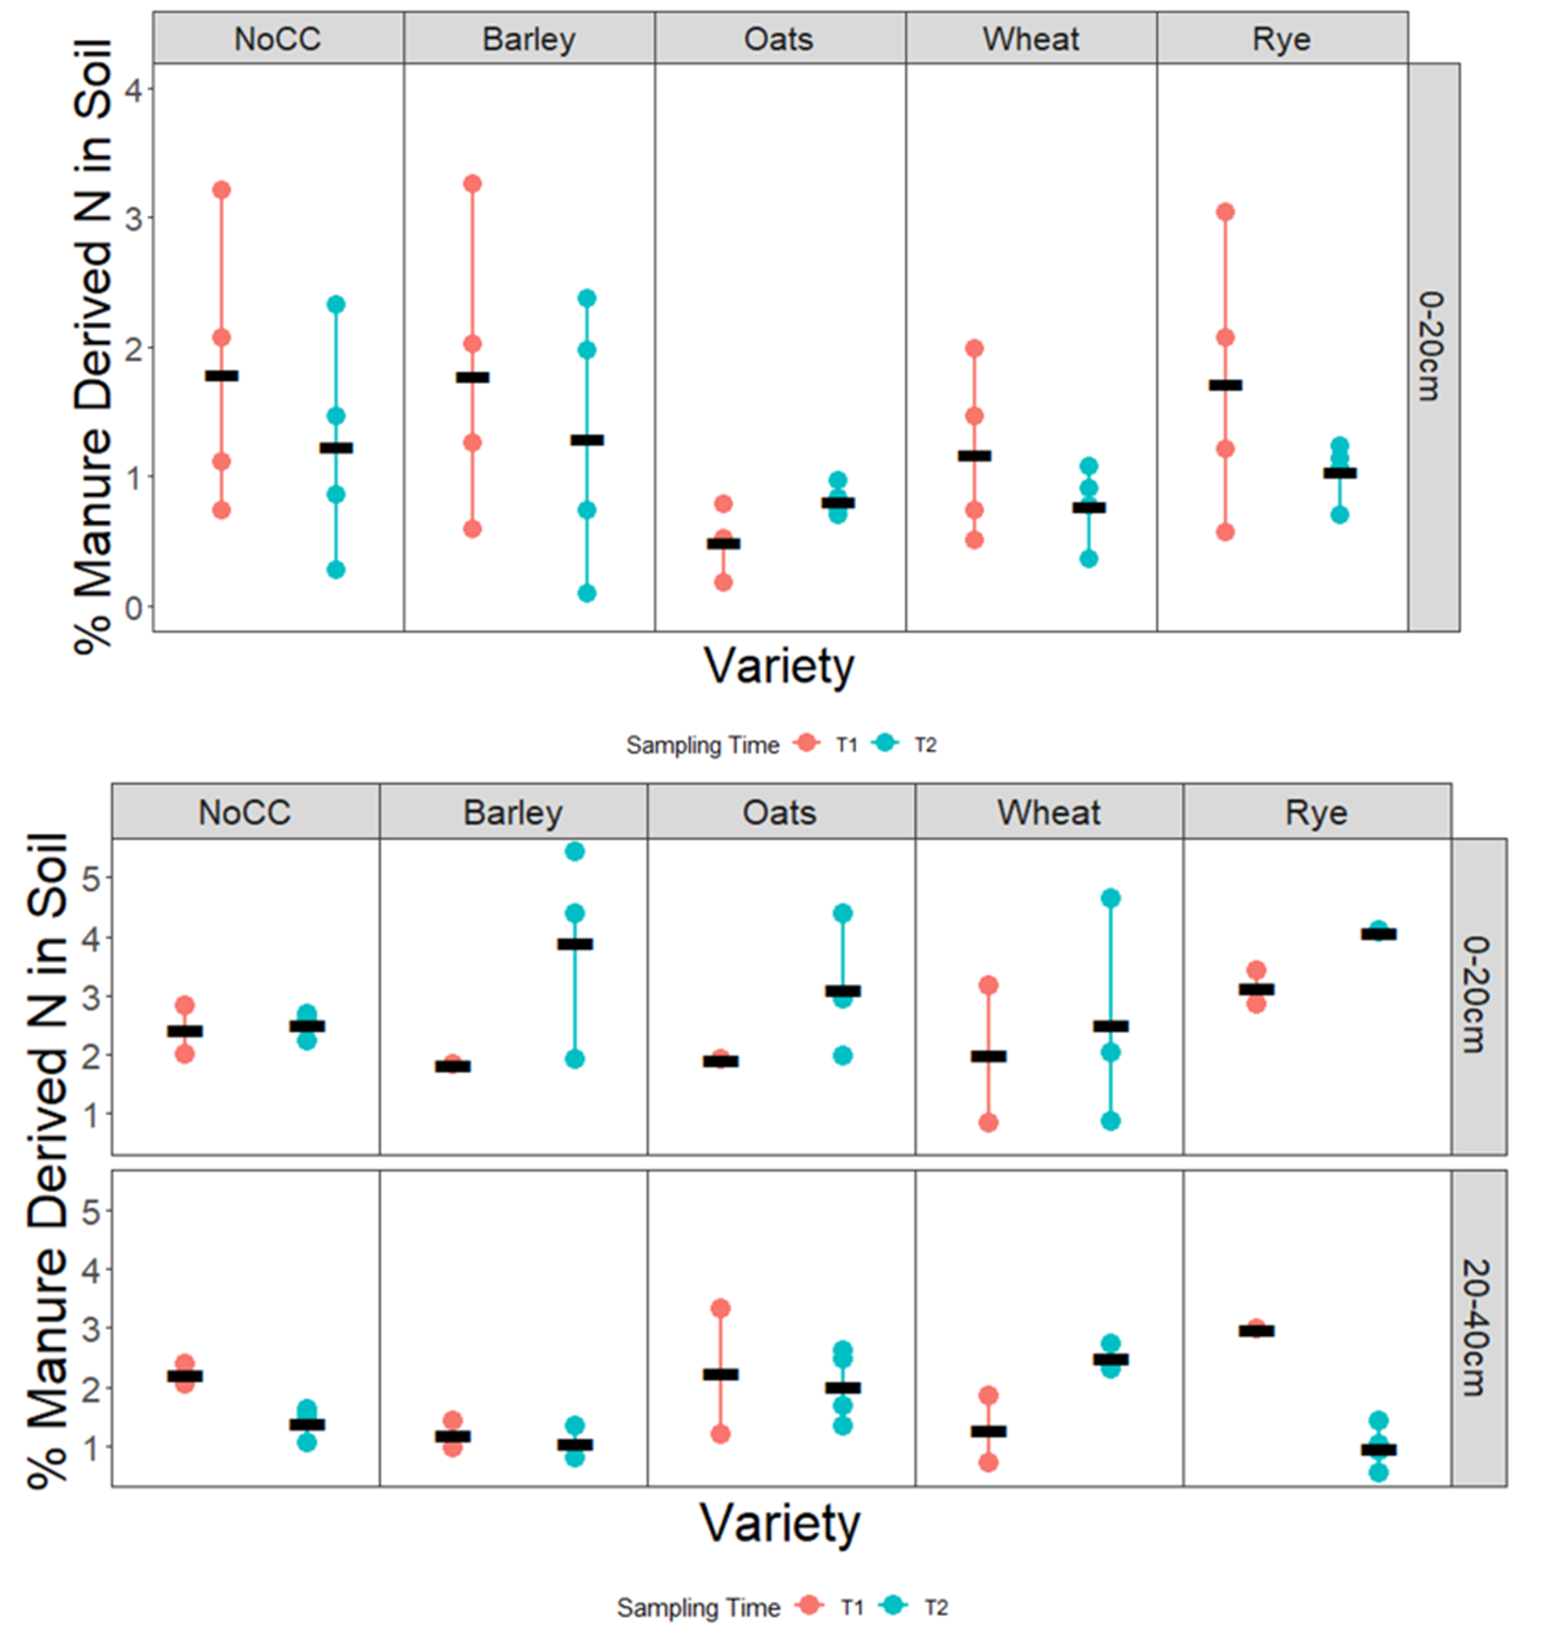
Fig. 9. % manure derived N in soil measured at two sampling times; late-Fall (T1) and late Spring (T2) across five treatments (No cover crop (NoCC), Barley, Oats, Wheat, and Rye) in study year 1 (top) and study year 2 (bottom). In year 1, soil samples were only taken at 0-20cm due to soil conditions. In year 2, soil samples were taken at 0-20cm and 20-40cm.
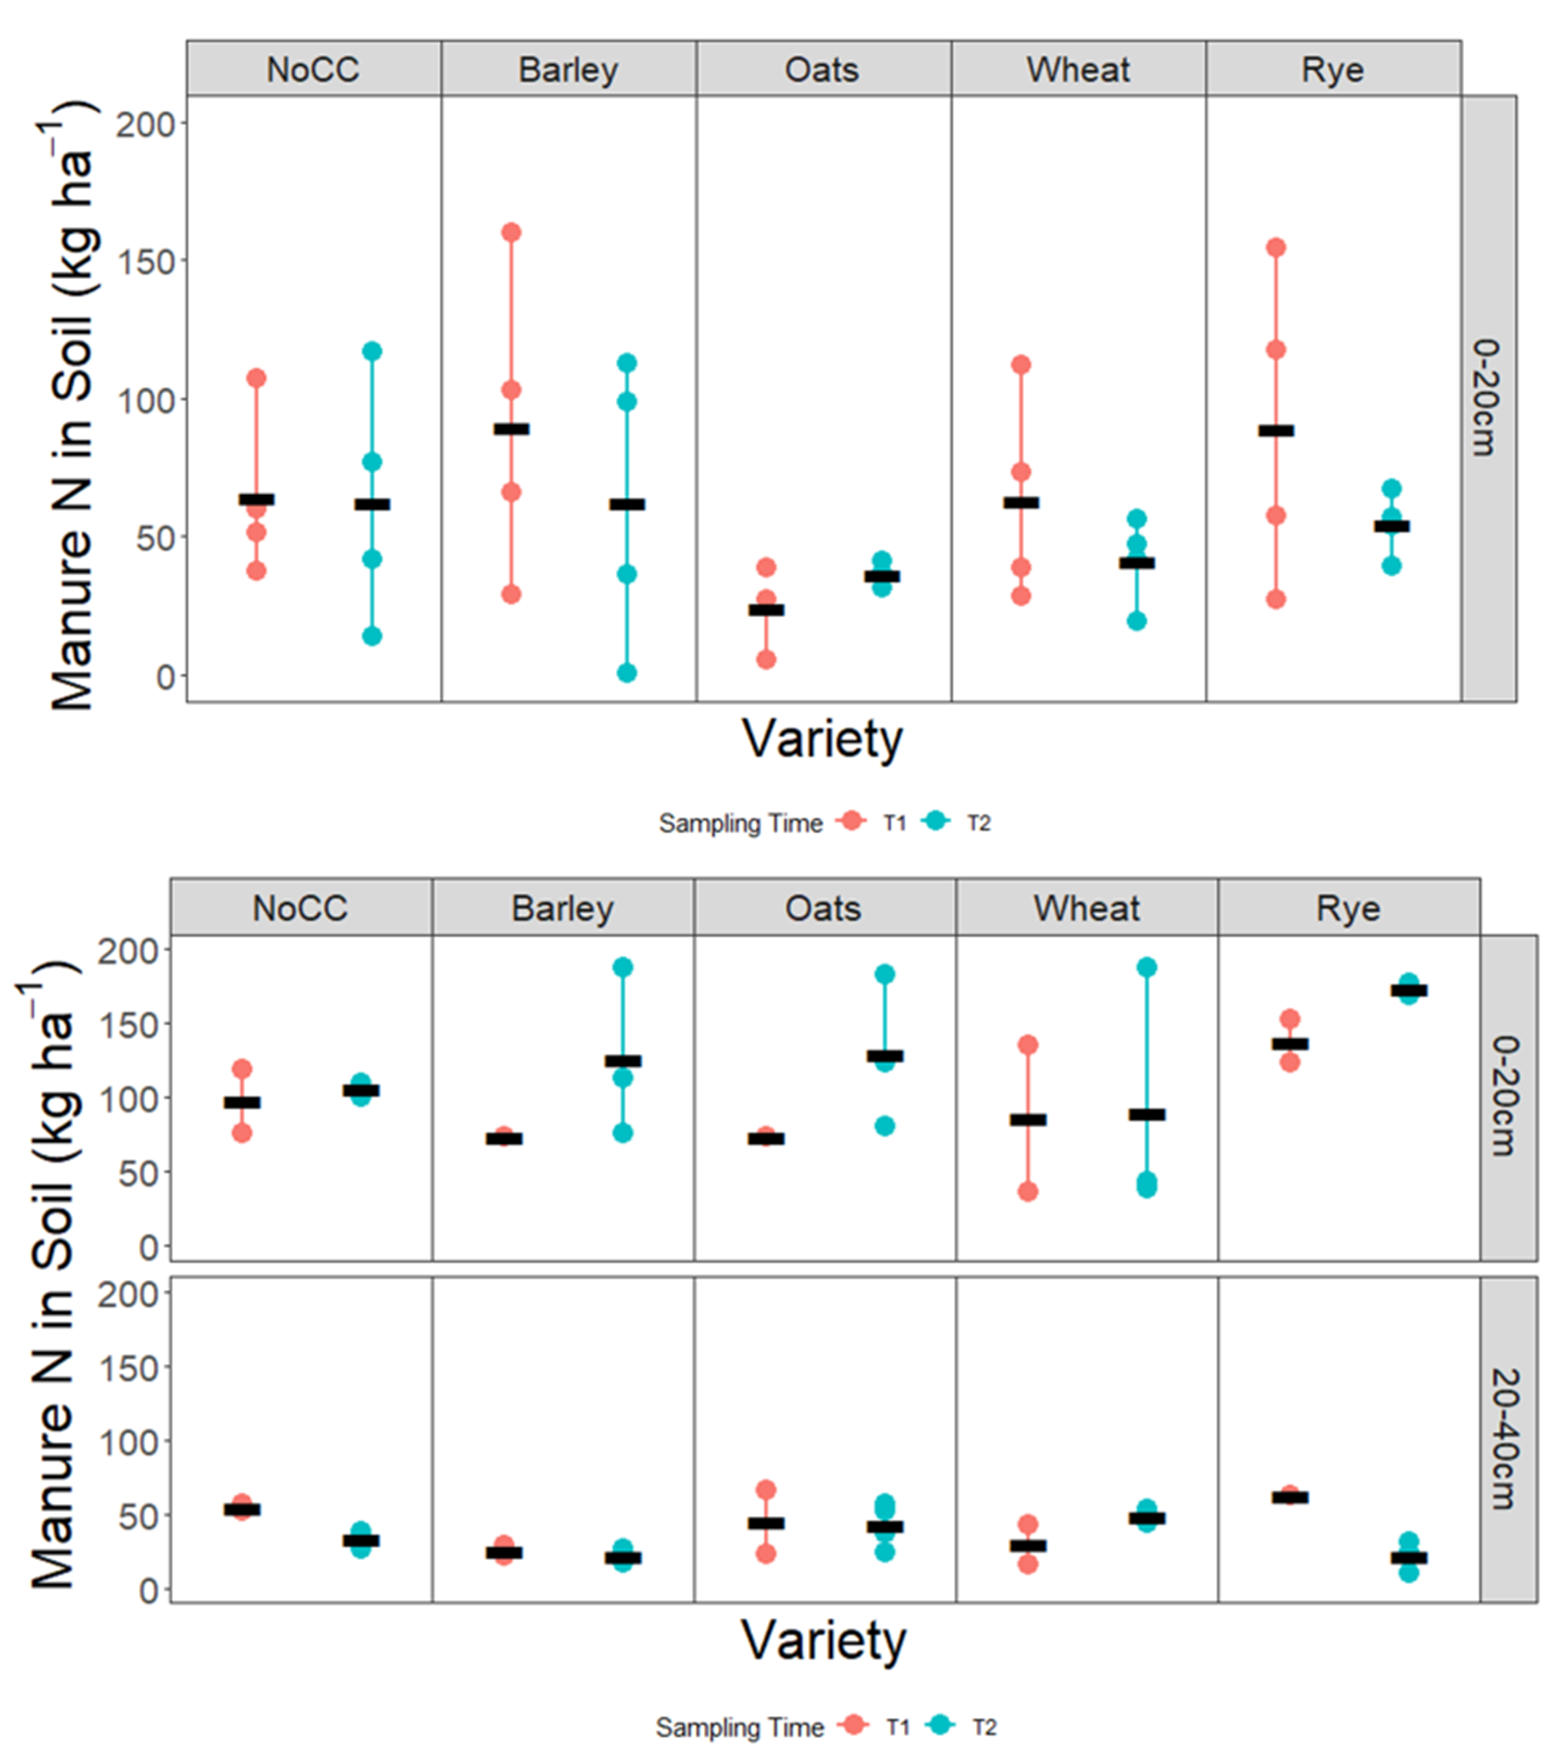
Fig. 10. Manure N in soil (kg ha-1) measured at two sampling times; late-Fall (T1) and late Spring (T2) across five treatments (No cover crop (NoCC), Barley, Oats, Wheat, and Rye) in study year 1 (top) and study year 2 (bottom). In year 1, soil samples were only taken at 0-20cm due to soil conditions. In year 2, soil samples were taken at 0-20cm and 20-40cm.
Spring 2024/2025 soil data
In spring 2024 (T2), prior to termination % manure derived N and manure N in soil did not significantly differ across treatments however respective decreases of 35% and 29% from late fall to spring sampling (Table 6; Fig. 9,10).
In Spring 2025 (T2), % manure derived N also significantly differed across treatments at both depth layers (Table 6; Fig. 9; Variety; P < 0.05), where barley was significantly greater than no CC at 0-20cm, and wheat had a greater % manure derived N than all treatments other than oats at 20-40cm. Manure N in soil followed a similar trend at 20-40cm, with both oats and wheat were significantly greater than barley and rye by 106% (Table 6; Fig. 10; Variety; P = 0.006). The % manure derived N and manure N in soil also saw respective increases from fall to spring by 35% and 32%. At 20-40cm, TN decreased by 3%. The % manure derived N and manure N in soil also both decreased from fall to spring by 30% and 37%, respectively.
Table 6. T2 soil % total N, atom% 15N soil, % manure derived N in soil, and manure N in soil (kg ha-1) across five cover crop treatments (no cover crop (NoCC), barley, oats, wheat, rye) measured in Fall 2023 and Fall 2024. In year 1, soil samples were only taken at 0-20cm due to soil conditions. In year 2, soil samples were taken at 0-20cm and 20-40cm. Different letters indicate significant differences between varieties within each plant part and study year (p < 0.05).
|
Study Year |
Depth |
Variety |
% Total N |
At% 15N excess Soil |
% Manure Derived N in Soil |
Manure N in Soil (kg ha-1) |
|
T2 Spring 2024 |
0-20cm |
No CC |
0.219 ± 0.024 |
0.0022 ± 0.0006 |
1.23 ± 0.32 |
62.3 ± 16.1 |
|
Barley Oats Wheat Rye |
0.165 ± 0.024 |
0.0023 ± 0.0006 |
1.30 ± 0.32 |
62.1 ± 16.1 |
||
|
0.189 ± 0.028 |
0.0015 ± 0.0006 |
0.81 ± 0.32 |
36.1 ± 16.1 |
|||
|
0.225 ± 0.028 |
0.0014 ± 0.0006 |
0.78 ± 0.32 |
41.1 ± 16.1 |
|||
|
0.238 ± 0.028 |
0.0019 ± 0.0006 |
1.04 ± 0.32 |
54.3 ± 16.1 |
|||
|
P-Value (Variety) |
0.295 |
0.703 |
0.703 |
0.694 |
||
|
T2 Spring 2025 |
0-20cm |
No CC |
0.181 ± 0.004 |
0.0027 ± 0.0012a |
1.92 ± 0.84a |
92.6 ± 31.8 |
|
Barley Oats Wheat Rye |
0.184 ± 0.005 |
0.0062 ± 0.0012b |
4.39 ± 0.84b |
140.6 ± 31.6 |
||
|
0.180 ± 0.005 |
0.0035 ± 0.0012ab |
2.51 ± 0.84ab |
115.4 ± 31.8 |
|||
|
0.186 ± 0.005 |
0.0035 ± 0.0012ab |
2.51 ± 0.84ab |
91.1 ± 31.5 |
|||
|
0.186 ± 0.004 |
0.0055 ± 0.0013ab |
3.90 ± 0.91ab |
175.8 ± 36.6 |
|||
|
P-Value (Variety) |
0.798 |
0.044 |
0.044 |
0.262 |
||
|
20-40cm |
No CC |
0.105 ± 0.004c |
0.0018 ± 0.0004ab |
1.26 ± 0.26ab |
29.5 ± 6.10ab |
|
|
Barley Oats Wheat Rye |
0.092 ± 0.004abc |
0.0014 ± 0.0004a |
1.03 ± 0.29a |
20.1 ± 6.67a |
||
|
0.090 ± 0.00ab |
0.0028 ± 0.0003bc |
2.02 ± 0.23bc |
42.2 ± 5.75b |
|||
|
0.079 ± 0.004a |
0.0033 ± 0.0004c |
2.37 ± 0.29c |
44.0 ± 6.67b |
|||
|
0.095 ± 0.004bc |
0.0014 ± 0.0003a |
0.98 ± 0.23a |
21.7 ± 5.75a |
|||
|
P-Value (Variety) |
0.004 |
0.004 |
0.004 |
0.006 |
||
Soil TN and at% 15N increased from baseline (T0) to late fall (T1) sampling, reflecting manure additions to soil. Increasing trends in TN and % manure derived N from Fall to Spring sampling times, particularly in year 2, point to significant redistribution of manure N throughout the soil profile from fall to spring via leaching (Delin et al., 2024; Ma et al., 2022). Manure N concentrated within top few centimeters of soil may have been slower to move through the soil profile in year 2, further highlighting challenges related to the heterogeneity of manure and soil N distribution (Heinze et al., 2010; Shen et al., 2024; Zhang, 2019). Additionally, considering the relatively low rates of manure N utilization (of both total and available N), it is not unexpected to see few differences among treatments for % manure derived N and manure N in soil. While T2 sampling from year 2 did reveal significant differences at both depth layers, no consistent trends were identified that clearly aligned with cover crop biomass or N uptake patterns. Despite this, two identifiable takeaways from our results are that rye and wheat cover crops can play a significant role in reduction of manure N from the soil profile, and that a significant amount of applied manure N remains within the rooting zone from Fall to Spring that may be available to preceding cash crops planted.
Conclusion
In summary, integration of overwintering cover crops like wheat and rye offer the greatest potential to prevent environmental N losses, although their performance is subject to interannual variability and other operational constraints like planting and termination timing. Fall cover crop growth was strongly influenced by planting time and study year, which had cascading effects into the springtime, but generally, the earlier planting date in year 2 supported greater late-late fall growth. Cover crop selection can also greatly influence manure N uptake and soil N dynamics. In our study, rye growth and manure N uptake performance was consistently greater than wheat, although wheat tended to exhibit greater total N uptake with higher plant N content, as directly measured by stable isotope 15N. Both wheat and rye had notable manure N uptake, highlighting their ability as N scavengers, however a relatively high recovery of manure N within the top 40cm of soil in the spring could imply that manure N is still available to the next cash crop. While limited fall establishment periods remain a concern for cover crop adopters in the North Central region, our work showed that manure N uptake can still be maximized into the spring prior to termination, serving to reduce potential N losses along with other provided ecosystem services like ground cover and erosion control. Future studies should continue utilizing direct isotopic approaches to quantify the long-term impacts of cover crop planting, termination, and manure application timing on manure-derived N retention and availability to subsequent cash crops across diverse climatic and management conditions.
References
Baributsa, D.N., Foster, E.F., Thelen, K.D., Kravchenko, A.N., Mutch, D.R., Ngouajio, M., 2008. Corn and Cover Crop Response to Corn Density in an Interseeding System. Agron. J. 100, 981–987. https://doi.org/10.2134/agronj2007.0110
Brooker, A.P., Renner, K.A., Basso, B., 2020. Interseeding cover crops in corn: Establishment, biomass, and competitiveness in on-farm trials. Agron. J. 112, 3733–3743. https://doi.org/10.1002/agj2.20355
Delin, S., Mårtensson, K., Johnsson, H., 2024. Risk for nitrogen leaching after application of solid manure in autumn differs between manure types. Front. Environ. Sci. 12. https://doi.org/10.3389/fenvs.2024.1488638
Duiker, S.W., 2014. Establishment and Termination Dates Affect Fall-Established Cover Crops. Agron. J. 106, 670–678. https://doi.org/10.2134/agronj2013.0246
Farsad, A., Randhir, T.O., Herbert, S.J., Hashemi, M., 2011. Spatial Modeling of Critical Planting Date for Winter Rye Cover Crop to Enhance Nutrient Recovery. Agron. J. 103, 1252–1257. https://doi.org/10.2134/agronj2010.0433
Fujii, K., 2024. Plant strategy of root system architecture and exudates for acquiring soil nutrients. Ecol. Res. 39, 623–633. https://doi.org/10.1111/1440-1703.12477
Heinze, S., Raupp, J., Joergensen, R.G., 2010. Effects of fertilizer and spatial heterogeneity in soil pH on microbial biomass indices in a long-term field trial of organic agriculture. Plant Soil 328, 203–215. https://doi.org/10.1007/s11104-009-0102-2
Huddell, A.M., Thapa, R., Marcillo, G.S., Abendroth, L.J., Ackroyd, V.J., Armstrong, S.D., Asmita, G., Bagavathiannan, M.V., Balkcom, K.S., Basche, A., Beam, S., Bradley, K., Canisares, L.P., Darby, H., Davis, A.S., Devkota, P., Dick, W.A., Evans, J.A., Everman, W.J., de Almeida, T.F., Flessner, M.L., Fultz, L.M., Gailans, S., Hashemi, M., Haymaker, J., Helmers, M.J., Jordan, N., Kaspar, T.C., Ketterings, Q.M., Kladivko, E., Kravchenko, A., Law, E.P., Lazaro, L., Leon, R.G., Liebert, J., Lindquist, J., Loria, K., McVane, J.M., Miller, J.O., Mulvaney, M.J., Nkongolo, N.V., Norsworthy, J.K., Parajuli, B., Pelzer, C., Peterson, C., Poffenbarger, H., Poudel, P., Reiter, M.S., Ruark, M., Ryan, M.R., Samuelson, S., Sawyer, J.E., Seehaver, S., Shergill, L.S., Upadhyaya, Y.R., VanGessel, M., Waggoner, A.L., Wallace, J.M., Wells, S., White, C., Wolters, B., Woodley, A., Ye, R., Youngerman, E., Needelman, B.A., Mirsky, S.B., 2024. U.S. cereal rye winter cover crop growth database. Sci. Data 11, 200. https://doi.org/10.1038/s41597-024-02996-9
Klopp, H.W., 2024. Effects of Interseeding Cover Crops into Corn and Soybean on Biomass Production, Grain Yields and Ecosystem Services: A Review. Agronomy 14, 1229. https://doi.org/10.3390/agronomy14061229
Kristensen, H.L., Thorup-Kristensen, K., 2004. Root Growth and Nitrate Uptake of Three Different Catch Crops in Deep Soil Layers. Soil Sci. Soc. Am. J. 68, 529–537. https://doi.org/10.2136/sssaj2004.5290
Ma, L., Shi, L., Wang, S., Wang, K., Zheng, W., Li, Z., Zhai, B., 2022. 15N labelling of cattle manure reveals the distribution of organic fertiliser nitrogen in a winter wheat system. Field Crops Res. 283, 108529. https://doi.org/10.1016/J.FCR.2022.108529
Malone, L.C., Mourtzinis, S., Gaska, J.M., Lauer, J.G., Ruark, M.D., Conley, S.P., 2022. Cover crops in a Wisconsin annual cropping system: Feasibility and yield effects. Agron. J. 114, 1052–1067. https://doi.org/10.1002/agj2.21029
Roth, R.T., Lacey, C.G., Camberato, J.J., Armstrong, S.D., 2023. Quantifying the fate of nitrogen from cereal rye root and shoot biomass using 15N. Nutr. Cycl. Agroecosystems 125, 219–234. https://doi.org/10.1007/s10705-022-10213-5
Shen, B., Zheng, L., Zheng, X., Yang, Y., Xiao, D., Wang, Y., Sheng, Z., Ai, B., 2024. Insights from meta-analysis on carbon to nitrogen ratios in aerobic composting of agricultural residues. Bioresour. Technol. 413, 131416. https://doi.org/10.1016/j.biortech.2024.131416
Shtangeeva, I., Steinnes, E., Lierhagen, S., 2011. Macronutrients and trace elements in rye and wheat: Similarities and differences in uptake and relationships between elements. Environ. Exp. Bot. 70, 259–265. https://doi.org/10.1016/j.envexpbot.2010.09.013
Wallander, S., Smith, D., Bowman, M., Claassen, R., n.d. Cover Crop Trends, Programs, and Practices in the United States.
Zhang, S., 2019. Heterogeneity of Soil Nutrients: A Review of Methodology, Variability and Impact Factors. J. Environ. Earth Sci. 1, 6–28. https://doi.org/10.30564/jees.v1i1.526
Educational & Outreach Activities
Participation summary:
Outreach efforts included extension, academic, and other agricultural professional audiences. Research findings were shared at with audiences at the Professional Dairy Producers Business Conference and on their podcast series, “The Dairy Signal”. Additionally, research findings were shared at the University of Wisconsin Dairy Innovation Hub Symposium, The North Central Soil Fertility Conference, departmental seminars, and UW field days. Other project outreach and education to agricultural industry professionals included invited presentations at the UW Board of Visitors Sustainability Panel, dairy cooperative board group field day tours, and extension webinars. This work will also be published as a public dissertation, and one journal article is in preparation for submission. Results from this project will be continually presented via extension platforms.
Our original outreach plan was to survey farmers and crop consultants at extension events regarding cover crop implementation as a result of this research. However, due to substantial delays in receiving laboratory analyses, as well as the fact that the field trial ended in May in 2025, we have not had enough time to completely analyze the second year of data in a way to present to farmers and crop consultants. We plan to continue presenting our research findings on this project during extension events in 2026. We anticipate achieving our outreach goals of this study over the next 18 months.
This project and results have been presented at:
- FarmFirst Dairy Co-op board presentation, July 2023, "Soil health and dairy production systems", (part of a bigger research tour organized by the Dairy Innovation Hub).
- UW-CALS Board of Visitors Sustainability Panel, October 2023, "Sustainability and Dairy Production", (the Board of Visitors committee), an invited presentation by the UW-CALS Associate Dean of Research
- Professional Dairy Producers of Producers Business meeting, March 2024, "Cover Crops and Manure - Partners in Conservation"
- Dairy Signal (podcast of the Professional Dairy Producers of Wisconsin), October 2023, "Soil Health and Dairy Production"
- UW-Madison, Department of Soil Science seminar, Nitrogen management and dairy production, (October 4th, 2023)
- Badger Crop & Soil updates, November 30 & December 2023, "Soil Health and On-Farm Trials"
- Arlington Soil & Agronomy Field Day, August 2023, "Cover Crops...Like Tech But Better"
- Global Conversations webinar (sponsored by CALS Global), February 2024, "Production vs. Conservation in the Dairy State"
- Ag Source Conference, March 2024, "Soil Health and Dairy Production"
- Foremost Farms/UW-CALS board presentation (July 2024) “Interdisciplinary Research and Soil Conservation”, invited presentation, (part of a bigger research tour organized by UW-CALS and Dairy Innovation Hub).
- North Central Soil Fertility Conference, November 2024, "A Direct Approach to Measure Cover Crop Nitrogen Uptake from Dairy Manure via 15N Enrichment"
- Dairy Innovation Hub Symposium, May 2025, "A Direct Approach to Measure Cover Crop Nitrogen Uptake from Dairy Manure via 15N Enrichment
Project Outcomes
The research made possible by the SARE graduate student grant program has supplied new opportunities to improve agricultural sustainability in Wisconsin and the greater North Central region.
Short-Term Outcomes: We addressed an immediate producer-focused question of how much manure vs. soil N are cover crops taking up and how that could be influenced by cover crop selection. This project also contributes to a greater body of research targeting the reduction of N leaching into groundwater and improving on-farm N use efficiency and paves the way for future isotopic studies to trace manure and cover crop N fate into preceding cash crops.
Medium-Term Outcomes: Results of this study will directly serve to improve recommendations and producer confidence in practice adoption. This project has a direct impact on how producers, researchers, and other agricultural professionals consider the integration of cover crops of fall manure applications to manage N in integrated systems.
Long-Term Outcomes: Our work will positively contribute to environmental and economic outcomes at a local and regional level. Our work will serve to support an overall improvement in groundwater quality across Wisconsin and the North Central US. Likewise, these results complement existing efforts in further improving manure nitrogen use efficiency and crediting in dairy production systems. Together these outcomes contribute to agricultural sustainability and SARE’s mission to support economically viable and environmentally sound systems that strengthen communities.
Over the duration of this project, we improved our understanding of manure N fate when cover crops are integrated. By directly quantifying manure N in the plant-soil system, we have a better understanding of how cover crop selection and establishment timing affect manure N uptake across years. We found that rye and wheat both served as effective N scavengers, taking environmentally relevant amounts of N prior to termination (27-53 kg N ha-1). Interestingly, rye consistently had greater manure N uptake than wheat across study years, however the greater N content of wheat supported greater total N uptake with less biomass. Ultimately this information can be used to help guide future manure N crediting recommendations, particularly when fall manure is applied with cover crops. Our work emphasizes the challenges of both interannual variability and relatively short fall establishment periods North Central region producers may face using cover crops to achieve manure N loss reduction goals. Overall, we gained new insight which will help improve cover crop and manure recommendations, which in turn may serve to improve regional practice adoption.