Final report for GNE16-135
Project Information
I started objectives 1 and 2 over the summer of 2016, including collecting soils from farmer-collaborators, and setting up first year of the manure experiment and collecting predator and plant damage data for objective 2. For objective 1, I set up 2 experiments to examine the effects of microbial community from different soils on herbivore performance. Through this experiment, we determined that sterilizing soils using steam treatments changed the nutrient content of the soil. We were unable to determine if effects on plant growth and herbivore performance were due to nutrient differences or the microbial community in the soil. Because of this, in 2017, we adjusted methods to better sterilize soils by using a filtration technique to separate microbial communities. When we applied this method to manipulate microbial communities, we found no differences between soils with and without microbial communities, and decided to focus on Objective 2 for the 2017 field season. Objective 2 was started in June 2016, earlier than anticipated to have another year of data. In 2016, 2017 and 2018 we collected predator community, early season pest damage data, herbivore performance data on pre-reproductive corn and silage yield data. We have also adjusted objective 2 by adding a cover crop treatment in addition to the manure treatment in a factorial design to isolate the effects of manure and cover crops on organic matter accumulation and soil health on insect pests/predator communities. This cover crop was planted in October 2016, and thus was one of the treatments in 2017. In addition, we have also measured sentinel predation rates in 2017 and 2018 to understand how changes in predator community affects biological control. Additionally, in 2018 we measured the mesofauna community in the soil to estimate alternative prey resources for predators that may support greater predator abundances. Overall, we have found that manure increased plant damage, especially by slugs, but a greenhouse test revealed that some species of caterpillar (Agrotis ipsilon) performed worse on plants fertilized with manure compared to inorganic fertilizer. Predator abundances and sentinel prey were not higher in manure-fertilized or cover cropped plots, contrary to our expectations, indicating that manure may not have as strong effects in no-till as previously suggested. Alternatively, longer term manure fertilization or larger plots are necessary to detect effects. Further, in years where slugs are abundant, manure and cover crops can exacerbate invertebrate damage.
In PA, most dairy farmers use manure as fertilizer for growing feed, and there are clear benefits to doing so. For example, integrating animals and their waste into field-crop production decreases costs of nutrients, diversifies farm revenue, and helps build healthy soils (Litterick et al., 2004; United States Department of Agriculture, 2015). Moreover, long-term application of manure can increase soil organic matter, microbial activity, and even improve micronutrients in plant tissues (Rengel et al., 1999; Edmeades, 2003; Bhattacharyya et al., 2007). Notably, elevated microbial activity and greater levels of micronutrients in manured soils may help plants better resist some insect herbivores (Phelan et al., 1995; Alyokhin et al., 2005; Murrell & Cullen, 2014; Murrell et al., 2015). However, while manure is abundant and inexpensive, farmers face challenges from over-fertilizing with manure. Manure is high in phosphorus relative to plant needs, and an overload of manure can lead to increased chances of runoff or even detrimental algal blooms in local waterways and downstream in the Chesapeake Bay.
Fertilizer type may influence insect communities. Most producers use inorganic fertilizer containing the three critical plant nutrients: nitrogen, phosphorus and potassium. Manure also contains these nutrients, but also contains organic matter and micronutrients that are uncommon in most inorganic fertilizers. Nutrient ratios in leaves can alter plant defenses against herbivory (Phelan, 1997; Alyokhin et al., 2005). Manure can also help build communities of beneficial soil microorganisms that may alter uptake of nutrients and influence plant defenses against herbivores (Gosling et al., 2006; Lugtenberg & Kamilova, 2009; Barber et al., 2013b; Murrell et al., 2015).
To conserve soil and nutrients, no-till has been adopted to reduce erosion and nutrient loss in into waterways. However, no-till does not allow manure to be incorporated into the soil, leaving it on the soil surface, and changing the potential benefits for predators and pest management in PA and the northeastern United States. Further, these no-till systems are particularly vulnerable to early season pests such as slugs, seed corn maggots, and noctuid caterpillars. While comparisons between manure and inorganic fertilizers on pest abundance and performance have largely found that manure decreases abundance or performance of herbivores (Rowen et al. submitted), the unique conditions in no-till corn may decrease the benefits of manure on plant susceptibility. Ground-dwelling predators are also increased by manure application, for example, carabids are often higher in manure treatments, as are ground-dwelling spiders (Rowen et al. submitted).These predators are often important natural enemies in no-till corn systems, and measuring how un-incorporated manure can influence these predator will provide critical insight into biological control of no-till pests in manure-fertilized corn.
Manure is often used in conjunction with cover crops to retain nutrients. Cover crops generally reduce pest populations (Halaj et al., 2000; Teasdale et al., 2002; Koch et al., 2012), but this effect is inconsistent and depends on herbivore and cover crop species (Willson & Eisley, 1992; Willson & Stinner, 1994; Showers, 1997; Tillman et al., 2004). The influence of cover crops on herbivores may be due to changes in host plant quality or predator communities (Lundgren & Fergen, 2010). Cover crops more directly affect nutrient dynamics in soil, which may in turn affect nutrient-plant-insect interactions. Cover crops can increase and retain soil nitrogen relative to non-cover cropped fields (McCracken et al., 1994; Clark et al., 1998; Drinkwater et al., 1998; Tonitto et al., 2006; Grabber & Jokela, 2013). Nitrogen has a strong effect on herbivores, both by increasing plant nutritional value and simultaneously increasing plant defenses (Mattson, 1980; Waring & Cobb, 1992; Butler et al., 2012). Cover crops can also influence phosphorus (Sharpley & Smith, 1991; Kamh et al., 1999; Kleinman et al., 2005; Grabber & Jokela, 2013), which generally has a positive effect on herbivore growth (Hunter et al., 1991; Waring & Cobb, 1992; Janssen, 1994; Chen et al., 2004, p. 20; Huberty & Denno, 2006; Apple et al., 2009). Microbes like AMF are promoted by cover crops (Galvez et al., 1995; Boswell et al., 1998; Kabir & Koide, 2002; Deguchi et al., 2007; White & Weil, 2010), and may increase nutrient availability and plant defenses (Gange & West, 1994; Bi et al., 2007; Deguchi et al., 2007; Vannette & Hunter, 2009; White & Weil, 2010; Jung et al., 2012; Barber et al., 2013a). If cover crops foster AMF, they have potential for improving plant resistance to herbivores. Retaining nutrients and increasing AMF colonization with cover crops may increase nutrient densities in crop tissue and even change plant quality for herbivore growth, thus affecting pest damage in cover-cropped plots fertilized with manure or inorganic fertilizers.
Lowered pest densities may also be driven by increased biological control. Predators, especially ground beetles (Carabidae) are conserved by use of cover crops. Predators communities are more abundant and more diverse (Carmona & Landis, 1999; Lundgren & Fergen, 2010), perhaps as a result of greater residue and predator refuge in fields (Bryant et al., 2013). Cover crops help augment detritivores and alternative prey resources for predators (Lundgren & Fergen, 2010). Entomopathogens in the soil can also increase with cover crops (fungal: (Jabbour & Barbercheck, 2009)); nematodes: (Jaffuel et al., 2017)), perhaps because of lower disturbance and increased opportunity for plant-associations.
How manure and cover crops interact to affect pest populations is still unclear, particularly in no-till corn systems, despite the clear potential benefits of both manure and cover crops. Here, we examine the combined influence of manure fertilizer and a wheat cover crop on pest outbreaks in no-till corn. We assessed the relative importance of bottom-up and top-down effects of plant quality and predator populations in a factorial field experiment and examined the effect of manure on plant quality in complementary a greenhouse experiment. We hypothesize that manure increases plant resistance to invertebrate pests, perhaps through increased access to micronutrients. We also hypothesize that wheat cover crops will help retain nutrients and organic matter, and should decrease herbivore damage. Finally, both manure and wheat cover crops increased epigeal predator populations, particularly carabid beetles because they increase refuge availability and alternative prey resources. We hypothesize that this results in higher predation rates of sentinel prey (and pests
Cooperators
Research
OBJ 1 Methods:
Soil collection
Soils were collected at 4 paired farms in OH and PA in March and April of 2016. We collected soils from a farm practicing long term no-till and cover cropping and a nearby conventional farm on the same soil type. Each field was sampled at 15 points along a zigzag transect using a shovel. Four soils were collected from OH on paired farms on March 25, 2016. Soil DB1 was collected from a conventionally managed field. Soil DB2 was from a field that had been in no-till management for 45 years and was planted with a diverse cover crop mixture including rye, pearl millet, winter peas, cowpeas, sunn hemp, radishes, Ethiopian cabbage, rape and flax. Soil DB3 had been in no-till management for 3 years and was also planted with the diverse cover mixture. Soil DB4 was had been in no-till for 3 years and was planted with a rye cover crop. In PA, we collected soils from a pair of farms on April 25, 2016. The 'soil health' soil, JH1, had been in no till for 40 to 50 years and were planted with a rye cover crop. Soil JH2 was from a neighboring conventional farm which was tilled and had not been planted with a cover crop. Soils were sieved with a 1 cm sieve and stored at 4˚C.
Soil characteristics
Soils were sent to the Pennsylvania State University Agricultural Analytical Service Laboratory (PSU AASL) for nutrient and organic matter testing. Soils were also sent to the Wood’s End Laboratory for soil health testing. We also tested the organic matter, aggregate stability, soil burst respiration, soil protein content, active carbon, nutrients and soil texture at the Cornell Soil Health Testing Laboratory.
Feeding assay with steam sterilized soils
The goal of this project was to determine how microbial communities in the soil influence plant susceptibility to herbivores. To manipulate the presence of microbes in each soil, we steam sterilized soils and compared plants grown in sterilized soil to plants grown in un-sterilized soils. To sterilize each soil, they were placed in perforated plastic bags and steamed for an hour, allowed to cool and sterilized again 24h later to account for microbes that may have survived the initial sterilization. All soils were then mixed 1:1 with play sand. Corn seeds (TA466) were surface sterilized for 30 mins using a 10% bleach solution and planted into these soils. Plants were allowed to grow for 5 weeks. Once the majority of the plants reached the 4-leaf stage, 4th instar black cutworms (Agrotis ipsilon) were allowed to feed in 5 cm plastic clip cages that were moved every two days to ensure a continuous supply of food. These larvae were allowed to feed for 6 days before they were weighed. Leaf damage was estimated by scanning leaves and counting the number of 5x5mm squares were consumed. This experiment was first performed July 2016 with all collected soils, and was repeated September 2016 with only JH1 and JH2. Plant size was measured in September by measuring height to the last leaf collar from the soil surface.
Feeding assay with soils slurries
Steam sterilization of the soils increased phosphorus availability and decreased organic matter content of the soils (PSU AASL test). To isolate the effect of microbes from changes in nutrient content, we performed the same feeding assay with JH1 and JH2, but used microbial slurries to manipulate the microbial community. Microbes were extracted from the soil by shaking sieved soil (2mm sieve) for 1 hour with half concentration Hoagland solution made using sterile DI water. These were allowed to settle for 1 hour and the liquid was centrifuged for 15 mins at 4000 rpm to separate soil particles from the microbial slurry. To account for the increased nutrient content from the microbial slurry for the no-microbe treatment, the slurry was passed through a 22µm vacuum filter. These filtered and unfiltered slurries were applied to steam sterilized soils. Sterilized corn seeds were planted into these soils in January 2017. Slurries were applied every week for 5 weeks. The feeding assay was performed as before.
OBJ 2 Methods:
Greenhouse experiment
Plants were grown in the greenhouse in potting soil (promix with mycorrhizae: Rockwall, Texas). Corn seeds (TA seeds variety 466, Jersey Shore, PA) were planted on 4/11/2018). After 8d, seedlings were fertilized with 7.9 g fresh manure (approximately 26.5 mg N/pot, 12 mg P2o5/pot, 25 mg K2O /pot), or the equivalent amount of inorganic fertilizers inorganic fertilizers using calcium nitrate (15.5% N), triple super phosphate (45% P2O5), and potash (60% K2O) in 100mL of water. After 5 weeks, we allowed 3rd instar fall armyworm (Spodoptera littoralis) or black cutworm (Agrotis ipsilon), that had been fed with corn for 3 days, to feed on experimental corn plants in clip cages. These caterpillars were allowed to feed in clip cages for 6 days, and clip cages were moved every 2 days to ensure a continual supply of leaf tissue. At six days, caterpillars were weighed. Leaf damage was assessed by scanning damaged leaves, and calculating the missing tissue using ImageJ. All corn plants were harvested and dried at 55C, and sent to the Penn State Agricultural Analytics Laboratory for elemental nutrient quantification. This experiment was repeated in June 2018, when we fertilized seeds with 11.8 grams of fresh fertilizer, (approximately 53.1 mg N/pot, 24.8 P2O5/pot , 31.9 K mg/pot) and the equivalent amount of NPK. After 5 weeks, caterpillars (both FAW and BCW) were allowed to feed for 24 hours, and then leaf tissue was collected for defensive protein quantification. Some caterpillars were allowed to feed for 6d and tissue from these plants was used to quantify total protein content.
To measure defensive protein activity from June 2018, tissue from each plant sample was ground on liquid nitrogen, and homogenized in 1.25 ml of room temperature K-phosphate buffer (0.1M, pH 7) containing 7% (w/v) polyvinylpolyprolidine. For the analysis of PPO activity, 50µL of the supernatant was added to 250 µl of 29.2mM caffeic acid in K-phosphate buffer (0.1M, pH 8). For the analysis of POD activity, 30µl of the supernatant was added to 270 µl of 0.3% guaiacol and 0.1% H2O2 in K-phosphate buffer (0.1M, pH 8). PPO and POD activities were determined by measuring change in absorbance at 470nm over 10 minutes. Activities are presented as change in optical density per minute per gram of fresh weight. To measure the inhibition of the hydrolysis of an artificial substrate by commercial trypsin through endogenous PIs, 60 µl of supernatant were added to 20µl of Tris buffer (50mM, pH7.8), 50µl of a substrate (2% azocasein), and 20µl of trypsin (0.1mM) in 1mM HCl. A set of controls (i) without trypsin, (ii) without plant protein extract, and (iii) without plant extract and trypsin were prepared using the same procedure. These assays incubated at 20ºC for 10 minutes. The reaction was stopped with 10% trichloracetate (TCA), which denatured the substrate. One-hundred µl of NaOH was added to 100 µl of supernatant from each assay. Absorbance was measured at 450nm. Inhibition was calculated as one minus the percent ratio of sample to lowest sample absorbance. Total protein content was calculating using a bradford assay on supernantant in K-phosphate buffer, and used to standardize activity of PPOs, PODs and PIs.
To quantify total protein content of corn plants, 25mg of dried tissue was added to 600µL of a sample buffer containing 35% Tris buffer (6.8), 1.5 g sodium dodecyl sulfate, 44% glycerol, 17.5% ß-mercaptoethanol (5%v/v), and a protease inhibitor cocktail (sigma P9599). These were vorexed for 10 seconds to mix tissue and sample buffer. Samples were incubated for 8 mins at 100C, and then centrifuged at max speed for 115 mins at room temperature. We quantified proteins in 10µL of supernatant using a non-interfering protein quantification kit (G-Biosceinces, cat # 786-005).
Field experiment – Set-up
On a 1-acre site at the Penn State research farm, the Russell E. Larson Agricultural Research Center, manure was applied in 2016 at a rate of 13.1 ton/ acre on 5/27/2016. The total available NPK from this manure was calculated using conversions from the Penn State Agronomy Guide and is reported in Table 1. An equivalent amount of 10:30:10 starter fertilizer inorganic NPK was applied at planting. Corn (Master’s Choice, variety MC5250) was planting at a population of 30,000 seeds/acre in 30 in rows. Each plot measured 50 by 100 ft, and each treatment was replicated 4 times.
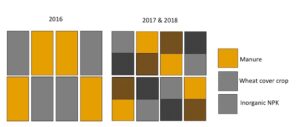
Fig 1: Plot map for experimental set up. In 2016, plots did not have a cover crop treatment, but they did in 2017 and 2018.
In the same field in 2017, a cover crop of winter wheat was planted 10/19/2016, treated with Chlorpyrifos methyl and Cyfuthrin insecticides (Strocides) in split-split plots in the previously manure or inorganic fertilizer plots. There were 4 plots/plot, and 16 plots total. We applied manure at a rate of 13.1 tons on 5/23/2017. The same variety of corn as in 2016 was again planted at the same 30,000 seed/acre rate. Manure was collected after application on 6/9/2017, and the available NPK are reported in Table 1. Inorganic fertilizer were applied at planting at a rate of 150 lbs/acre of MicroEssentials 12-40 – 0 10S 1Zn, and further inorganic fertilizer was applied on 7/12/2017 to match available nutrients in manure treatments We applied 421lbs/acre of 19:19:19 NPK to the rows by hand. We weighed out the amount of fertilizer required in 2 rows/plot and applied it evenly to the roots of the plants in the row.
Table 1: Fertilizer rates, available NPK, planting dates and seed varieties for field experiment 2016-2018
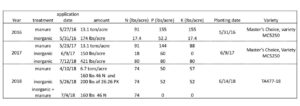
A winter wheat cover crop for 2018 was planted on 11/29/2017. Manure was applied at a rate of 6.7 tons/acre on 4/10/2018. Inorganic fertilizer (160 lbs of 46N and 200 lbs 0:26:26 PK) was applied at planting. The variety of corn planted was TA477-18 from TA seeds (Jersey Shore, PA). Because there was too little nitrogen in the manure for a season of corn growth, 74 lbs/acre inorganic nitrogen was applied to both the manure and inorganic plots on 7/4/2018.
Field experiment – Soil nutrient content
In 2017 and 2018, plots were subsampled nine times using an oakfield soil corer (2cm in diameter) to a depth of 20cm and homogenized on 5/10/2017 and 5/9/2018. These were submitted to the PSU AASL for standard nutrient analysis and organic matter content.
Field experiment - Vegetative biomass and soil residue
To assess the weed cover and cover crop establishment under each treatment, we collected wheat cover crop and weed above-ground biomass in two 0.25 m2 randomly placed quadrats in each plot and took photographs to assess percent vegetative cover using imageJ. Weed and cover-crop biomass was assessed separately. Samples were dried in a drying oven at 60˚C for 4 days, and weighed. We assessed vegetative cover on May 14 in 2017 and May 11 in 2018. Dead organic materials that may serve as a food source for decomposer community and refuge to predators was quantified on July 19, 2018. All organic matter on soil surface was collected in two locations from 0.25 m2 randomly placed quadrats in each plot, dried and weighed.
Field experiment – Early season insect damage
Early season invertebrate damage was assessed in all three years of the experiment. Damaged was assessed in 5ft sections in each plot at V3-4 (approximately 3.5 weeks after planting). Damage was categorized on an ordinal scale where 0 was no damage, 1 was ~1-10% leaf area gone, 2 was 10-25% damage, 3 was 25% - 50% damage and 4 was >50% leaf area gone. Identity of damage was also appraised (particularly slug damage). Stand was assessed as well at this time by counting the number of plants in row six of each plot. In 2016, damaged was assessed in 4 locations in each plot on (6/24/2017). In 2017 and 2018, damaged was assessed in 2 location in each plot on 6/29/2017 and 7/4/2018.
Field experiment – Feeding assays with field collected tissue
In 2018, leaf tissue was collected from the field on 8/16/2018. Leaves above the developing ear were collected from every 5th plant in row 12. These were sterilized by dipping in 80% ethanol and rolled into a 1 oz diet cup containing a plaster base. Cups were covered with a perforated lid. A few milliliters of water were added to each diet cup plaster base to maintain humidity for the leaf tissue. Second instar fall armyworm caterpillars were added to each cup and allowed to feed for 5 days. Caterpillars were weighed at the end of 5 days. Because scale was not sensitive enough to accurately weigh smaller caterpillars, data were analyzed using a tobit model that accounted for truncated data.
Field experiment – Mesofauna
To determine if alternate prey resources increased with cover-cropped or manure fertilized plots, mesofauna from soil samples were collected 6/7/2018 (10cm yard butler, 5 points/plot), and subsampled. Mesofauna were extracted by Berlese funnels for 5 days. Mesofauna samples identified, and stored in 100% ethanol.
Field experiment – Epigeal predator activity-density
Epigeal predator activity was monitored using pitfall traps for all three years of the experiment. Pitfall traps were constructed from 1-quart deli containers, dug into the soil surface so they were level with the soil, filled with 1/4 cup of 50% propylene glycol, and covered by an elevated plastic plate that served as a rain cover. Pitfall traps were collected after 48 hours. Pitfall traps were opened once a month June-September, except in 2017, when trapping started in July. In 2016, there were 3 pitfalls/plot (rows 5, 10, and 15). In 2017 and 2018, we only used 2 pitfalls/plot (in rows 5 and 10). We counted the following groups wolf spiders and other spiders, millipedes, centipedes, harvestmen, ants, rove beetles, carabids beetles, and other beetles. Carabid beetles were identified to species where possible.
Field experiment – Sentinel Predation
Predation rates were assessed using sentinel prey wax worms (Galleria mellonella). Two late instar wax worms were deployed in 3 cages/plot once a month in 2017 and 2018 immediately following pitfall trapping in each of 3 cages were put out in each plot and assessed for predation after 24 hours.
Field experiment – Yield
Silage yield was measured by harvesting the center 2 rows of each plot. Total yield was calculated based on weight of center rows, adjusted by moisture content. Subsamples of each plot were dried in drying oven at 55C for 1 week and weighed to determine moisture content. Plots were harvested on Sept 19 in 2016, Oct 13 in 2017, and Oct 5 in 2018.
OBJ 1
Soil characteristics
Results of soil nutrient and health tests are reported in Table 2. Phosphorus content of soil was much higher in PA soils (JH1 and JH2) compared to OH soils. Solvita and Cornell soil health tests rank soils in almost the same way, and seem to be very closely related to the organic matter content of the soil.

Feeding assay with steam sterilized soils
The conventional soil DB1 did not support plant growth, and data are not included in any analyses. OH no-till soils DB2-DB4 had equivalent caterpillar growth (Fig 2; F=0.19, P=0.83) and none were affected by steam sterilization (F=0.94, P=0.34).

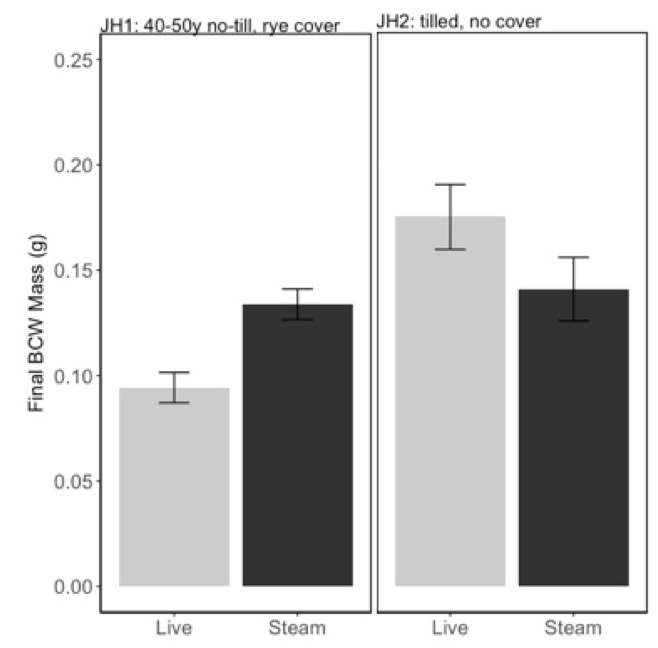
We analyzed both July and September experiments of PA soils, JH1 and JH2, together since there was no effect of date alone on BCW final weight (F=0.02, P=0.88). We found that steam sterilizing the “soil health” soil (JH1) increased BCW performance, while steam sterilizing the “conventional” soil (JH2) decreased BCW performance (Fig 3; interaction between soil and steaming: F=10.25, P=0.003). We hypothesize that some difference in the microbial communities in the soil health and conventional soils were responsible for this change in caterpillar performance.
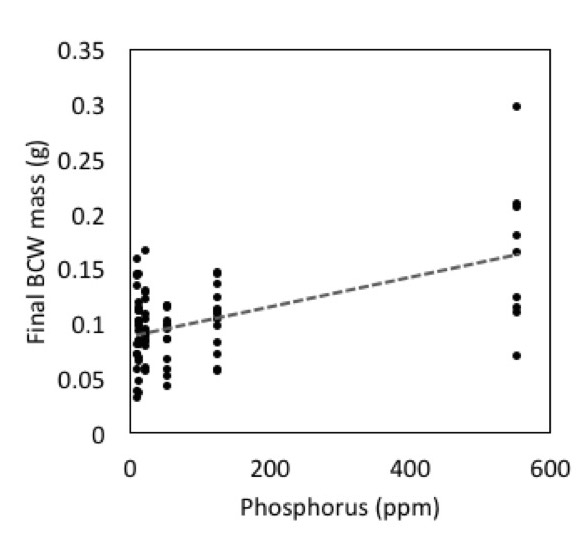
In addition to the potential role for microbes in caterpillar performance, we observed a strong effect of phosphorus on BCW performance (Fig 4; Adj R2=0.62, F2,42=37.09, P<0.001). Phosphorus was the best predictor variable in model selection, with initial larval weight as a covariate. This is particularly problematic because steam sterilizing soils consistently increased the phosphorus content of the soils.
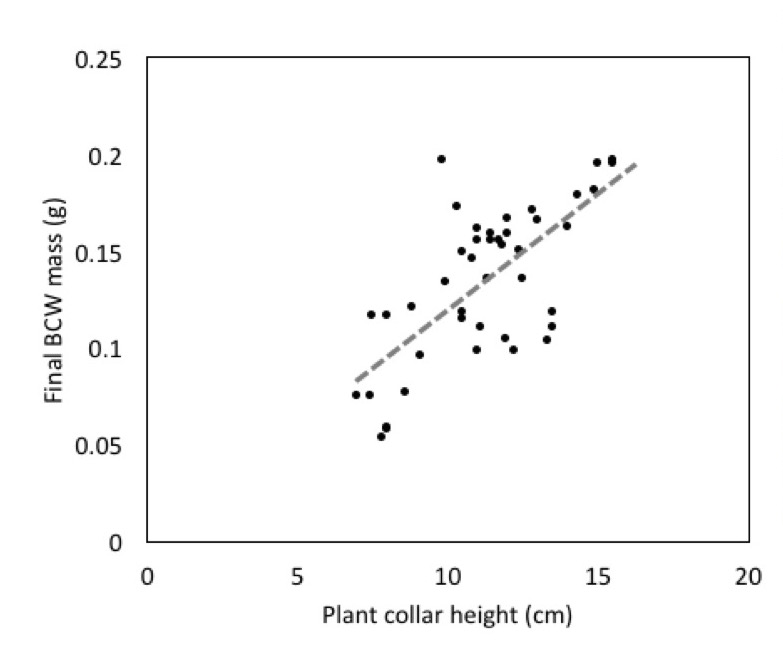
We also found a strong effect of plant height on final caterpillar weight, when initial larval weight is included as covariate (Fig 5; Adj R2=0.54, F2,13=9.667, P=0.003). This suggests an important link between the health of the plant and herbivore performance. Herbivore growth can be limited by plant nutritional quality and many herbivores benefit from fast growing plants (Price 1991).
Feeding assay with soils slurries
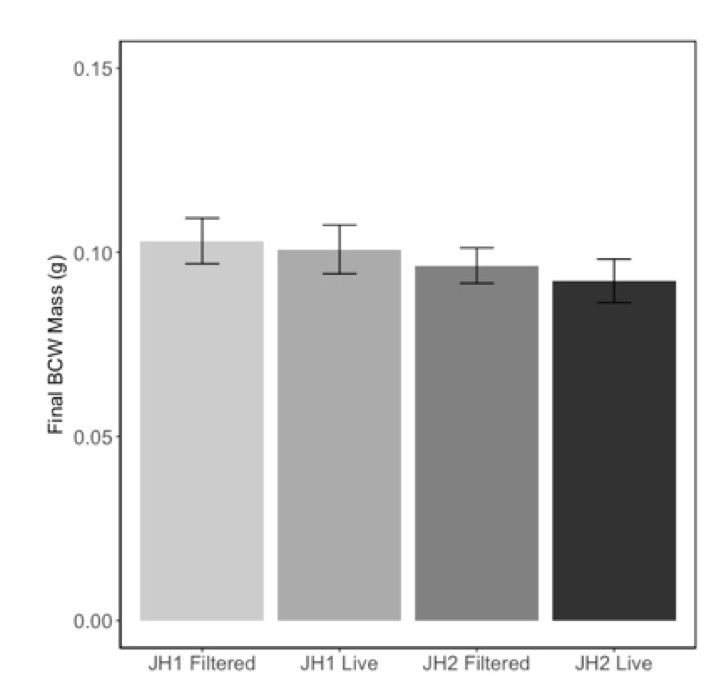
Because of the confounding effects of nutrients and microbial content of the soils, we manipulated the soil microbial communities by re-introducing microbes from a slurry to steam sterilized soils. This method allowed us to maintain a consistent nutritional content of the soil but change the microbial community. In contrast to our previous experiments, we found that herbivore performance was not affected by the presence of microbes from the slurry (Fig 6; F=0.30, P=0.58), nor did we see any differences in caterpillar performance on these soils (F=1.41, P=0.24). These results suggest that either the microbial community in the slurry did not colonize the soil and roots of their treatments, or the effects we saw in the previous experiments were caused by changes in the nutrient content of the soils were not due to microbes.
OBJ 2 Results
Greenhouse experiment
Fall armyworm caterpillars were affected by feeding on manure-fertilized plants in the first 24h (ANCOVA; F2,10=70.46, P<0.0001: initial weight: P<0.0001, Fertilizer: P = 0.02; FIGURE 7A), but this effect disappeared after 6d of feeding once the caterpillars aged (ANCOVA F2,25=0.44, P=0.640; initial weight: P = 0.36, Fertilizer: P = 0.95; FIGURE 7B). Black cutworm caterpillars were negatively affected by manure at 24h (ANCOVA F2,5=15.00, P=0.007 : initial weight : P = 0.007, Fertilizer: P = 0.02; FIGURE 7C), and 6d (ANCOVA F2,16=7.0, P=0.0065 : initial weight : P = 0.12, Fertilizer: P = 0.004; FIGURE 7D). This indicates that, as expected, manure affects herbivore performance on corn plants, but only to more susceptible species and instar. Black cutworm and small fall armyworm were small when feeding on manure fertilized plants, but not later instar fall armyworms.
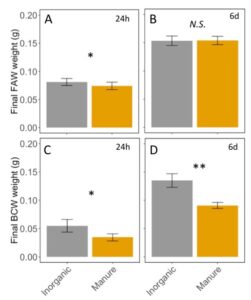
Fig 7: A. Fall army weight after 24h of feeding on inorganic or manure fertilized corn plants. B. Fall armyworm after feeding for 6 days on corn plants. C. Black cutworms weight after 24h of feeding. D. Black cutworm weight after 6 days of feeding on fertilized corn. Error bars represent SE. *: P<0.05, **: P < 0.01
Foliar elemental nutrient content was not different between treatments (MANOVA: F1,15=1.411, P=0.2534), except for boron, which increased by ~ 27% in manure treated plants (ANOVA: F1,16=5.49, P=0.032; FIGURE 8A). Boron has been associated with decreased herbivore performance (Beanland et al. 2003, Alyokhin et al. 2005), and deficiencies can increase accumulation of sugars and amino acids in leaf tissues (Ruuhola et al. 2011). Here, B levels were within established sufficiency ranges for corn (Penn State AASL), but the effect of variation in boron on herbivore performance is still unknown. The protein content was also not affected by fertilization type (ANOVA: F1,5=1.537; P=0.270; Figure 8B). Protein content of corn plants is here between 2 and 3 % of overall mass. While increased protein could increase herbivore performance, not all proteins are equivalent for herbivore growth. Proteins can also serve the plant as defenses, and be otherwise harder to digest than free amino acids (Price 1981). While here we report no differences between protein in manure and inorganic fertilized corn plants, these proteins may be qualitatively different for caterpillar growth.
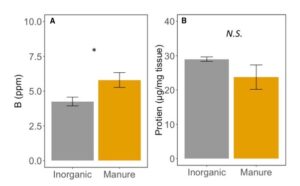
Fig 8. A. Boron content of leaves in corn fertilized with inorganic or manure fertilizer. B. Protein content of corn tissue fertilized with inorganic or manure fertilizer. Error bars represent SE. *: P<0.05
Defensive protein content was significantly affected by caterpillar and the interaction between caterpillar and fertilizer (MANOVA: F5,17 = 5.12, P = 0.005). Proteinase inhibition was significantly suppressed by FAW in inorganic fertilized plots, but unaffected by caterpillar species in manure fertilized plants (ANOVA: F5,17=6.896, P=0.001; Tukey HSD; FIGURE 9A). Polyphenol oxidase and peroxidase activity were induced by BCW in inorganically fertilized plots but not manure fertilization or by FAW (PPO: ANOVA: F5,17=2.768; P=0.05, Tukey HSD; FIGURE 9B, POD: ANOVA: F5,17= 3.347; P= 0.02, Tukey HSD; FIGURE 9C). This is contrary to our expectation that manure would have higher induction of defenses to reduce caterpillar growth, particularly BCW. Instead, FAW appears to inhibit induction of PIs, while BCW induces PPOs and PODs in inorganic fertilizer treatment, suggesting that manure may be interfering with induction of PPOs and PODs when damaged by BCW. Particular microbial taxa are known to interfere with defense signalling (Desurmont et al., 2016; Dicke, 2016). Manure may be promoting these strains in our greenhouse, although we did not identify the microbial community.
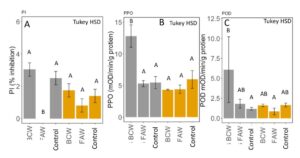
Fig 9. A. Percent inhibition of trypsin proteinase by proteinase inhibitors, B. polyphenol oxidase activity and C. peroxidase activity (change in optical density per minute per gram of leaf tissue) in corn tissue fertilized with inorganic (grey) or manure (yellow) when damaged with black cutworm (BCW), fall armyworm (FAW) and undamaged plants. Bars in each panel that share the same letter are not significantly different (means separation: Tukey HSD). Error bars represent SE.
Field experiment – Soil nutrient content
Fertilization with manure vs. inorganic fertilizer and cover cropping with winter wheat did not affect overall nutrient content of soil early in the season (MANOVA: F3,12= 0.59; P= 0.63). However, in both 2017 and 2018, potassium levels in the soil were higher in manure fertilized plots, regardless of cover cropping history (2017: ANOVA: F3,12= 3.68; P= 0.04, Fertilizer: P= 0.007; 2018: ANOVA F3,12= 3.80; P= 0.04, Fertilizer: P= 0.01; FIGURE 10A,B). In 2017, zinc levels in the soil were significantly higher in manure-fertilized plots compared in inorganically fertilized plots (ANOVA: F3,12= 2.44; P= 0.11, Fertilizer: P= 0.03). In 2018, Zn levels were abnormally high, with a mean of 8.2 ppm (range: 5.0–15.4 ppm), but not differences between treatments (ANOVA: F3,12= 0.03; P= 0.99, FIGURE 10 C,D). I suspect that samples were contaminated by Zn in sampling equipment.
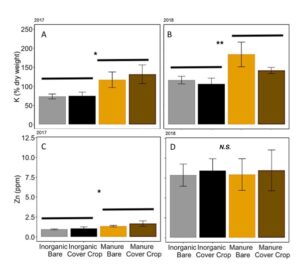
Fig 10. Potassium content in % dry weight of soil in (A) 2017 and (B) 2018. Zinc content of soil in ppm in (C) 2017 and (D) 2018. Error bars represent SE.
Field experiment – Vegetative biomass and soil residue
Manure increased the total biomass of vegetation on the plots in May in 2017 (ANOVA: F3,11=3.665, P=0.047; Fertilizer: P=0.048, Cover: P=0.06, Fertilizer*Cover: P = 0.21), especially when cover crops were planted (FIGURE 11A). Interestingly, biomass was only significantly higher with wheat cover cropped plots when they were fertilized with manure. In 2018, we found that wheat cover cropped plots significantly increased the total vegetative biomass (ANOVA: F3,11=8.219, P=0.003; Fertilizer: P=0.11, Cover: P=0.0007, Fertilizer*Cover: P = 0.28; FIGURE 11B). Again, when fertilized with manure had significantly more vegetative biomass than plots without planted cover crops. Because manure releases nutrients over the whole season, a previous years crop will not remove all nutrients before the cover crop is planted, allowing cover crops to have higher biomass in manure fertilized plots compared to inorganically fertilized plots.
Later in the season, when cover and weeds had died and corn was tasselling, residue on soil surface can support mesofauna populations that serve as alternative prey for predators, and support greater habitat complexity for these arthropod predators. We measured residue on the soil surface and found that there were not differences between our treatments (ANOVA: F3,12=1.78, P=0.20; Fertilizer: P=0.55; Cover P = 0.07; Fertilizer*Cover; P=0.34; FIGURE 12). Unexpectedly, we do not see higher residue in cover cropped plots, indicating that habitat and alternative prey benefits to predators from wheat cover and manure may be only seen early in the season, since the soil surface is similar in all four treatments by July.
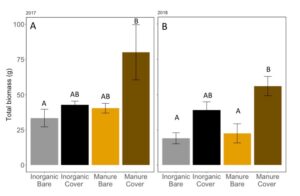
Fig 11: Average vegetative biomass in May (both weed and cover crop) of (A) 2017 and (B) 2018. Bars that share the same letter in each panel are not significantly different (Tukey HSD). Error bars represent SE.
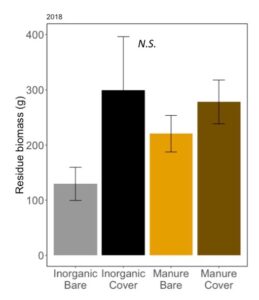
Fig 12: Average mass of residue on soil surface in July 2018. Error bars represent SE.
Field experiment – Early season insect damage
Damage caused by invertebrates at the V3–V4 stage of plant growth was only significantly different in treatments in 2017 (Ordinal regression: 2016: χ2 =2.45, P = 0.12; 2017:χ2 =69.5, P <0.001; 2018:χ2 =2.96, P = 0.30, FIGURE 13). In 2017, regardless of presence of cover crop, inorganic plots had lower damage, while bare manure had higher damage, and cover cropped manure plots had the highest level of damage (Fertilizer P=0.0001, Cover P = 0.65, Fertilizer*Cover P=0.07, Post-hoc test with Poisson GLM and Tukey HSD, FIGURE 13B).
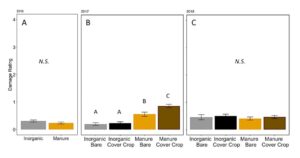
Fig 13. Corn damage rating from insects at V4 in (A) 2016, (B) 2017, and (C) 2018. Each year was analyzed separately. Bars that share letters are not significantly different (Tukey HSD, α = 0.05). Error bars represent SE.
The percent plants damaged by slugs in these damage assessments was not significantly affected by fertilizer or cover in 2016 or 2018 (2016: Poisson GLM, F1,6=0.4618, P = 0.5221; 2018: F2,12=0.77, P = 0.53, FIGURE 14A,C). In 2017, however, a particularly “slug-y” year, slugs damage significantly more plants in the manure fertilized plots than in the inorganically fertilized plots (Poisson GLM F2,12=6.75, P = 0.006, Fertilizer: P=0.002 FIGURE 14B). This is likely because of the build up of organic matter and residue on the soil surface in the manure plots, especially when a cover crop is also decomposing on the soil surface near corn plants. Slugs prefer these high moisture environments early in the season when corn plants are particularly vulnerable to damage (Douglas and Tooker 2012). However, despite over 50% of some treatments damaged by slugs in 2017, the total damage to the plant was still less than 10% leaf area removed (FIGURE 13B), and did not result in yield loss over all.
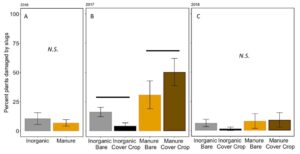
Fig 14. Percent of plants damaged by slugs at V4 in (A) 2016, (B) 2017, and (C) 2018. Each year was analyzed separately. . Lines over bars indicated groups that are significantly different. Error bars represent SE.
Damage by black cutworm was detected in all three years as well, although in 2016, only one plant (in the manure plot) had identifiable BCW damage (FIGURE 15A). In 2017, BCW damage was not significantly different between treatments (negative binomial GLM χ2=2.54, P=0.47. Fertilizer: P = 0.17, Cover: P = 0.39, Fertilizer*Cover P=0.64, FIGURE 15B). In 2018, BCW damage was higher in wheat cover cropped plots (negative binomial GLM:χ2=5.94, P=0.11; Fertilizer: P = 0.69, Cover: P = 0.004, Fertilizer*Cover P=0.80; FIGURE 15C). In our greenhouse experiment we found that BCW performed less well on manure fertilized plants. In the field, our 2018 data suggest that wheat cover crop might be more important. However, it should be noted that in 2018, we also had a high incidence of true armyworm damage in the cover cropped plots, and the damage may be hard to distinguish for younger instars.
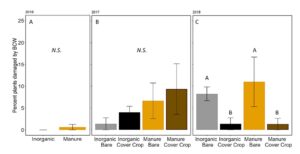
Fig 15. Percent of plants damaged by black cutworm at V4 in (A) 2016, (B) 2017, and (C) 2018. Each year was analyzed separately. Bars that share letters are not significantly different (Tukey HSD, α = 0.05). Error bars represent SE.
Field experiment – Feeding assays with field collected tissue
In 2018, tissue was collected from each plot, surface sterilized, and FAW neonates were allowed to feed for 7 days. Because caterpillars were still so small when final weights were taken, some caterpillars were too light to weigh, and their weight was recorded as 0.0. We used a Trobit model to account for truncated data. FAW weight after 7 days was higher in the inorganic plots compared to the manure plots (LogLike = -6.9663, P= 0.07298; Fertilizer: P = 0.023), while cover had no effect (P = 0.49; FIGURE 16A). Manure fertilization changed the mineral composition of these leaf tissues. Along a PCA axis that accounts for 18% of variation, manure was significantly different from inorganic fertilization (F3,42 = 16.82, P<0.0001; Fertilizer: P <0.0001, Cover : P = 0.28, Fertilizer*Cover: P = 0.24, FIGURE 16B). This axis is primarily composed of K, Mg, Mn, B, Zn and Ca (see Table 1). However, these PC2 does not correlate with changes in FAW caterpillar weight (F1,44 = 0.4526, P= 0.5046, FIGURE 16C). Only Al content of leaves is positively correlated with FAW caterpillar weight (LogLike = -67.6, Fertilizer: P = 0.03), but Al does not differ between manure and inorganic treatments (F3,42 = 1.20, P= 0.32), suggesting that the changes in FAW weight due to manure treatment are not due to differences Al, or elemental foliar nutrients. These results are consistent with our greenhouse results, but are not reflected in early season damage by herbivores. This indicates that, while manure decreases performance of lepidopteran larvae, particularly sensitive species and instars, damage to plants may be more a function of habitat and field history when herbivores present in high numbers. For example, slugs may be less sensitive to changes in plant quality, but need a moist, high organic matter habitat to thrive. True armyworm (Pseudaletia unipuncta), which we only found in 2018, is commonly a pest after a grassy cover crop such as wheat (Dunbar et al. 2016). Thus, plant quality may matter less in a homogeneous environment where herbivores have little choice besides feeding on crop regardless of the quality of the crop for herbivore growth.
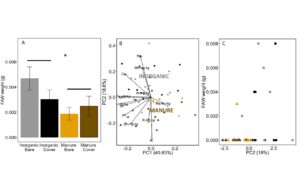
Fig 16. A. Fall armyworm final weight after feeding on field collected tissue from plots fertilized with inorganic or manure fertilizer and planted with a wheat cover crop or left bare. B. PCA analysis of foliar nutrient content in leaves fed to FAW neonates in A. Manure or inorganic centroids displayed over points. C. FAW weight vs. PC2, where PC2 is significantly different between manure and inorganically fertilized plants. In B and C, triangles represent manure fertilized plots, and circles represent inorganically fertilized plots. Darker colored shapes are cover cropped plots (dark brown = manure + cover and dark grey = inorganic + cover). Error bars represent SE.
Field experiment – Mesofauna
Early in the season, before corn was planted, but after the cover crops were terminated, neither collembola nor total mites were significantly affected by wheat cover or fertilizer type (collembola: negative binomial GLM χ2=1.82, P=0.61. Fertilizer: P = 0.27, Cover: P = 0.63, Fertilizer*Cover P=0.46, FIGURE 17A; mites: ANOVA F3,12=0.54, P=0.66; Fertilizer: P=0.25 Cover: P=0.85; Fertilizer*Cover: P=0.71; FIGURE 17B). Total cover on the plots in May does not correlate with mesofauna density in June (Collembola: χ2=0.0001, P=0.99; Mites: F1,14=0.12; P=0.73). Increases in collembola and mite have previously been associated with manure fertilizer use (Jiang and Chen 2004). However, here we do not see a difference in mesofauna communities after several years of manure use. We observed later in the season that residue on the soil surface was not significantly different between treatment, although it was quite variable. It is possible that this residue supports mesofauna communities throughout the whole year, despite changes on above the soil surface due to cover crops or slight increases in residue from manure.
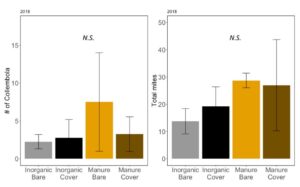
Fig 17. A. Number of collembola in soil; B. Number of mites in soil collected in June 2018. Error bars represent SE.
Field experiment – Epigeal predator activity-density
Carabid beetle activity was higher in manure plots in 2016 (P<0.0001,FIGURE 18A), but this reversed in 2017. Carabid populations were higher in inorganic fertilized plots in September 2017 (P=0.07; FIGURE 18B) but did not have different populations at any other time during the season. In 2018, we did not detect any effect of fertilizer or cover treatments on carabid activity. This is contrary to our expectations for carabid beetles based on previous studies (Rowen et al. submitted). Interestingly, the first year of manure, carabid activity was higher in manure fertilized plots compared to inorganically fertilized plots, but in subsequent years this reversed, particularly later in the season. Cover and fertilizer type did not affect rove beetle activity density (NB GLM ; X2 = 1.04, P = 0.79, FIGURE 19), wolf spider activity density (X2 = 1.50, P = 0.68; FIGURE 20), or ant activity density (X2 = 0.53, P = 0.91; FIGURE 21). However, opiliones activity density was marginally lower in manure plots (X2 = 6.18, P = 0.10: Fertilizer: P=0.06, Cover: P=0.77, Cover: P= 0.69; FIGURE 22). A few studies have found that manure increases these groups (Mathews et al. 2002; Brown and Tworkoski 2004), but many others observed more variable effects on predators (Purvis and Curry 1984; Eyre et al. 2009).
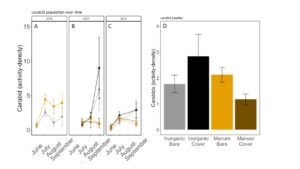
Fig 18. Carabid activity-density collected by pitfall trap from June to September in (A) 2016, (B) 2017 (C) 2018. (D) Total carabid activity-density averaged over all collection points. Error bars represent SE.
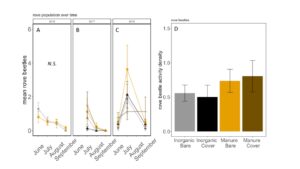
Fig 19. Staphylinid activity-density collected by pitfall trap from June to September in (A) 2016, (B) 2017 (C) 2018. (D) Total staphylinid activity-density averaged over all collection points. Error bars represent SE.
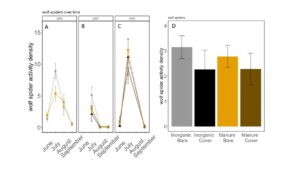
Fig 20. Lycosid activity-density collected by pitfall trap from June to September in (A) 2016, (B) 2017 (C) 2018. (D) Total lycosid activity-density averaged over all collection points. Error bars represent SE.
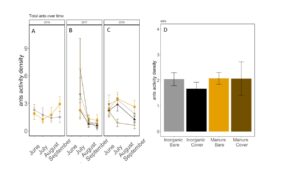
Fig 21. Ant activity-density collected by pitfall trap from June to September in (A) 2016, (B) 2017 (C) 2018. (D) Total ant activity-density averaged over all collection points. Error bars represent SE.
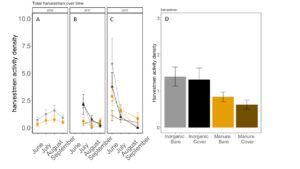
Fig 22. Opiliones activity-density collected by pitfall trap from June to September in (A) 2016, (B) 2017 (C) 2018. (D) Total opiliones activity-density averaged over all collection points. Error bars represent SE.
Field experiment – Sentinel predation
Predation rates were not influenced by wheat cover or fertilizer application overall (X2 = 1.0113; P=0.79, FIGURE 23A). In 2017, no dates were significantly affected by these treatments (July: X2 = 2.8046; P=0.42; August: X2 = 4.0807; P=0.25; Sept: X2 = 1.802; P= 0.6145). In 2018, cover marginally increased predation by ~27 % in June ( X2 = 3.246; P= 0.07; Cover: P = 0.08), but in July, manure significantly decreased predation, and there was an interaction between cover and manure, although a means separate test could not distinguish between means (TukeyHSD; X2 = 6.9674; P= 0.07; Fertilizer: P=0.04, Cover: P = 0.41, Fertilizer*Cover: P=0.03). Later in the season, fertilizer and cover crop treatment did not have an effect on predation rate (August X2 = 2.314; P= 0.50; Sept X2 = 1.042; P= 0.79), although predation rate was high in all plots.
When we compared the activity density of carabids caught in pitfall traps with sentinel predation rates, we found that carabids did not correlate with sentinel prey rates (X2=1.1637; P= 0.28). However, wolf spider activity density was negatively correlated with sentinel predation rates (X2=8.33; P= 0.004 FIGURE 23B). Spiders are often intraguild predators, and may be preying on predators that are more likely to eat our sentinel prey such as carabid beetles and ants (Hodge 1999). However, no other predator group was significantly correlated with sentinel predation rates, and sentinel predation were very high in all treatments, indicating that perhaps manure and cover crops are supporting an already sizable predator population.
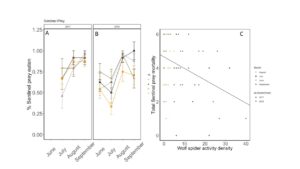
Fig 23: Percent sentinel prey consumed from June to September in (A) 2017 and (B) 2018. (C) Correlation between total sentinel prey consumed and wolf spider activity density. In panels A and B, yellow is bare manure, dark brown is cover cropped with manure, grey is bare inorganic fertilizer, and black is cover cropped inorganic fertilizer. Error bars represent SE. In panel C, Circles are from 2017, triangles are from 2018. Data from June are in yellow, July are in black, August is in grey, and September is in dark brown.
Field experiment – Yield
In 2016, silage yield of plots with manure was marginally lower in manure plots than in inorganically fertilized plots (ANOVA F1,6=4.9, P=0.07: FIGURE 9A). In 2017, yield was equivalent in all plots (ANOVA F3,12 = 1.36, P=0.30; FIGURE 9B). In 2018, yield was higher in plots fertilized with manure than inorganic fertilizer, although there was no effect of wheat cover crops (ANOVA F3,12 = 2.50, P=0.10; Fertilizer: P=0.02, Cover: P=0.99, Fertilizer*Cover=0.50; FIGURE 9C). Yield shows that long term use, manure can provide higher yields than inorganic fertilizer, likely because nutrients are released over several years. Pest damage was not high enough in any year to affect yield. Previous studies have found that using manure can stabilize yield relative to inorganic fertilizers (Manna et al. 2005). 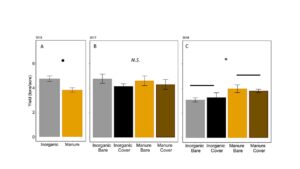
Fig 24. Average yield of silage from plots in (A) 2016, (B) 2017, and (C) 2018. Error bars represent SE. *: P<0.05, **: P < 0.01
We conclude that manure can benefit pest management by altering host plant quality, but manure amendments and grassy cover crops impact the habitat surrounding corn, which can exacerbate certain pests, despite plants being of lower quality for herbivore performance. Specifically, we found that the number of plants damaged by slugs increased with manure fertilization. Farmers have reported increases in slug problems when fertilizing with manure anecdotally, this is the first data collected that shows manure increases slug damage. We expected that manure would also benefit pest management by increasing ground-dwelling predators and decomposers. However, we found that, after 3 years, these populations were not different between treatments. Because plot size decreased between 2016 and 2017/2018, movement between treatments in smaller plots may decrease evidence of changes in habitat quality for predators. However, mesofauna do not move as much as larger predators, and were also not different in June 2018 even after several years of manure +/- wheat cover cropping. Instead, we suspect that using no-till might benefit predator populations so much that differences between manure and cover crop treatments may not be detectable, especially since manure is hypothesized to partially increase predator populations by supporting a greater decomposer arthropod community that serve as alternative prey. We found that by the end of year 3, manure increased yield relative to inorganically fertilized plots. Cover did not affect plant quality for herbivores, predators or yield in any years, but did make slug damage more pervasive in 2017.
This research suggests that farmers may want to consider plant quality for herbivores, but it is also critical to understand habitat modifications that can lead to greater pest populations, such as slugs and true armyworm. However, even in plots that had 50% of plants with slug damage, this damage was very minimal, perhaps because of the robust predator populations that were able to consume 95% sentinel prey by August. Farmers should continue to practice IPM, but also be aware that slugs can be a problem when fertilizing with manure, despite the benefits of manure on plant resistance to herbivores.
Education & outreach activities and participation summary
Participation summary:
I prepared and instructed 7-12 year-olds in insect predator and other beneficial insects at the Penn State "Bug camp for kids" week in 2017 and 2018. Additionally, I co-organized an activity at the Penn State "Great Insect Fair" that allowed the public to explore soil and interact with carabids, earthworms and other beneficial soil insects (2017 & 2018). I also was an invited speaker at a extension training day in November 2017 to present information on Western bean cutworm and russian wheat aphids. I have presented this research at the Entomological Society of America meetings 3 times:
- Rowen, E, Tooker, J. Nov 2018. Bull manure increases corn resistance to some lepidopteran herbivores ESA National Meeting, Vancouver Canada.
- Rowen, E, Tooker, J. March 2018. Manure: friend or foe? Plant susceptibility to lepidopteran larvae under manure fertilization. ESA Eastern Branch Meeting, Annapolis, MD.
- Rowen, E, Tooker, J. September 2016. Do biotic components of healthy soils increase plant resistance to herbivores?’ International Congress of Entomology, International Meeting, Orlando, FL
and will present my manure results at the Plant-Herbivore gordon conference in February 2019.
This project has already contributed to a submitted review paper, and we hope to publish 2 more based on the data collected:
Rowen E, Tooker J, and Blubaugh C. Soil fertility management to promote arthropod pest suppression. Journal of Biological Control. Submitted Jan 2019
Project Outcomes
Our results will hopefully allow farmers to move away from insecticide-heavy management and towards IPM. We are hopeful that our project in no-till agriculture will highlight the gaps between manure use in tilled and no till agriculture, as pest problems in no-till agriculture are different from conventionally tilled agriculture, and these pests may be aggravated by manure use. Predators may already be increased by practicing no-till, and manure may not have as strong an effect on predators in no-till systems. However, using many sustainable practices together can decrease overall costs for farmers and build soils long-term. We found that the benefits of manure may be more long term, and so farmers may need to practice this nutrient management tactic for multiple years before seeing increases in yield.
During the course of objective 1, we observed that high soil phosphorus was associated with high herbivore performance. With these observations, we were interested to find out what effect low to high levels of phosphorus have on plant-insect interactions. Additionally, because phosphorus can build up in the soil when fertilized with manure, how herbivores react to increased phosphorus can have important implications for the effect of manure on herbivores. USDA NIFA funded a project to explore the effects of phosphorus and the micronutrient Zn fertilizers on herbivore performance and oviposition preferences in the greenhouse and the field.
We expected that this project would help farmers make decisions about what types of nutrient management to use, and whether using a wheat cover crop would benefit their pest management strategy, especially in no-till corn. We found that manure can increase yield long-term. However, despite our greenhouse results which suggest some herbivores do not perform as well on manure treated plants, we found that herbivore damage was greater when treated with manure, particularly slugs. With this project, we were able to record that manure increases slug damage. This has been anecdotally reported by farmers in PA, but this is the first data collected on slug damage and slug populations over a season in manure. Carabid beetle abundance was higher in the first year, but evened out between treatments in subsequent years.
With the project, I have refined a diversity of techniques that will allow me to answer a range of questions at the intersection of soil-plant-herbivore interactions: measuring plant defenses, especially concentrations of defensive proteins and phytohormones, and developing useful bioassays to assess performance of various types of herbivores. Further, I have learned how to perform assays assessing the macro-nutritional content of plant content for herbivores. I can apply these skills to new projects that will further our understanding of how soil management affects plant quality for herbivores, influences plant-herbivore interactions, and pest outbreaks.