Final report for GNE19-200
Project Information
The aim of this project was to assess the effects of diet diversity and sunflower plantings on native bee health, specifically the gut microbiome and immune function. We approached these questions through an observational field study (Objective 1) and laboratory experiments (Objective 2).
In Objective 1, we collected bumble bees (Bombus impatiens) and sweat bees (Halictus ligatus) from farms in Western Massachusetts. We collected H. ligatus instead of the originally planned M. rotundata because M. rotundata were not abundant at our sites. We chose farms that varied in their floral diversity and the amount of sunflowers planted; farms with high floral diversity tended to have few sunflowers, and vice versa. We categorized farms by their relative amount of sunflower blooms (none, low, medium, and high) and assessed differences in bee gut microbiomes across sites and bloom categories. We collected bumble bees from eight farms, two in each bloom category. We collected sweat bees from four farms (two low, one medium, one high). We then characterized the gut bacterial communities from these wild bees by sequencing the 16S rRNA genes. In Objective 2, we conducted experiments testing the effects of pollen diet diversity (1, 2, or 3 flower species) on the gut microbiome of bumble bees (B. impatiens) and leafcutter bees (Megachile rotundata), and an additional experiment on bumble bee immunity. We fed bees their assigned pollen diet treatment for 7 days and then dissected out their guts and again sequenced the 16S rRNA genes. To assess immune function in B. impatiens, we inserted a small implant into the bee abdomen and waited 2 hours for the bee to encapsulate the implant with melanin. This is a primary component of the insect immune system, known as the melanization response. We then dissected out and photographed the implants and quantified the percent melanin coverage on each. We did not have enough M. rotundata individuals to perform the immune response experiment with that species.
We found that the bumble bee gut microbiome communities significantly differed between the farms and sunflower bloom categories, but bacterial diversity was not correlated with farm floral diversity or sunflower acreage. We found that sweat bee microbiomes differed between sites, however these results are preliminary due to low sample sizes and replication for this species. In the lab experiments, we found that bumble bees and leafcutter bees differed significantly in their gut microbiome communities, and that pollen diet did not affect gut bacterial communities in leafcutter bees, but was dependent on bee age in bumble bees. Bacterial diversity was not correlated with pollen diet diversity in either bee species. Lastly, pollen diet did not significantly affect the bumble bee melanization response.
Our results suggest that bee gut microbiomes are influenced by host species, landscape, and sometimes diet, however these differences are not correlated with dietary diversity. Further, our results suggest that when the available diets are low diversity, such as the monofloral diets in the lab experiments and the farms with low floral diversity, we found bees had similar gut microbiomes to those fed diverse diets and collected on the high diversity farms. Given that sunflowers provide medicinal benefits to bumble bees, understanding how sunflower monoculture landscapes may otherwise affect bee health is an important next step before recommending sunflower plantings to promote bee populations. Our results suggest that sunflower-dominated landscapes with low floral diversity provided enough nutrition for both bumble bees and sweat bees to maintain diverse gut microbiomes. Further, we found that low diversity diets did not negatively impact the gut microbiome of either B. impatiens or M. rotundata or immune function in B. impatiens. While low floral diversity may negatively impact bee species diversity, our research shows that low floral diversity does not negatively impact the gut microbiomes or immune system in these generalist species. We conclude that farmers may use sunflowers as part of diverse wildflower plantings on/near their farm to promote bee health.
Objective 1: We documented variation in gut microbiomes of multiple bee species along a floral diversity gradient in Amherst, Massachusetts. We selected eight farms that range in floral composition from highly diverse (>10 co- flowering species) to sunflower-only plantings. We collected solitary sweat bees (Halictus ligatus) and social bumble bee workers (Bombus impatiens) at each site and sequenced their gut microbiomes to assess patterns and differences between solitary and social taxa and between landscapes. If bees within the same site host similar communities of bacteria or patterns of microbial diversity, this would suggest that the floral community has an important role influencing the gut microbiome. Alternatively, we may find that host genus or sociality plays a more important role than landscape in structuring gut microbial communities. This study may also allow us to identify specific bacterial taxa and community patterns driven by sunflower pollen in an agricultural context, shedding light on the underlying mechanism of sunflower’s medicinal effect.
Hypotheses: Gut microbiome diversity will increase with floral diversity, but gut microbiomes of solitary species will reflect site differences more than social species because solitary bees acquire gut microbes primarily from their environment, while social bees acquire microbes primarily from their nest [1].
Objective 2: To complement findings from the field survey, we experimentally tested how diet diversity and quality affect the gut microbiomes of two bee species, Bombus impatiens and Megachile rotundata, and the immune response in B. impatiens. If diet diversity increases immune response, then bees would be more susceptible to pathogens in low diversity habitats. On the other hand, if diet diversity reduces immune response, then bees in less diverse habitats may have increased performance in the presence of pathogens. However, an active immune response is energetically costly in the absence of pathogens, requiring increased food intake and decreasing bee performance. Thus, floral diversity and pathogens could synergistically affect bee performance.
Hypotheses: Gut microbiome diversity and immune response will increase with diet diversity in both species, but B. impatiens will have lower gut microbial diversity across treatments than M. rotundata due to coevolution with a small group of bacterial taxa.
[1] McFrederick QS, Wcislo WT, Taylor DR, Ishak HD, Dowd SE, Mueller UG. 2012. Environment or kin: whence do bees obtain acidophilic bacteria? Molecular Ecology. 21:1754-1768.
[2] Doums C & Schmid-Hempel P. 2000. Immunocompetence in workers of a social insect, Bombus terrestris L., in relation to foraging activity and parasitic infection. Canadian Journal of Zoology, 78:1060-1066.
[3] Allander K & Schmid-Hempel P. 2000. Immune defence reaction in bumble-bee workers after a previous challenge and parasitic coinfection. Functional Ecology, 14:711-717.
[4] Davis S, Malfi R, Roulston T. 2015. Species differences in bumblebee immune response predict developmental success of parasitoid fly. Oecologia, 178:1017-1032.
Two aspects of modern agriculture impede sustainable practices: (A) lack of floral diversity in and around farms and (B) reliance on managed bees. Agricultural land is often dominated by one or few flowering species, resulting in a monotonous diet for pollinators, which can negatively affect bee fitness, especially when combined with other stressors such as pathogens [1]. Studies on the effects of nutrition on bee health have been focused almost exclusively on the social and often managed taxa, honey bees [2] and bumble bees [3]. However, solitary bees comprise 85% of bee species, provide essential pollination services to many natural and agricultural ecosystems [4], and are vulnerable to pathogens [5]. The adoption of social behavior (i.e., a colony with a queen and workers) is often accompanied by other differences in life history and physiology, and bees with different levels of social contact likely differ in their responses to diets and pathogens. Therefore, we can cannot apply what is known about social bees to solitary species. Relying on one species of managed bee agriculturally is not sustainable [6] and managed bees can negatively impact native ecosystems by disrupting plant-pollinator networks [7] and transmitting diseases to wild congeners [8]. Understanding and protecting wild bees is critical to minimize reliance on managed bee colonies. Improving our strategies to promote wild bee populations will require more studies on the factors and mechanisms underlying solitary bee health.
To conserve wild bee populations, we need a better understanding of how both social and solitary bees respond to pathogens under reduced floral resource diversity. Research on social bees has found that diet impacts not only growth and development, but also the immune response [9] and gut microbiome [10]. Since the structure of the bee gut microbiome is dictated by evolutionary history of sociality [11], the microbiome could be an important factor determining species-specific responses to diet and pathogens. Therefore, I propose to test the effect of floral diversity and consumption of medicinal pollen on gut microbiomes and immune response in social and solitary bee species. Our lab recently found that pollen from sunflowers reduced infection levels of a common gut pathogen in one bumble bee species and that worker bees from farms with higher acreage of sunflower have lower pathogen prevalence [12]. This study will identify the impact of sunflower pollen on the gut microbiome and immune response in multiple native bee species in the field and lab to better understand this pattern. These results will provide insight on how reduced floral diversity impacts performance of multiple bee species, which will shed light on how wild populations and communities will respond to landscape simplification.
[1] Goulson D, Nicholls E, Botias C, Rotheray EL. 2015. Bee declines driven by combined stress from parasites, pesticides, and lack of flowers. Science. 347(6229): 1255957.
[2] Dolezal AG, Toth AL. 2018. Feedbacks between nutrition and disease in honey bee health. Current Opinion on Insect Science. 26:114-119.
[3] Roger N, Michez D, Wattiez R, Sheridan C, Vanderplanck M. 2017. Diet effects on bumblebee health. Journal of Insect Physiology. 96:128-133.
[4] Cane JH. 2008. Pollinating bees crucial to farming wildflower seed for U.S. habitat restoration. In Bee Pollination in Agricultural Ecosystems, ed. James RR, Pitts-Singer TL, 4:48–64. New York: Oxford University Press. 232 pp.
[5] Potts SG, Biesmeijer JC, Kremen C, Neumann P, Schweiger O, Kunin WE. 2010. Global pollinator declines: trends, impacts and drivers. Trends in Ecology & Evolution 25:345-353.
[6] Kearns CA, Inouye DW, Waser NM. 1998. Endangered mutualisms: The conservation of plant-pollinator interactions. Annual Review of Ecology, Evolution, and Systematics. 29:83-112.
[7] Valido A, Rodriguez-Rodriguez MC, Jordano P. 2019. Honeybees disrupt the structure and functionality of plant-pollinator networks. Scientific Reports. 9:4711.
[8] Graystock P, Blane EJ, McFrederick QS, Goulson D, Hughes WOH. 2016. Do managed bees drive parasite spread and emergence in wild bees? International Journal for Parasitology: Parasites and Wildlife. 5:64-75.
[9] Alaux C, Ducloz F, Crauser D, Le Conte Y. 2010. Diet effects on honeybee immunocompetence. Biology Letters. 6:562-565.
[10] Billiet A, Meeus I, Van Nieuwerburgh F, Deforce D, Wackers F, Smagghe G. 2016. Impact of sugar syrup and pollen diet on the bacterial diversity in the gut of indoor-reared bumblebees (Bombus terrestris). Apidologie 47:548-560.
[11] Martinson VS, Danforth BN, Minckley RL, Rueppell O, Tingek S, Moran NA. 2011. A simple and distinctive microbiota associated with honey bees and bumble bees. Molecularly Ecology. 20:619-628.
[12] Giacomini JJ, Leslie J, Tarpy DR, Palmer-Young EC, Irwin RE, Adler LS. 2018. Medicinal value of sunflower pollen against bee pathogens. Scientific Reports. 8:14394.
Research
OBJECTIVE 1
Overview
We collected 200 Bombus impatiens workers and 60 Halictus ligatus females from farms varying in acreage of blooming sunflowers. Collection dates were between July 24 – August 20, 2020 when sunflowers were in bloom (Table 1). We hand-collected individuals directly into vials and placed on them ice. Once we returned to the lab, bees were transferred to microcentrifuge tubes and placed in -80°C. We quantified floral resource diversity on each farm on the day of bee collection by doing visual surveys. We did not quantify density or floral coverage of other non-sunflower flowering species.
Table 1. Bombus impatiens collections from eight farms varying in percent sunflower and floral diversity. Farms were categorized as the area of blooming sunflowers (m2) on date of collection; low: <200 m2, medium: 200-1000 m2, high: >1000 m2. Collection dates are in 2020.
|
Farm |
Sunflower Category |
Sunflower bloom area (m2) |
Flower species richness |
Bombus impatiens (n) |
B. impatiens collection date |
Halictus ligatus (n) |
H. ligatus collection date |
|
Sunset (ST) |
None |
0 |
62 |
10 |
Aug 13 |
- |
- |
|
Many Hands (MH) |
None |
0 |
39 |
18 |
Aug 19 |
- |
- |
|
Dan’s Veggies (DV) |
Low |
124 |
13 |
- |
- |
12 |
Aug 12 |
|
Hampshire (HC) |
Low |
44 |
25 |
33 |
Aug 21 |
- |
- |
|
Simple Gifts (SG) |
Low |
84 |
45 |
37 |
Aug 18 |
- |
- |
|
The Bars (TB) |
Medium |
642 |
35 |
36 |
Aug 19 |
13 |
Aug 20 |
|
Bardwell (BW) |
Medium |
388 |
44 |
15 |
Aug 10 |
21 |
July 24 |
|
Smiarowski (SK) |
High |
2527 |
4 |
14 |
Aug 14 |
- |
- |
|
Red Fire (RF) |
High |
1134 |
37 |
37 |
Aug 20 |
14 |
Aug 5 |
Microbiome DNA Processing and Analysis
Sample processing
We stored each bee at -80°C until gut dissection and DNA extraction. We dissected out the gut, excluding the crop and rectum, of each bee under sterile conditions and placed each into a tissue collection plate (Qiagen, Germantown, Maryland). We then added one 3-mm chromium steel bead, ~50 uL of 0.10mm zirconium beads (Biospec, Bartlesville, Oklahoma), 180 uL of Qiagen buffer ATL and 20 uL of proteinase K to each sample. We then bead beat the samples with a Qiagen Tissue Lyser for 6 min at 30 Hz, rotating the plates half-way through. We incubated the samples at 56°C for 1 hr and then followed the Qiagen DNeasy Blood and Tissue extraction kit protocol for remaining steps. We included four blank extractions as no-template controls in all downstream procedures and analyses.
16S rRNA Gene Amplicon Sequencing
To characterize bacterial communities, we prepared amplicon libraries using the 799F (CMGGATTAGATACCCKGG) and 1115R (AGGGTTGCGCTCGTTG) 16S rRNA gene primers (Hanshew, Mason, Raffa, & Currie, 2013; Kembel et al., 2014). We included the partial Illumina sequencing adapter and a unique combination of 8-mer barcodes for each sample with primers that include the genomic primer sequence. We performed 25 cycles of PCR in 25 uL reaction mixtures with a 52°C annealing temperature. We made a master mix with 5x buffer (GoTaq, Promega, Madison, Wisconsin), magnesium chloride, deoxynucleoside triphosphates (dNTPs), and Taq polymerase (GoTaq, Promega, Madison, Wisconsin) based on quantities from Phusion MasterMix (Thermo Scientific, Waltham, Massachusetts). We removed excess primers and dNTPs from the PCR products using exonuclease and shrimp alkaline phosphatase. We performed a second PCR with 1 uL of cleaned PCR product as the template and primers that complete the Illumina sequencing construct: PCR2F (CAAGCAGAAGACGGCATACGAGAT CGGTCTCGGCATTCCTGC) and PCR2R (AATGATACGGCGACCACCGAGATCTACACTCTTTCCCTACACGACG). Both PCRs start with an initial 94°C denaturing step for 3 min, followed by 25 cycles of 94°C for 45 s, 52°C for 1 min, and 72°C for 1.5 min. We normalized the amount of DNA in each library with SequalPrep normalization plates (Invitrogen, Waltham, Massachusetts). We pooled 5 uL of each library and then removed any primer-dimer and excess master mix components with AMPure XP beads (Beckman Coulter, Brea, California). The Genomics Core at the University of California, Riverside checked DNA quality and concentration using the 2100 Bioanalyzer (Agilent, Santa Clara, California) and then sequenced the libraries in a single run on the MiSeq (Illumina, San Diego, California) using the V3 2 x 300 reagent kit.
Bioinformatics
We used QIIME2 to process the Illumina fastq files (Bolyen et al., 2019). We removed the barcodes and concatenated them into a separate file so that the format was compatible with QIIME2, and then demultiplexed the sequences. To trim low quality sequences and bin reads into amplicon sequence variants (ASVs), we ran DADA2 with default parameters and read trimming of 237 (253 for Obj. 2) bases for forward reads and 190 (211 for Obj. 2) bases for reverse reads (Callahan et al., 2016). We assigned taxonomy to ASVs by using the QIIME2 sklearn classifier trained to the 799 to 1115 region of the SILVA 16S rRNA gene database (Bokulich et al., 2018; Quast et al., 2013). We additionally used the NCBI database to conduct local BLAST searches for ASVs that required further classification. We used R version 4.2.1 for decontamination and QIIME2 for final filtering (R Core Team, 2022). We identified contaminants using the “prevalence” method in the decontam package (ver 1.8.0) (N. M. Davis, Proctor, Holmes, Relman, & Callahan, 2018). We used a conservative threshold of 0.5, which identifies ASVs that were more prevalent in negative controls than in samples. We then filtered out the identified contaminants as well as mitochondria and chloroplast ASVs. We rarefied to 8000 reads per sample and exported the rarefied feature table (with blank samples removed).
Statistics
To calculate and assess community diversity metrics, we used the vegan (Oksanen et al., 2022) and phyloseq packages (McMurdie & Holmes, 2013) in R version 4.2.1 (R Core Team, 2022). To investigate alpha diversity, we used linear mixed models (lme4 package) (Bates, Maechler, Bolker, & Walker, 2015) to analyze the number of ASVs (“species richness” hereafter) and the calculated Shannon diversity index. To investigate beta diversity, we calculated Bray-Curtis, unweighted, and weighted UniFrac distance matrices using the distance function. We then analyzed two community metrics. First, we analyzed variance in species composition among treatment groups (measured by the distance to the centroid of each group) using the betadisper function. Second, we analyzed overall species composition between treatment groups (measured by the distance between group centroids) using the adonis function to conduct a permutational multivariate analysis of variance (PERMANOVA). We visualized beta diversity in ordination plots using Principle Coordinates Analysis (PCoA). Unless otherwise noted, beta diversity statistics reported in the text are based on the Bray-Curtis distance metric.
We ran separate of models to assess community metrics in response to sunflower category, sunflower acreage, and floral diversity. For B. impatiens, full models included sunflower category, sunflower acreage, or floral diversity as the main fixed effect and bee size (estimated by wing marginal cell length) as additional fixed effect and site as a random effect. For H. ligatus, full models included either site or sunflower category and bee size as fixed effects and no random effects. We validated models using the simulateResiduals function (DHARMa package (Hartig, 2022)). We used emmeans (Lenth, 2020) and ggplot to produce figures (Wickham, 2016).
For alpha diversity models, we ran full models and then used Akaike information criterion (AIC) for model selection (AICcmodavg package) (Mazerolle, 2020). We report results from the best-fitting models. For beta diversity models, we did not use model selection and report results from full models. We tested the significance of terms using likelihood ratio χ2 tests using the Anova function (car package) (Fox & Weisberg, 2019).
We used these same processing, bioinformatics, and general statistical methods for the gut microbiome samples in Objective 2.
OBJECTIVE 2
Overview
We tested the effect of pollen diet diversity on gut bacterial communities in two bee species, the common eastern bumble bee (Bombus impatiens) and the alfalfa leafcutter bee (Megachile rotundata), and performed an additional experiment testing the effect of the same diet treatments on the melanization immune response – the process in which melanin is deposited around a foreign object inside the body cavity – in B. impatiens (Figure 1). For all experiments, we placed bees in individual containers with their assigned pollen diet treatment (sterilized) and 30% sucrose solution (not sterilized). We replaced sucrose and pollen every other day and measured consumption over a 48-hr period. After 7 d, we anesthetized the bees on ice and then froze them in -80°C for later processing. We collected the right forewing of each bee and measured the marginal cell length as a proxy for bee size.
Figure 1. Experimental design diagram for Objective 2. We tested the effect of pollen diet on the gut microbiome in B. impatiens and M. rotundata (top portion) and the effect of pollen diet on the melanization response in B. impatiens (bottom portion). Diagram produced in Biorender; M. rotundata and flower artwork by Laura Hamon.
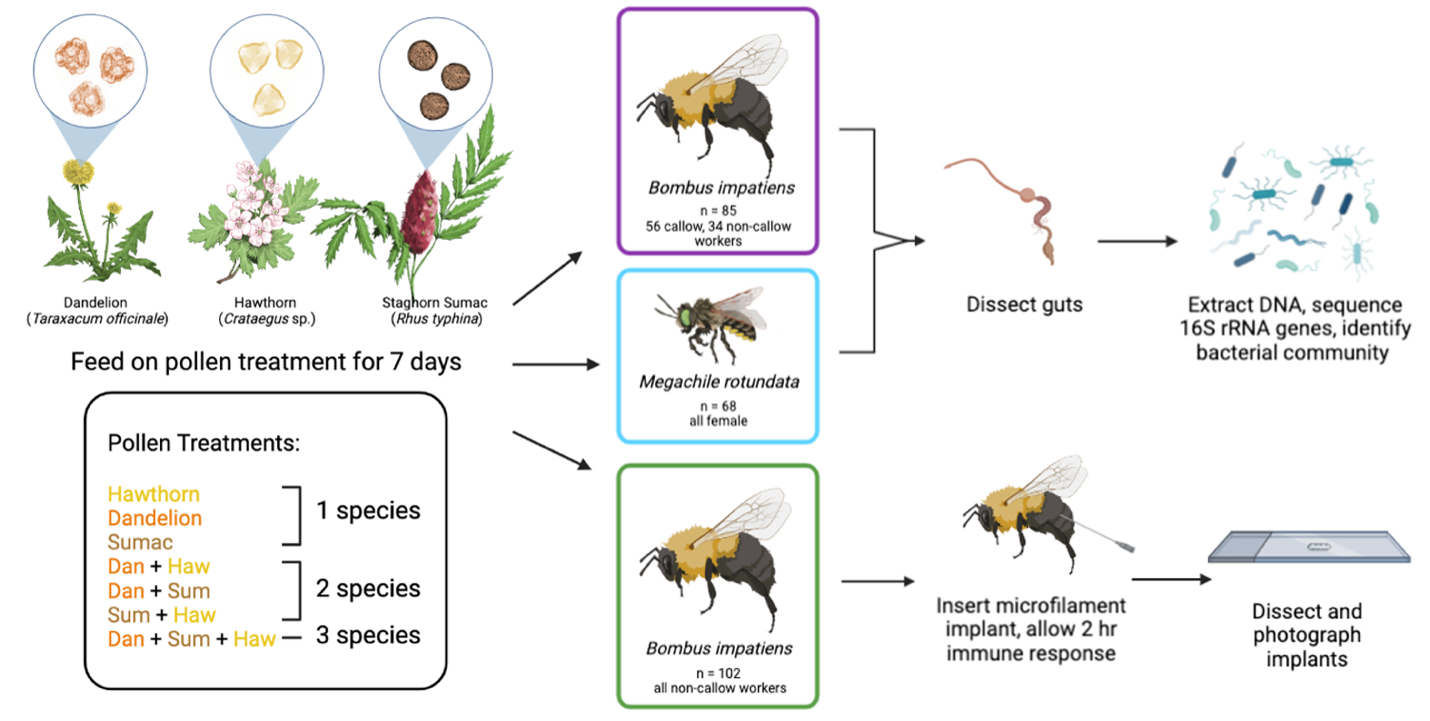
Pollen diets
Three species of pollen were used in the experiment: dandelion (Taraxacum officinale, Asteraceae), staghorn sumac (Rhus typhina, Anacardiaceae), and hawthorn (Crataegus sp., Rosaceae). The pollens were honey bee-collected in Quebec, Canada and confirmed to be >95% one species by microscopy. Pollen from these species differ in nutritional content; the protein to lipid ratio is 4.31 to 1 for hawthorn, and 0.7 to 1 for dandelion (Vaudo et al., 2020). There are no records for staghorn sumac, but pistachio (Pistacia vera, in the same family) has a 0.46 to 1 ratio (Vaudo et al., 2020). Additionally, pollen from sunflowers (Asteraceae) and rugosa rose (Rosaceae) differ in composition of amino acids, fatty acids, minerals, and moisture levels (Yang et al., 2013), suggesting that our species in those families, dandelion and hawthorn, likely differ in these qualities.
All pollens were sterilized by ethylene oxide at the USDA facility in Logan, Utah. Samples were exposed to one AN7916 ampule of 17.5 g Anprolene for 12 hr in an AN74i Anprolene Gas Sterilizer benchtop fumigation chamber (Anderson Sterilizers Inc. Haw River, North Carolina). Peak ethylene oxide dose was at least 2000 mg/L*hr. Pollens were stored at -20°C before and after sterilization. Pollens were then ground using a mortar and pestle. Pollens were sorted into seven treatments: each pollen species alone (three 1-species treatments), each pair-wise combination (three 2-species treatments), and one combination of all three species. Multifloral treatments were made by combining the pollen species in equal parts by weight. We then mixed each treatment with deionized water to make the pollen into a paste.
We measured pollen and sucrose consumption of each bee in each experiment in the first 48-hrs by weighing the pollen provision and sucrose solutions before and after delivery to each bee. We measured evaporation of each pollen diet by including deli cups with pollen and sucrose solutions with no bees (n = 2-3 per treatment per experiment). To account for evaporation, we built a linear regression of the final pollen weight predicted by initial pollen weight for the controls of each pollen treatment (no bees), with the intercept set to 0. From the linear regressions, we estimated predicted final pollen weights after evaporation for each bee replicate. We then subtracted the observed final pollen weight from the predicted final pollen weight to estimate consumption.
Table 2. Sample sizes for all three experiments after excluding bees that died.
|
Treatment |
B. impatiens gut microbes |
M. rotundata gut microbes |
B. impatiens melanization |
|
Dandelion |
9 |
9 |
12 |
|
Sumac |
9 |
8 |
13 |
|
Hawthorn |
10 |
8 |
9 |
|
1-species |
28 |
25 |
34 |
|
Dandelion + Sumac |
10 |
7 |
10 |
|
Dandelion + Hawthorn |
9 |
5 |
12 |
|
Sumac + Hawthorn |
9 |
8 |
12 |
|
2-species |
28 |
20 |
34 |
|
Dandelion + Sumac + Hawthorn 3-species |
29 |
23 |
34 |
|
Total |
85 |
68 |
102 |
The effect of pollen diet on gut bacteria in Bombus impatiens
We used workers of the common eastern bumble bee (Bombus impatiens, Family: Apidae), derived from wild-caught queens collected in Amherst, Massachusetts in the spring of 2021. Bombus impatiens is abundant in New England and not in decline (Richardson, McFarland, Zahendra, & Hardy, 2019). Bombus impatiens is an annual social species; mated queens overwinter and then establish nests in the spring. Queens lay eggs that develop into workers, progressing to males and new queens later in the season. They are generalist foragers, and workers consume pollen themselves in addition to foraging for pollen for the colony (personal observations). Workers of this species are relatively large-bodied (8-16 mm in length). We reared queens in the laboratory until the colonies were large enough that we could remove workers without affecting colony survival. Colonies were fed non-sterilized, honey bee-collected wildflower mix pollen (Koppert Biological Systems). All queens were screened for Crithidia bombi infections via microscopy of feces, and only workers from uninfected queens were used.
We used 90 bumble bee workers from six natal colonies in the experiment. Of the 90 bumble bees, 56 were newly-emerged workers, also known as callows (identified by silver hair, which turns black after about 1 day post-eclosion). We removed callows from their colony, kept them in individual vials for 2 hr, and then hand-inoculated them with 10-15 uL of nestmate feces mixed with 50% sucrose. Similar inoculation protocols have been shown to result in microbiomes indistinguishable from mature, in-colony workers (Zheng, Powell, Steele, Dietrich, & Moran, 2017). After inoculation, we placed each bee into an individual container. We initially only used callows to control for worker age and starting microbiome. However, callows were reluctant to consume fecal inoculum, making this process very time consuming, and we switched to using non-callow adults for the last 34 bumble bees. The non-callows were taken straight from their colony and did not receive the fecal inoculum. We presume that the non-callows were inoculated with nestmate feces prior to removal from their colonies (bumble bees’ gut microbiomes stabilize within 4 days of eclosure;) (Tobin J. Hammer et al., 2022). We included this age variable (callow/non-callow) in our analyses. All bees were housed in 16-oz deli cups and had access to 30% sucrose and their pollen diet. Bumble bees were placed in the experiment on ten start dates between August 11-26, 2021. Five bumble bees died during the experiment, resulting in a final sample size of 85 (Table 2).
The effect of pollen diet on gut bacteria in Megachile rotundata.
The alfalfa leafcutter bee (Megachile rotundata, Family: Megachilidae) is a solitary bee that nests in cavities and lines brood cells with leaves. Females provision brood cells one at a time with a ball of mixed pollen and nectar, onto which they lay an egg. They then seal the brood cell and provide no additional maternal care to the developing larva. Megachile rotundata are highly valued and managed in North America for their pollination of alfalfa, but they are also generalist foragers, visiting a wide variety of plants (Pitts-Singer & Cane, 2011). Compared to B. impatiens, M. rotundata are small-bodied (6-9 mm in length). We used commercial bees (that arrive as pupal cocoons; Mason Bees For Sale, Deweyville, Utah) and kept them at 7°C until use. We then placed them in darkness, inside a mesh cage in 27°C until individuals emerged.
To ensure that the leafcutter bees had enough exposure to bacterial cells to give them an initial microbiome, we provided individuals with an ecologically-relevant microbial inoculum. To do this, we created a solution of deionized water sonicated with flowers, collected from Amherst, Massachusetts on the first trial date, September 14, 2021. The flower species included Solidago sp., Cosmos sp., Impatiens capensis, Lobelia siphilitica., Trifolium repens, Pycnanthemum virginianum, Satureja hortensis, and Allium tuberosum. We removed stems, sepals, leaves, and dehisced flowers, and then sonicated them in a falcon tube of 50 mL deionized water for 10 minutes. We then mixed 200 uL of the flower water with 400 uL of 50% sterile glycerol and 200 uL of sterile PBS, for a final concentration of 25% glycerol. This solution was divided into aliquots and stored in -80°C; the first start date inoculum was made the same day and therefore not frozen. We then prepared inoculum on each trial start dates by mixing one part flower water with one part 50% sucrose. The leafcutter bees were starved in microcolony containers for 2-4 hr, but were reluctant to consume the inoculum when hand-fed in an individual vial. Therefore, we placed the bees in their individual containers (60 mm diameter petri dish; with drilled holes) and pipetted 10 uL of flower water directly onto a cotton wick, which was placed in a 30% sucrose solution. Leafcutter bees were placed in the experiment on three start dates between September 14-16, 2021. We entered 74 leafcutter bees in the experiment; four died and two samples could not be PCR amplified, resulting in a final sample size of 68 (Table 2).
Statistics
We ran separate groups of models to assess community metrics in response to host species (2 groups), diet composition (7 groups), and diet diversity (3 groups). Once we found a significant effect of host species on various community metrics (see Results), we separately analyzed effects of diet (both composition and diversity) and other experimental variables within each host.
For B. impatiens, full models included age (callow/non-callow) and bee size (estimated by wing marginal cell length) as additional fixed effects and start date and colony as random effects. For M. rotundata, full models included bee size as an additional fixed effect, and start date and plate ID (since samples of this species were spread across multiple plates) as random effects. We modeled pollen consumption with a linear model with a normal distribution (lme4 package) (Bates et al., 2015) and survival using the coxme function (coxme package (T. M. Therneau, 2020)), survfit, and Surv functions (survival package (T. Therneau, 2022)).
For alpha diversity, pollen consumption, and survival models, we ran full models and then used AIC for model selection (Mazerolle, 2020). We report results from the best-fitting models. For pollen consumption and survival models, we used pollen diet composition (not diversity) as the treatment predictor. For beta diversity models, we did not use model selection and report results from full models. All final models (except for the models with host as a predictor) retained diet treatment as a fixed effect since it was our variable of interest.
Assessing the effect of pollen diet on immunity in Bombus impatiens
Experimental Design
We measured the amount of melanin deposited on a foreign object in the bee body, which is a commonly used method for estimating immune function in bumble bees (Allander & Schmid-Hempel, 2000; S. E. Davis, Malfi, & Roulston, 2015; Doums & Schmid-Hempel, 2000). We used B. impatiens workers from commercial colonies (Koppert Biological Systems, Howell, Michigan), reared in the lab, and the same diet treatments as the previous experiments. We removed non-callow workers and placed them directly into individual deli cup containers with access to their pollen diet treatment and 30% sucrose. On day 7, we anesthetized bees by placing them in the freezer for 3-5 min. Once bees were immobilized, we punctured the pleural membrane between the 3rd and 4th abdominal tergite using a sterile needle and then inserted a sterile, transparent 1-mm long microfilament (Sufix Elite) into the abdominal cavity using forceps. We then returned the bee to its individual container to recover for 2 hr in a dark room with access to sucrose and their pollen treatment. After 2 hr, bees were frozen in -20°C and then transferred to -80°C. We later dissected the abdomen of each bee to recover the implants. We mounted implants to a microscope slide using clear nail polish and then photographed each implant using a dissecting microscope at 20X magnification. Bumble bees were placed in the experiment on five start dates between November 29-December 13, 2021. We entered 135 workers, from three natal colonies, into the experiment. Twelve bees died during the experiment, 7 escaped, 9 died after being anesthetized (these were accidentally placed in a different freezer that was too cold), and we could not find the implants during dissection in 5 bees, resulting in a final sample size of 102 bees used for analyses (Table 2).
Measuring melanization of implants
We imported photographs of each implant to ImageJ (Schneider, Rasband, & Eliceiri, 2012) and used the “Color Threshold” tool to select pixels of certain color, brightness, and saturation thresholds. We then used the polygon tool to select the area around the implant and the “Analyze Particles” tool to calculate the percentage of pixels within the polygon that were selected. Because implants were cylindrical, we were using a 2D representation of the 3D object to estimate melanin coverage. However, the implants were transparent, so we could assess melanization on the front side and see through the implant to the back side, except when there was overlap between the melanized areas. To account for both sides of the implant, we divided the calculated percentage melanization by half. Because these calculations may be underestimates due to the possibility of melanin on the front side visually blocking any on the back side, we also binned the resulting estimates into three categories of melanization levels: low (0-10%), medium (11-24%), and high (>25%). Samples were roughly evenly distributed across these levels.
Statistics
We modeled proportion melanization with a generalized linear mixed model with a beta error distribution, using the glmmTMB function (glmmTMB package) (Brooks et al., 2017). We additionally performed a chi-square test on the melanization levels and diet treatments. For both of these analyses, we built separate models using diet composition (7 groups) or diet diversity (3 groups) as predictors. We used the same protocol as described above for pollen consumption and survival. Initial models included diet treatments (composition or diversity) and bee size as fixed effects and start date and natal colony as random effects, and we performed model selection using AIC.
References
Allander, K., & Schmid-Hempel, P. (2000). Immune defence reaction in bumble-bee workers after a previous challenge and parasitic coinfection. Functional Ecology, (1956), 711–717.
Bates, D., Maechler, M., Bolker, B., & Walker, S. (2015). Fitting Linear Mixed-Effects Models using lme4. Journal of Statistical Software, 67, 1–48. doi: 10.18637/jss.v067.i01
Bokulich, N. A., Kaehler, B. D., Rideout, J. R., Dillon, M., Bolyen, E., Knight, R., … Gregory Caporaso, J. (2018). Optimizing taxonomic classification of marker-gene amplicon sequences with QIIME 2’s q2-feature-classifier plugin. Microbiome, 6(1), 1–17. doi: 10.1186/s40168-018-0470-z
Bolyen, E., Rideout, J. R., Dillon, M. R., Bokulich, N. A., Abnet, C. C., Al-Ghalith, G. A., … Caporaso, J. G. (2019). Reproducible, interactive, scalable and extensible microbiome data science using QIIME 2. Nature Biotechnology, 37(8), 852–857. doi: 10.1038/s41587-019-0209-9
Brooks, M. E., Kristensen, K., van Benthem, K. J., Magnusson, A., Berg, C. W., Nielsen, A., … Bolker, B. M. (2017). glmmTMB Balances Speed and Flexibility Among Packages for Zero-inflated Generalized Linear Mixed Modeling. The R Journal, 9(2), 378–400.
Callahan, B. J., McMurdie, P. J., Rosen, M. J., Han, A. W., Johnson, A. J. A., & Holmes, S. P. (2016). DADA2: High-resolution sample inference from Illumina amplicon data. Nature Methods, 13(7), 581–583. doi: 10.1038/nmeth.3869
Davis, N. M., Proctor, Di. M., Holmes, S. P., Relman, D. A., & Callahan, B. J. (2018). Simple statistical identification and removal of contaminant sequences in marker-gene and metagenomics data. Microbiome, 6(1), 1–14. doi: 10.1186/s40168-018-0605-2
Davis, S. E., Malfi, R. L., & Roulston, T. ’H. (2015). Species differences in bumblebee immune response predict developmental success of a parasitoid fly. Oecologia, 178(4), 1017–1032. doi: 10.1007/s00442-015-3292-8
Doums, C., & Schmid-Hempel, P. (2000). Immunocompetence in workers of a social insect, Bombus terrestris L., in relation to foraging activity and parasitic infection. Canadian Journal of Zoology, 78(6), 1060–1066. doi: 10.1139/cjz-78-6-1060
Fox, J., & Weisberg, S. (2019). An {R} Companion to Applied Regression, Third Edition. Retrieved from https://socialsciences.mcmaster.ca/jfox/Books/Companion/
Hammer, T. J., Easton-Calabria, A., & Moran, N. A. (2022). Microbiome assembly and maintenance across the lifespan of bumble bee workers. Molecular Ecology.
Hanshew, A. S., Mason, C. J., Raffa, K. F., & Currie, C. R. (2013). Minimization of chloroplast contamination in 16S rRNA gene pyrosequencing of insect herbivore bacterial communities. Journal of Microbiological Methods, 95(2), 149–155. doi: 10.1016/j.mimet.2013.08.007
Hartig, F. (2022). _DHARMa: Residual Diagnostics for Hierarchical (Multi-Level / Mixed) Regression Models_. R package version 0.4.6.
Kembel, S. W., O’Connor, T. K., Arnold, H. K., Hubbell, S. P., Wright, S. J., & Green, J. L. (2014). Relationships between phyllosphere bacterial communities and plant functional traits in a neotropical forest. Proceedings of the National Academy of Sciences of the United States of America, 111(38), 13715–13720. doi: 10.1073/pnas.1216057111
Lenth, R. (2020). emmeans: Estimated Marginal Means, aka Least-Squares Means. Retrieved from https://cran.r-project.org/package=emmeans
Mazerolle, M. J. (2020). AICcmodavg.
McMurdie, P. J., & Holmes, S. (2013). phyloseq: An R Package for Reproducible Interactive Analysis and Graphics of Microbiome Census Data. PLoS ONE, 8(4).
Oksanen, J., Simpson, G., Blanchet, F., Kindt, R., Legendre, P., Minchin, P., … Weedon, J. (2022). vegan: Community Ecology Package. Retrieved from https://cran.r-project.org/package=vegan
Pitts-Singer, T. L., & Cane, J. H. (2011). The Alfalfa Leafcutting Bee, Megachile rotundata: The World’s Most Intensively Managed Solitary Bee. Annual Review of Entomology, Vol 56, 56, 221–237. doi: 10.1146/annurev-ento-120709-144836
Quast, C., Pruesse, E., Yilmaz, P., Gerken, J., Schweer, T., Yarza, P., … Glöckner, F. O. (2013). The SILVA ribosomal RNA gene database project: Improved data processing and web-based tools. Nucleic Acids Research, 41(D1), 590–596. doi: 10.1093/nar/gks1219
R Core Team. (2022). A Language and Environment for Statistical Computing. R Foundation for Statistical Computing, Vienna, Austria, https://www.R-project.org. Retrieved from http://www.r-project.org
Richardson, L. L., McFarland, K. P., Zahendra, S., & Hardy, S. (2019). Bumble bee (Bombus) distribution and diversity in Vermont, USA: a century of change. Journal of Insect Conservation, 23(1), 45–62. doi: 10.1007/s10841-018-0113-5
Schneider, C. A., Rasband, W. S., & Eliceiri, K. W. (2012). NIH Image to ImageJ: 25 years of image analysis. Nature Methods, 9(7), 671–675. doi: doi:10.1038/nmeth.2089
Therneau, T. (2022). A Package for Survival Analysis in R.
Therneau, T. M. (2020). coxme: Mixed Effects Cox Models. doi: 10.1198/tech.2002.s656
Vaudo, A. D., Tooker, J. F., Patch, H. M., Biddinger, D. J., Coccia, M., Crone, M. K., … Grozinger, C. M. (2020). Pollen protein: Lipid macronutrient ratios may guide broad patterns of bee species floral preferences. Insects, 11(2). doi: 10.3390/insects11020132
Wickham, H. (2016). ggplot: Elegant Graphics for Data Analysis. Retrieved from https://ggplot2.tidyverse.org
Yang, K., Dan, W., Xingqian, Y., Donghong, L., Jianchu, C., & Peilong, S. (2013). Characterization of chemical composition of bee pollen in China. J Agr Food Chem, 61, 708–718.
Zheng, H., Powell, J. E., Steele, M. I., Dietrich, C., & Moran, N. A. (2017). Honeybee gut microbiota promotes host weight gain via bacterial metabolism and hormonal signaling. Proceedings of the National Academy of Sciences of the United States of America, 114(18). doi: 10.1073/pnas.1701819114
Results:
OBJECTIVE 1:
We collected 200 Bombus impatiens from eight farms and 60 Halictus ligatus from four farms in Western Massachusetts (Table 1). Since we ended up with low sample sizes and replication for the H. ligatus, we conducted some preliminary analyses to see general patterns, but do not draw conclusions based on these data for that species. Our selected sites varied in the floral diversity and area of sunflower bloom (Table 1, Figure 2). Sites that had higher amounts of sunflower tended to have lower floral species richness and vice versa (Figure 2).
For Bombus impatiens, we had 6,500,484 16S rRNA gene amplicon reads with an average of 29,574 reads per sample. We identified a total of 888 amplicon sequence variants (ASVs), each corresponding to a bacteria taxon. We found that typical core bacterial taxa dominated B. impatiens guts, including Gilliamella, Lactobacillus, Snodgrassella, and Candidatus Schmid-Hempelia (Figure 3). We also identified many other bacterial genera previously documented in bumble bee guts including Bombella, Fructobacillus, Acinetobacter, Sodalis, and Bifidobacterium (Figure 3). Sunflower bloom category (none, low, medium, high) did not significantly affect gut bacterial species richness in B. impatiens workers (χ2 = 2.569, d.f. = 3, P = 0.463; Figure 3). Additionally, bacterial species richness was not affected by site (F = 1.244, d.f. = 7, P = 0.281) nor site floral diversity (χ2 = 0.419, d.f. = 1, P = 0.518; Figure 4). In all models, bee wing size (a proxy for body size) did not significantly affect bacterial diversity either (χ2< 0.09, P > 0.764; F = 0.484, P = 0.488). Bombus impatiens gut bacterial communities differed in their dispersion (distance of a given community from group centroid) between sites (F = 3.815, d.f. = 7, P = 0.0007) and sunflower bloom categories (F = 6.053, d.f. = 3, P = 0.0006, Figure 5). We found that bacterial communities differed in their overall composition (distance between group centroids, based on Bray-Curtis dissimilarity matrix) between sites (F = 2.494, d.f. = 7, P < 0.0001) and sunflower bloom categories (F = 2.264, d.f. = 3, P = 0.001, Figure 5).
For Halictus ligatus, we had 2,575,956 reads with an average of 42,932 reads per sample. We identified a total of 283 ASVs. We found many bacteria that have been previously documented in bee and other insect guts including Lactobacillus, Wolbachia, Acinetobacter, and Sodalis (Figure 6). Halictus ligatus gut bacterial richness differed between sites (F = 3.229, d.f. = 3, P = 0.03) but not sunflower bloom category (χ2 = 1.845, d.f. = 2, P = 0.398, Figures 5, 6) or site floral diversity (F = 0.893, d.f. = 1, P = 0.349, Figure 6). In all models, bee wing size did not significantly affect bacterial diversity (P > 0.479). Gut bacterial communities in H. ligatus did not significantly differ in their dispersion between sites (F = 0.471, d.f. = 3, P = 0.704) or sunflower bloom categories (F = 1.004, d.f. = 2, P = 0.373). However, communities differed in their composition between sites (F = 5.493, d.f. = 3, P < 0.0001) and bloom categories (F = 4.022, d.f. = 2, P = 0.002, Figure 8).
OBJECTIVE 2:
Gut microbiome experiments
Bacterial communities in both host species
We obtained a total of 3,921,703 16S rRNA gene amplicon reads with an average of 24,820 reads per sample. We identified a total of 334 ASVs. Host species significantly predicted alpha and beta diversity in bees. Compared to M. rotundata, B. impatiens had higher species richness (F = 32.21, d.f. = 1, P < 0.0001; Figure 9A) and Shannon diversity (F = 9.70, d.f. = 1, P = 0.002; Figure 9B). B. impatiens also had wider dispersion among replicates than M. rotundata (F = 11.35, d.f. = 1, P = 0.001) and the two host species differed significantly in community composition (F = 41.93, d.f. = 1, P < 0.0001; Figure 9C).
Bacterial communities in Bombus impatiens
Within B. impatiens, when the diets were separated by composition, the best models for species richness included diet composition, age, and their interaction as fixed effects, and natal colony and experimental start date as random effects. We found a significant diet composition by age interaction (χ2 = 19.51, d.f. = 6. P = 0.003; Figure 9D), and subsequently analyzed callows and non-callows separately. We found that diet composition had no effect on species richness within callows (χ2 = 89.173, d.f. = 6, P = 0.226), but had a significant effect in non-callows (χ2 = 13.636, d.f. = 6, P = 0.034). The Sumac + Hawthorn treatment yielded relatively low bacterial diversity, while Sumac alone and Dandelion + Hawthorn yielded relatively high diversity in non-callows (Figure 9D). When diets were combined by levels of diversity, we found a weak effect of diet diversity (χ2 = 4.894, d.f. = 2, P = 0.087; Figure 9E) and bee size (χ2 = 3.117, d.f. = 1, P = 0.077) on species richness. The diet by age interaction effect was present, although weaker, when diets were combined by level of diversity (χ2 = 5.926, d.f. = 2, P = 0.052; Figure 9E). The best model for Shannon diversity included only diet treatment (whether that was composition or diversity) as a fixed effect, and it did not differ significantly between treatments (diet composition: F = 0.239, d.f. = 6, P = 0.962; diet diversity: F = 0.529, d.f. = 2, P = 0.591).
Beta diversity measured by Bray-Curtis dispersion was significantly affected by natal colony (F = 2.714, d.f. = 5, P = 0.026), but not diet treatment (composition or diversity), age, or experimental start date (F < 1.003, P > 0.43 for all). However, when using unweighted UniFrac distance, dispersion was significantly different between callows and non-callows (F = 5.647, d.f. = 1, P = 0.02). Community composition did not differ significantly between diet composition (F = 1.073, d.f. = 6, P = 0.342; Figure 9A) or diversity (F = 1.458, d.f. = 2, P = 0.143). We found slight evidence for differences in community composition based on age (F = 1.785, d.f. = 1, P = 0.078) and colony (F = 1.433, d.f. = 5, P = 0.052). One bacterial genus, Bombella, was only present in bees from one of the six natal colonies.
All bumble bee gut bacterial communities consisted of previously-documented core members, including Snodgrassella, Bifidobacterium, Lactobacillus, Bombella and Candidatus Schmidhempelia. However, they were missing a commonly dominant member, Gilliamella (T. J. Hammer, Le, Martin, & Moran, 2021) (Figure 10A). Within Lactobacillus, 42.5% of the observations were L. panisapium, 30% were L. kosoi, 13.4% were L. paracasei/rhamnosus, 11% were L. apis, and the last 3.5% were unclassified. Communities also included other genera that were previously reported to be associated with bees and flowers (Acintobacter, Asaia, Pantoea (Inglis, Sigler, & Goette, 1993; McFrederick et al., 2017), Neokomagatae (Rering, Beck, Hall, McCartney, & Vannette, 2018; Vannette & Fukami, 2018; Yukphan et al., 2011)) and soil (an ASV in Enterobacteriaceae, which shared 100% sequence identity to Citrobacter, Enterobacter, and Pantoea species; Figure 10A). We also found two samples that had an unidentified ASV, which shared 98% sequence identity to Bombus hypnorum, suggesting it was unintentionally amplified from the host genome.
Bacterial communities in Megachile rotundata
Within M. rotundata, when the diets were separated by composition, the best models for species richness included diet composition and bee size as fixed effects and plate ID as a random effect. We found species richness was not affected by diet composition (χ2 = 7.294, d.f. = 6, P =0.294; Figure 9F) or bee size (χ2 = 0.003, d.f. = 1, P = 0.954). When diets were combined by levels of diversity, we found no effect of diet diversity (χ2 = 2.47, d.f. = 2, P = 0.291; Figure 9G) or bee size (χ2 = 0.114, d.f. = 1, P = 0.735). The best model for Shannon diversity was diet (whether that was composition or diversity) as the only fixed effect; however, we found no effect of diet composition (F = 1.104, d.f. = 6, P = 0.371) nor diversity (F = 0.953, d.f. = 2, P = 0.391) on Shannon diversity in M. rotundata. Beta diversity measured by community dispersion and composition were not affected by diet composition, diversity, or experimental start date (F < 1.26, P > 0.235 for all, Figure 10B).
Megachile rotundata had high colonization by flower-associated bacteria, including Neokomagataea, Acinetobacter, and Asaia, and soil-associates, including multiple genera in the Enterobacteriaceae family (Kluyvera, and two ASVs that could be Citrobacter, Enterobacter, Klebsiella, and/or Pantoea; Figure 8B; (McFrederick et al., 2017)). Megachile rotundata contained other genera at lower abundances that were also in the bumble bee guts including Snodgrassella, Acinetobacter, Asaia (Figure 10B) and Candidatus Schmidhempelia, which was found at <1% abundance and therefore not included in the figure. One sample contained Wolbachia, which is commonly associated with arthropods and previously found in solitary bee guts (Martinson et al., 2011) and nests (McFrederick & Rehan, 2016).
Pollen consumption and survival
The final model for pollen consumption after accounting for evaporation in B. impatiens included pollen diet composition, age, and size as fixed effects. Callows consumed more pollen than non-callows (F = 112.47, d.f. = 1, P < 0.0001) and larger bees consumed more pollen than smaller bees (F = 30.509, d.f. =1, P < 0.0001). Diet composition had a marginally significant effect on consumption; bees had a slight preference for the Sumac + Hawthorn and the 3-species mix over the other types (F = 1.979, d.f. = 6, P = 0.079).
The final model for consumption in M. rotundata included pollen diet composition as the only fixed effect. Pollen treatment did not significantly affect consumption (F = 1.433, d.f. = 6, P = 0.215), but we saw a slight increase in consumption of sumac pollen compared to other types. Survival was high for both species (94.4% for B. impatiens and 94.6% for M. rotundata) and did not differ between species (χ2 = 0.005, d.f. = 1, P = 0.943) or pollen diet composition (χ2 = 5.258, d.f. = 6, P = 0.511).
Melanization experiment
Most implant samples (93.2%) showed some evidence of melanization. On average, bees melanized about 11% (±0.984 SE) of the implant surface area. The best fit model for the percent area of microfilament colored by melanin included diet treatment (composition or diversity) as a fixed effect with start date and natal colony as random effects. The percent melanized was not affected by diet composition (χ2 = 2.693, d.f. = 6; P = 0.846; Figure 11A) or diversity (χ2 = 1.219, d.f. = 2, P = 0.544). The chi-square test on melanization grouped by levels (low, medium, or high) showed melanization was not affected by diet composition (χ2 = 7.101, d.f. = 12, P = 0.851; Figure 11B) or diversity (χ2 = 0.994, d.f. = 4, P = 0.911). The best fit model for pollen consumption after accounting for evaporation of each pollen type included pollen diet composition as a fixed effect, however it did not affect consumption (F = 1.711, d.f. = 6, P = 0.124). There was a 91.1% survival rate. The best fit model for survival included pollen diet composition as a fixed effect and natal colony as a random effect, but we found no effect of pollen diet composition on survival (χ2 = 0.355, d.f. = 6, P = 0.999).
Discussion:
In Objective 1, we found a significant effect of farm and sunflower category on the gut bacterial community of Bombus impatiens workers (Figure 5), but bacterial species richness was not correlated with sunflower acreage or flowering species diversity (Figure 4). In Halictus ligatus females, we similarly found a significant effect of farm on gut bacterial community composition (Figure 8). Consistent with previous studies, we found that social bumble bees and solitary sweat bees indeed differed in their gut microbial communities, both in terms of diversity and structure, however we did not find that H. ligatus had more variable communities than B. impatiens, as we hypothesized. We additionally hypothesized that a diet high in sunflower and of low floral diversity would be correlated with low gut bacterial diversity; our results do not support this. However, we found that farm was a strong predictor of gut microbial community in both species.
There are myriad variables that differ from one farm to another that may be responsible for different bee microbiomes, such as surrounding land use and floral diversity beyond those measured in the farm, pesticide use on and near the farm, and presence of other bee species that may serve as reservoirs of certain gut microbes or competitors for floral resources. In fact, previous studies have found that bee gut microbiomes differ between collection sites and landscapes (Bosmans et al., 2018; Donkersley, Rhodes, Pickup, Jones, & Wilson, 2018; Jones et al., 2018). It is therefore unsurprising that we found a significant effect of farm on bee gut bacteria community composition and dispersion.
In both species, we found a significant effect of sunflower bloom category on gut bacterial community composition (Figure 5, 8), suggesting that there are certain bacteria associated with sunflowers. We plan to further analyze these data to determine which bacterial taxa were differentially abundant between bloom categories. In 2020, we conducted another study alongside this project, where we experimentally tested the effect of sterilized sunflower pollen on the gut bacterial communities in commercial B. impatiens. Bees fed sunflower pollen did not have distinct gut bacterial communities compared to the wildflower mix pollen control (Fowler et al., unpublished data). While these lab results show that feeding on sunflower pollen does not alter the existing microbial community, there may be certain bacteria associated with sunflowers in the field. Flowers are naturally colonized by microbes (Junker & Keller, 2015), which can then be transferred to flower visitors (Keller et al., 2021; McFrederick et al., 2017). Certain microbes may be associated with sunflowers due to sunflower's unique floral architecture, nectar and pollen qualities, or particularly wide taxonomic range of flower visitors, including a large community of insects and some birds (Hurd, LaBerge, & Linsley, 1980). Additionally, sunflowers host several specialist bee pollinators, such as Melissodes sp., thus certain microbes could be transmitted from such specialists and not found on other flower species. Further studies on bee- and flower-associated bacteria would be required to test these hypotheses and elucidate these relationships and transmission networks.
Our results suggest that a sunflower pollen diet and sunflower-dominated landscapes with low floral diversity provided enough nutrition for bees to maintain diverse gut microbiomes. We plan to conduct additional analyses on these data to further investigate the associations between sunflowers and other farm traits (i.e., total size, surrounding landscape, floral community structure) and certain gut bacterial taxa. We additionally point out that our field study had low replication (n = 1-2 farms per category) so the significant effect of sunflower plantings may be influenced by farm-based differences; we hope that further studies with more farms can verify these patterns.
In Objective 2, we found that pollen diet influenced gut bacterial diversity in older Bombus impatiens workers, but not in newly-emerged workers or Megachile rotundata females (Figure 9, 10). Additionally, pollen diet did not affect the melanization immune response in B. impatiens (Figure 11). We predicted that a low-diversity pollen diet would result in less diverse gut microbial communities and an impaired immune response due to lower nutritional diversity, but our results did not support this prediction. Both B. impatiens and M. rotundata gut communities included environmentally acquired bacteria, while B. impatiens also included putatively coevolved taxa. Community composition in both species did not show distinct clusters by diet treatments and bumble bees were more influenced by natal colony and age than diet. Our findings suggest that gut communities are driven by priority effects; the first microbes that arrive into the gut become established and then remain stable in the face of varying nutritional input.
We used sterile pollen to rule out effects of foodborne microbes, thereby allowing us to attribute any effects of diet on microbial communities to nutritional differences. This may not be reflective of nature, since pollen commonly harbors its own microbial community (Junker & Keller, 2015; Manirajan et al., 2016), but nonetheless sheds light on the complex interactions between host, diet, and gut microbes. The three pollen types used in our study are from different plant families (and orders) that vary in nutritional content (Vaudo et al., 2020; Yang et al., 2013). We found no obvious correlation between pollen diversity and gut microbial diversity, suggesting that the initial microbial communities were relatively stable despite sudden and sustained dietary change. Even single-species pollen types still contributed adequate resources for the persistence of diverse communities over seven days. The stability of these microbial communities suggests that priority effects and drift play important roles in their long-term assemblages. Additionally, pollen diet may not affect gut microbial communities in bees if these taxa are more dependent on carbohydrate resources, such as pectin of the pollen wall (Engel, Martinson, & Moran, 2012) or sugars in nectar, than the proteins and lipids inside pollen. Indeed, nectar qualities such as the concentration of different types of sugars appear to have a greater effect on bumble bee gut bacterial composition than different pollen diets (Billiet et al., 2016). We also note that we measured differences in relative abundance, rather than absolute abundances in gut microbes between diet treatments (Faith, Mcnulty, Rey, & Gordon, 2011). Future research investigating the nutritional requirements of these bacteria and using methods such as shotgun sequencing or qPCR, which would allow for measures of absolute abundance, would yield additional insights to the drivers of variation in these communities.
Our results showed that older worker bees differed from young callows in their responses to diet treatments; species richness was significantly influenced by diet type in older bees, but not in callows (Figure 9D, 9E). A recent study found that the gut microbiomes of bumble bee workers exhibit a predictable successional trajectory, growing logistically in both abundance and diversity, and plateauing around the age of 4 days (Tobin J. Hammer, Easton-Calabria, & Moran, 2022). Given the non-callow group is a much wider age range (any age older than 24-hours), and therefore has opportunity for more variation, it is perhaps surprising that we found a significant effect of diet on gut microbial richness in this group and not in the callows. However, because the callows received a fecal inoculum that was pooled from multiple individuals from their natal colony, they did not experience this natural succession process and may have developed an even more diverse and therefore stable microbiome than they would have acquired naturally. Future studies with more control of worker age would provide additional insight into how gut microbiomes may be influenced by pollen diet at different life stages. Additionally, further research is needed to understand why non-callows showed changes in species richness when fed certain diets, such as sumac and hawthorn.
We found multiple flower-associated microbial taxa including Neokomagatea, Acinetobacter, Asaia, and Pantoea in both host species (Inglis et al., 1993; McFrederick et al., 2017; Rering et al., 2018; Vannette & Fukami, 2018; Yukphan et al., 2011). This is interesting given that we did not directly feed floral microbes to the bumble bee workers. They may have acquired their floral microbes through their wild-caught queen and/or through the non-sterilized honey bee-collected pollen they were fed prior to the experiment. One bacterial genus, Bombella, only occurred in workers from one colony, suggesting this bacterium originated from that queen during spring foraging. This supports the hypothesis that flowers are transmission hubs for pollinator microbes (Keller et al., 2021; McFrederick et al., 2017). The M. rotundata may have acquired their floral microbes from the flower inoculum that we provided, or from their larval pollen provisions (although bees shed their larval microbiome during metamorphosis), the nest cavity, or the leaves lining the nest. Plant-pollinator networks are recognized as microbe (including pathogen) transmission networks (Figueroa et al., 2020; Keller et al., 2021), and plant species differ in their potential to transmit microbes (Adler, Barber, Biller, & Irwin, 2020; Adler, Irwin, McArt, & Vannette, 2021).
We found unexpected representation (and lack thereof) of several bacterial taxa. First, we note a lack of common bee-associated microbes such as Gilliamella in B. impatiens and Lactobacillus kunkeei and L. micheneri in both hosts. Second, we found very low abundances of any Lactobacillus species in M. rotundata, which differs from previous studies (McFrederick et al., 2017; Voulgari-Kokota, Grimmer, Steffan-Dewenter, & Keller, 2018). These absences may be due to region- or season-specific floral resources and environments where the bees were sourced (Utah for M. rotundata; Massachusetts for B. impatiens). Lastly, we found trace amounts of the genus Candidatus Schmidhempelia in M. rotundata, which has not been found previously. Since this genus has previously only been associated with bumble bees, this could be due to sequencing error (i.e., “barcode hopping”).
We found that diet diversity did not impact the bumble bee melanization response (Figure 4.4). These results are consistent with previous studies that found monofloral and polyfloral pollen diets resulted in similar immune function in honey bees (Alaux, Ducloz, Crauser, & Le Conte, 2010) and bumble bees (Brown, Moret, & Schmid-Hempel, 2003; Fowler, Sadd, Bassingthwaite, Irwin, & Adler, 2022; Roger, Michez, Wattiez, Sheridan, & Vanderplanck, 2017). However, bumble bees with no access to pollen had reduced immune gene expression (Brunner, Schmid-Hempel, & Barribeau, 2014) and immune function positively correlated with amount of pollen consumed (Fowler et al., 2022). This suggests that pollen is indeed important for adult bees to mount an immune response, but the type or diversity of pollen may be less important. However, as noted above, in nature certain pollen types are correlated with certain microbes, and these microbes likely have important functions for training the bee immune system and/or inhibiting pathogens through other mechanisms (Killer, Dubná, Sedláček, & Švec, 2014; Koch & Schmid-Hempel, 2011; Kwong, Mancenido, & Moran, 2017). Therefore, while pollen nutritional content alone may not affect bee immunity, pollen-borne microbes likely play an important role in pathogen inhibition in bees and should be further investigated.
Our study found that pollen diet diversity did not affect bumble bee immunity or the gut microbiome in either species, although the effects in bumble bees were dependent on worker age. In bumble bees, where we assessed both gut microbiome and immunity, we did not see strong effects of diet in either response, thus our results do not rule out the possibility that the melanization response is influenced by the microbiome. Since we saw similar patterns in both responses, immunity may respond to changes in the gut microbiome, and vice versa, but characterizing this link will require further experiments. Our study shows that pollen diet does not induce changes in either the gut microbiome or the melanization response in bumble bees.
In both objectives, we found no significant relationship between diet diversity and gut bacterial diversity. These results are consistent with previous studies that found little to no correlation between diets and host microbial diversity. For example, diet diversity had no correlation with gut microbiome diversity in elephants, pikas, camels (Kartzinel, Hsing, Musili, Brown, & Pringle, 2019), or salamanders (Wang et al., 2021). In studies assessing microbes in bee pollen provisions, one study found no correlation between landscape diversity and microbial diversity in Megachile provisions (Voulgari-Kokota et al., 2018) and others found weak or no correlations between pollen and bacterial diversity in nest provisions of other species (McFrederick & Rehan, 2016; Voulgari-Kokota, Ankenbrand, Grimmer, Steffan-Dewenter, & Keller, 2019). On the other hand, our results contradict multiple studies that have found a positive relationship between resource and host microbial diversity, for example in woolly monkeys (González et al., 2021), kudu (Kartzinel et al., 2019), predatory insects (Tiede, Scherber, Mutschler, Mcmahon, & Gratton, 2017), and tadpoles (Vences et al., 2016). These studies suggest that diversity in the environment has variable effects on microbial diversity in the gut or nest of animals. These contradicting patterns may be due to host taxa differing in levels of microbial filtering, which may also vary by ecological context (T. J. Hammer, Sanders, & Fierer, 2019).
While correlations between dietary and microbial species richness may vary, multiple studies have found that short-term dietary changes alter gut microbial species composition, demonstrating that certain diets are associated with certain bacterial taxa. For example, in humans, a shift to meat-eating increased clusters of bile-resistant bacteria (David et al., 2014). Within bees, Acinetobacter, Lactobacillus, Pantoea, and Sodalis bacteria were positively correlated with pollen from multiple plant genera in nests of small carpenter bees (Ceratina calcarata; (McFrederick & Rehan, 2016). Lactobacillus was also positively correlated with Asteraceae pollen in bumble bee pollen corbicula (Sookhan, Lorenzo, Tatsumi, Yuen, & MacIvor, 2020; Voulgari-Kokota et al., 2019). We thus predicted that sunflower and dandelion diet would be relatively rich in Lactobacillus, but our results for Objective 2 (and Fowler et al., unpublished data) did not support this (Figure 10). Our findings suggest that existing Lactobacillus does not preferentially feed on Asteraceae pollen. Lactobacillus may be associated with Asteraceae pollen or nectar in the wild; we would not have observed this relationship due to sterilizing the pollen. These links and their effects on bee health should be further investigated in future studies.
Given that sunflower pollen provides medicinal benefits to bumble bees (Giacomini et al., 2018), one of our goals of this study was to better understand how sunflower-dominated landscapes affect other aspects of bee health in order to make evidence-based suggestions to farmers about what flowers best support native bee populations. Our results suggest that even low diversity landscapes and single-species, low-protein pollen diets such as dandelion and sumac provided adequate nutrition to support diverse bacterial communities in three distinct bee species. Thus, we recommend that sunflowers and other Asteraceae could be incorporated as part of diverse, native wildflower strips to promote bee health on farms.
Additionally, our results suggest that older bumble bee workers may be more vulnerable to poor dietary quality than newly emerged callows, given their gut microbiome was more sensitive to changes in pollen diet composition. This study is the first assess the gut microbiome in a solitary bee species in an experimental setting (M. rotundata) and contributes to our understanding of the composition, variation, and drivers in solitary bee gut microbes. Our results further demonstrate that variation in bee gut microbiomes in the wild are not likely driven by nutritional input from pollen resources, and may be more strongly influenced by other factors such as the introduction of microbes from flowers, nests, and social interactions. This study improves our understanding of wild bee gut microbiomes and biology, as well as drivers of bee health in the face of reduced biodiversity and emergent pathogens.
References
Adler, L. S., Barber, N. A., Biller, O. M., & Irwin, R. E. (2020). Flowering plant composition shapes pathogen infection intensity and reproduction in bumble bee colonies. Proceedings of the National Academy of Sciences of the United States of America, 117(21), 1–7. doi: 10.1073/pnas.2000074117
Adler, L. S., Irwin, R. E., McArt, S. H., & Vannette, R. L. (2021). Floral traits affecting the transmission of beneficial and pathogenic pollinator-associated microbes. Current Opinion in Insect Science, 44, 1–7. doi: 10.1016/j.cois.2020.08.006
Alaux, C., Ducloz, F., Crauser, D., & Le Conte, Y. (2010). Diet effects on honeybee immunocompetence. Biology Letters, 6(4), 562–565. doi: 10.1098/rsbl.2009.0986
Billiet, A., Meeus, I., Van Nieuwerburgh, F., Deforce, D., Wäckers, F., & Smagghe, G. (2016). Impact of sugar syrup and pollen diet on the bacterial diversity in the gut of indoor-reared bumblebees (Bombus terrestris). Apidologie, 47(4), 548–560. doi: 10.1007/s13592-015-0399-1
Bosmans, L., Pozo, M. I., Verreth, C., Crauwels, S., Wilberts, L., Sobhy, I. S., … Lievens, B. (2018). Habitat-specific variation in gut microbial communities and pathogen prevalence in bumblebee queens (Bombus terrestris). PLoS ONE, 13(10). doi: 10.1371/journal.pone.0204612
Brown, M. J. F., Moret, Y., & Schmid-Hempel, P. (2003). Activation of host constitutive immune defence by an intestinal trypanosome parasite of bumble bees. Parasitology, 126(3), 253–260. doi: 10.1017/S0031182002002755
Brunner, F. S., Schmid-Hempel, P., & Barribeau, S. M. (2014). Protein-poor diet reduces host-specific immune gene expression in Bombus terrestris. Proceedings of the Royal Society B: Biological Sciences, 281(1786), 20140128. doi: 10.1098/rspb.2014.0128
David, L. A., Maurice, C. F., Carmody, R. N., Gootenberg, D. B., Button, J. E., Wolfe, B. E., … Turnbaugh, P. J. (2014). Diet rapidly and reproducibly alters the human gut microbiome. Nature, 505(7484), 559–563. doi: 10.1038/nature12820
Donkersley, P., Rhodes, G., Pickup, R. W., Jones, K. C., & Wilson, K. (2018). Bacterial communities associated with honeybee food stores are correlated with land use. Ecology and Evolution, 8(10). doi: 10.1002/ece3.3999
Engel, P., Martinson, V. G., & Moran, N. A. (2012). Functional diversity within the simple gut microbiota of the honey bee. Proceedings of the National Academy of Sciences, 109(27), 11002–11007. doi: 10.1073/pnas.1202970109
Faith, J. J., Mcnulty, N. P., Rey, F. E., & Gordon, J. I. (2011). Predicting a Human Gut Microbiota’s Response to Diet in Gnobobiotic Mice. Science, (July), 101–105.
Figueroa, L. L., Grab, H., Ng, W. H., Myers, C. R., Graystock, P., McFrederick, Q. S., & McArt, S. H. (2020). Landscape simplification shapes pathogen prevalence in plant-pollinator networks. Ecology Letters, 23(8), 1212–1222. doi: 10.1111/ele.13521
Fowler, A. E., Sadd, B. M., Bassingthwaite, T., Irwin, R. E., & Adler, L. S. (2022). Consuming sunflower pollen reduced pathogen infection but did not alter measures of immunity in bumblebees. Philosophical Transactions of the Royal Society B: Biological Sciences, 377(1853). doi: 10.1098/rstb.2021.0160
Giacomini, J. J., Leslie, J., Tarpy, D. R., Palmer-Young, E. C., Irwin, R. E., & Adler, L. S. (2018). Medicinal value of sunflower pollen against bee pathogens. Scientific Reports, 8(14394). doi: 10.1038/s41598-018-32681-y
González, C. Q., Alberto, L., Cardenas, C., Ramírez, M., Reyes, A., González, C., & Stevenson, P. R. (2021). Monitoring the variation in the gut microbiota of captive woolly monkeys related to changes in diet during a reintroduction process. Scientific Reports, 1–11. doi: 10.1038/s41598-021-85990-0
Hammer, T. J., Le, E., Martin, A. N., & Moran, N. A. (2021). The gut microbiota of bumblebees. Insectes Sociaux, (0123456789). doi: 10.1007/s00040-021-00837-1
Hammer, T. J., Sanders, J. G., & Fierer, N. (2019). Not all animals need a microbiome. FEMS Microbiology Letters, 366(May), 1–11. doi: 10.1093/femsle/fnz117
Hammer, Tobin J., Easton-Calabria, A., & Moran, N. A. (2022). Microbiome assembly and maintenance across the lifespan of bumble bee workers. Molecular Ecology.
Hurd, P. D., LaBerge, W. E., & Linsley, E. G. (1980). Principal sunflower bees of North America with emphasis on the Southwestern United States (Hymenoptera, Apoidea). Smithsonian Contributions to Zoology, (310), 1–158. doi: 10.5479/si.00810282.310
Inglis, G. D., Sigler, L., & Goette, M. S. (1993). Aerobic microorganisms associated with alfalfa leafcutter bees (megachile rotundata). Microbial Ecology, 26(2), 125–143. doi: 10.1007/BF00177048
Jones, J. C., Fruciano, C., Hildebrand, F., Al Toufalilia, H., Balfour, N. J., Bork, P., … Hughes, W. O. H. (2018). Gut microbiota composition is associated with environmental landscape in honey bees. Ecology and Evolution, 8(1). doi: 10.1002/ece3.3597
Junker, R. R., & Keller, A. (2015). Microhabitat heterogeneity across leaves and flower organs promotes bacterial diversity. FEMS Microbiology Ecology, 91(9), 1–9. doi: 10.1093/femsec/fiv097
Kartzinel, T. R., Hsing, J. C., Musili, P. M., Brown, B. R. P., & Pringle, R. M. (2019). Covariation of diet and gut microbiome in African megafauna. 116(47), 4–9. doi: 10.1073/pnas.1905666116
Keller, A., McFrederick, Q. S., Dharampal, P., Steffan, S., Danforth, B. N., & Leonhardt, S. D. (2021). (More than) Hitchhikers through the network: The shared microbiome of bees and flowers. Current Opinion in Insect Science, 44, 8–15. doi: 10.1016/j.cois.2020.09.007
Killer, J., Dubná, S., Sedláček, I., & Švec, P. (2014). Lactobacillus apis sp. nov., from the stomach of honeybees (Apis mellifera), having an in vitro inhibitory effect on the causative agents of American and European foulbrood. International Journal of Systematic and Evolutionary Microbiology, 64(PART 1), 152–157. doi: 10.1099/ijs.0.053033-0
Koch, H., & Schmid-Hempel, P. (2011). Socially transmitted gut microbiota protect bumble bees against an intestinal parasite. Proceedings of the National Academy of Sciences of the United States of America, 108(48), 19288–19292. doi: 10.1073/pnas.1110474108
Kwong, W. K., Mancenido, A. L., & Moran, N. A. (2017). Immune system stimulation by the native gut microbiota of honey bees. Royal Society Open Science, 4(170003), 1–9.
Manirajan, B. A., Ratering, S., Rusch, V., Schwiertz, A., Geissler-Plaum, R., Cardinale, M., & Schnell, S. (2016). Bacterial microbiota associated with flower pollen is influenced by pollination type, and shows a high degree of diversity and species-specificity. Environmental Microbiology, 18(12), 5161–5174. doi: 10.1111/1462-2920.13524
Martinson, V. G., Danforth, B. N., Minckley, R. L., Rueppell, O., Tingek, S., & Moran, N. A. (2011). A simple and distinctive microbiota associated with honey bees and bumble bees. Molecular Ecology, 20(3), 619–628. doi: 10.1111/j.1365-294X.2010.04959.x
McFrederick, Q. S., & Rehan, S. M. (2016). Characterization of pollen and bacterial community composition in brood provisions of a small carpenter bee. Molecular Ecology, 25(10), 2302–2311. doi: 10.1111/mec.13608
McFrederick, Q. S., Thomas, J. M., Neff, J. L., Vuong, H. Q., Russell, K. A., Hale, A. R., & Mueller, U. G. (2017). Flowers and Wild Megachilid Bees Share Microbes. Microbial Ecology, 188–200. doi: 10.1007/s00248-016-0838-1
Rering, C. C., Beck, J. J., Hall, G. W., McCartney, M. M., & Vannette, R. L. (2018). Nectar-inhabiting microorganisms influence nectar volatile composition and attractiveness to a generalist pollinator. New Phytologist, 220(3), 750–759. doi: 10.1111/nph.14809
Roger, N., Michez, D., Wattiez, R., Sheridan, C., & Vanderplanck, M. (2017). Diet effects on bumblebee health. Journal of Insect Physiology, 96, 128–133. doi: 10.1016/j.jinsphys.2016.11.002
Sookhan, N., Lorenzo, A., Tatsumi, S., Yuen, M., & MacIvor, J. S. (2020). Linking bacterial diversity to floral identity in the bumble bee pollen basket. Environmental DNA, (August), 1–12. doi: 10.1002/edn3.165
Tiede, J., Scherber, C., Mutschler, J., Mcmahon, K. D., & Gratton, C. (2017). Gut microbiomes of mobile predators vary with landscape context and species identity. (July), 8545–8557. doi: 10.1002/ece3.3390
Vannette, R. L., & Fukami, T. (2018). Contrasting effects of yeasts and bacteria on floral nectar traits. Annals of Botany, 121(7), 1343–1349. doi: 10.1093/aob/mcy032
Vaudo, A. D., Tooker, J. F., Patch, H. M., Biddinger, D. J., Coccia, M., Crone, M. K., … Grozinger, C. M. (2020). Pollen protein: Lipid macronutrient ratios may guide broad patterns of bee species floral preferences. Insects, 11(2). doi: 10.3390/insects11020132
Vences, M., Lyra, M. L., Kueneman, J. G., Bletz, M. C., Archer, H. M., Canitz, J., … Glos, J. (2016). Gut bacterial communities across tadpole ecomorphs in two diverse tropical anuran faunas. doi: 10.1007/s00114-016-1348-1
Voulgari-Kokota, A., Ankenbrand, M. J., Grimmer, G., Steffan-Dewenter, I., & Keller, A. (2019). Linking pollen foraging of megachilid bees to their nest bacterial microbiota. Ecology and Evolution, 9(18), 10788–10800. doi: 10.1002/ece3.5599
Voulgari-Kokota, A., Grimmer, G., Steffan-Dewenter, I., & Keller, A. (2018). Bacterial community structure and succession in nests of two megachilid bee genera. FEMS Microbiology Ecology, 95(1), 1–11. doi: 10.1093/femsec/fiy218
Wang, Y., Smith, H. K., Goossens, E., Hertzog, L., Bletz, M. C., Bonte, D., … Martel, A. (2021). Diet diversity and environment determine the intestinal microbiome and bacterial pathogen load of fire salamanders. Scientific Reports, 1–11. doi: 10.1038/s41598-021-98995-6
Yang, K., Dan, W., Xingqian, Y., Donghong, L., Jianchu, C., & Peilong, S. (2013). Characterization of chemical composition of bee pollen in China. J Agr Food Chem, 61, 708–718.
Yukphan, P., Malimas, T., Muramatsu, Y., Potacharoen, W., Tanasupawat, S., Nakagawa, Y., … Yamada, Y. (2011). Neokomagataea gen. Nov., with descriptions of Neokomagataea thailandica sp. nov. and Neokomagataea tanensis sp. Nov., osmotolerant acetic acid bacteria of the α-proteobacteria. Bioscience, Biotechnology and Biochemistry, 75(3), 419–426. doi: 10.1271/bbb.100344
Figures
Figure 2. The eight farms where we collected Bombus impatiens varied in total flowering species richness (left y-axis; green bars) and sunflower blooming area (right y-axis; yellow diamonds). Sites that had higher amounts of sunflower tended to have lower species richness and vice versa.
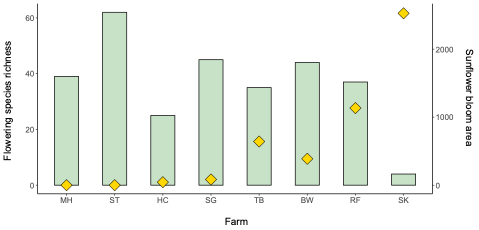
Figure 3. Relative abundance of bacterial genera (with >1% abundance) in guts of Bombus impatiens collected from eight. Plots are ordered by sunflower bloom category. Each column represents one individual bee.
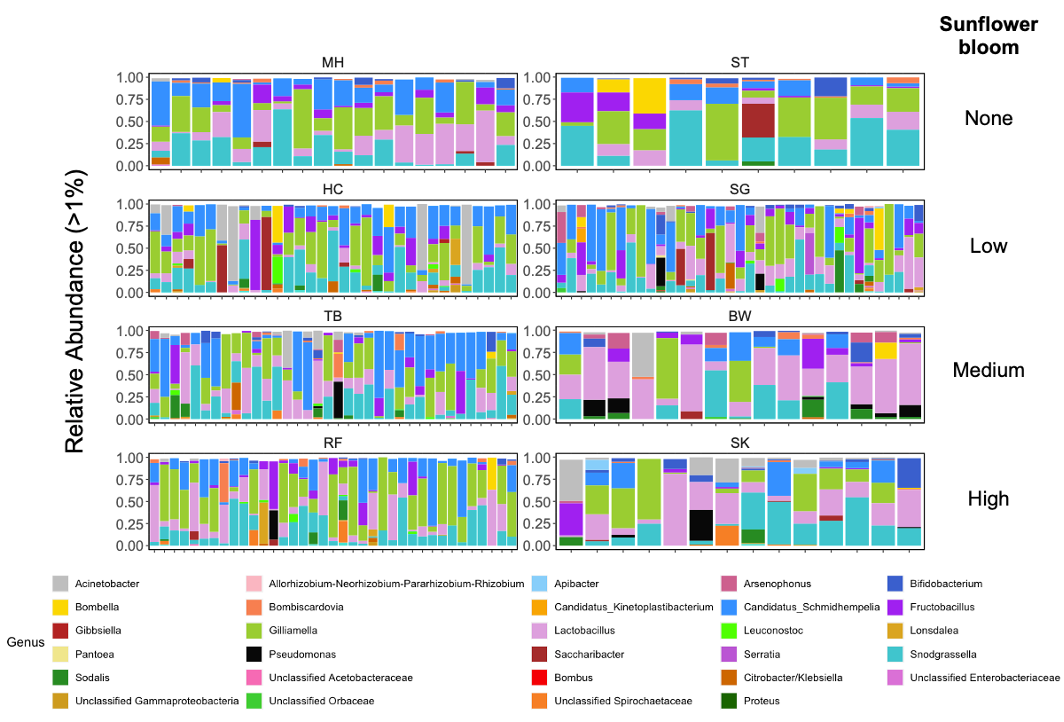
Figure 4. Neither farm floral diversity (left axis; black triangles) nor sunflower bloom category (colors) significantly affected gut bacterial diversity (right axis; circles) in Bombus impatiens workers.
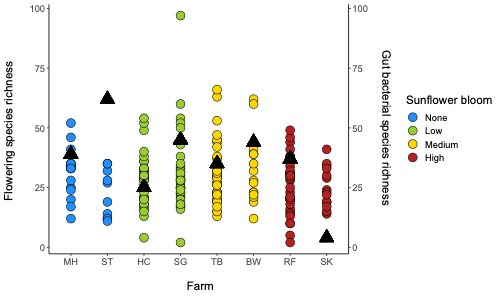
Figure 5. Bacterial community variation in Bombus impatiens, visualized as a PCoA ordinations of Bray-Curtis (left), weighted UniFrac (middle) and unweighted UniFrac (right) dissimilarities. Ellipses are 95% confidence intervals. Communities are grouped by sunflower bloom category (top row) and by farm (bottom row).
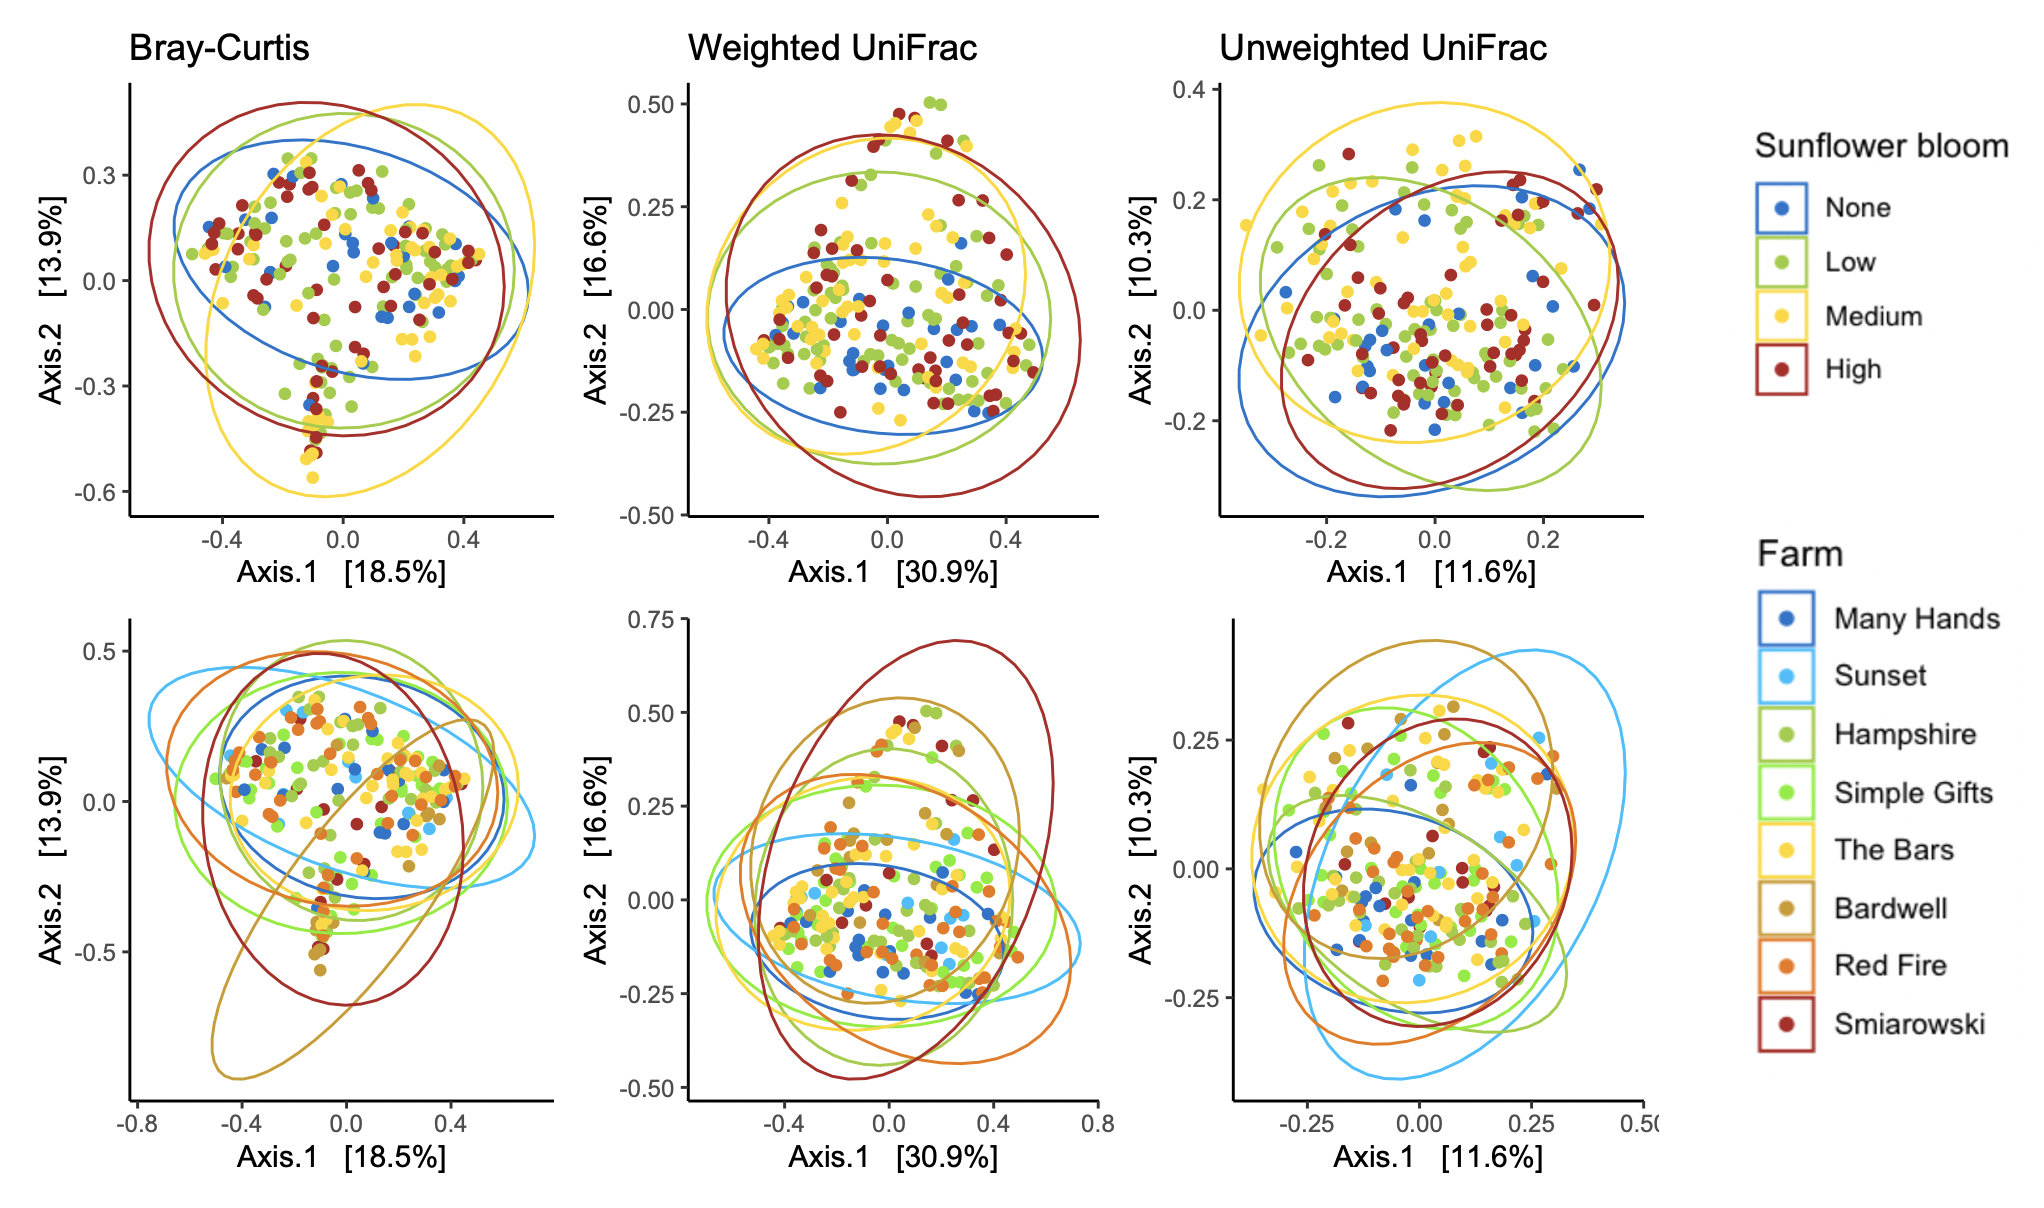
Figure 6. Relative abundance of bacterial genera (with >1% abundance) in guts of Halictus ligatus collected from four farms. Plots are ordered by sunflower bloom category. Each column represents one individual bee.
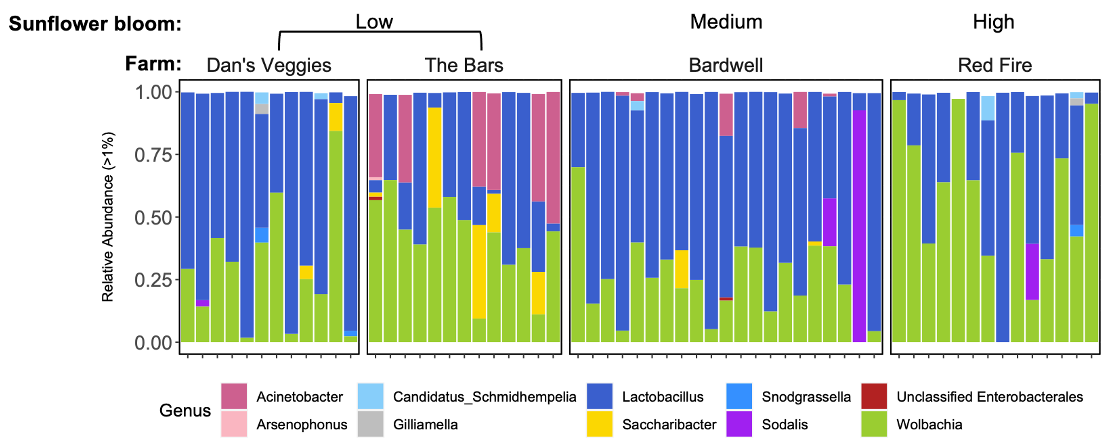
Figure 7. Farm floral diversity (left axis; black triangles) nor sunflower bloom category (colors) significantly affected gut bacterial diversity in Halictus ligatus (right axis; circles), however there was a significant effect of farm on gut bacterial diversity.
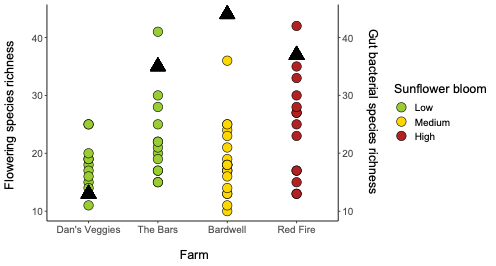
Figure 8. Bacterial community variation in Halictus ligatus, visualized as a PCoA ordinations of Bray-Curtis (left), weighted UniFrac (middle) and unweighted UniFrac (right) dissimilarities. Ellipses are 95% confidence intervals. Communities are grouped by sunflower bloom category (top row) and by farm (bottom row).
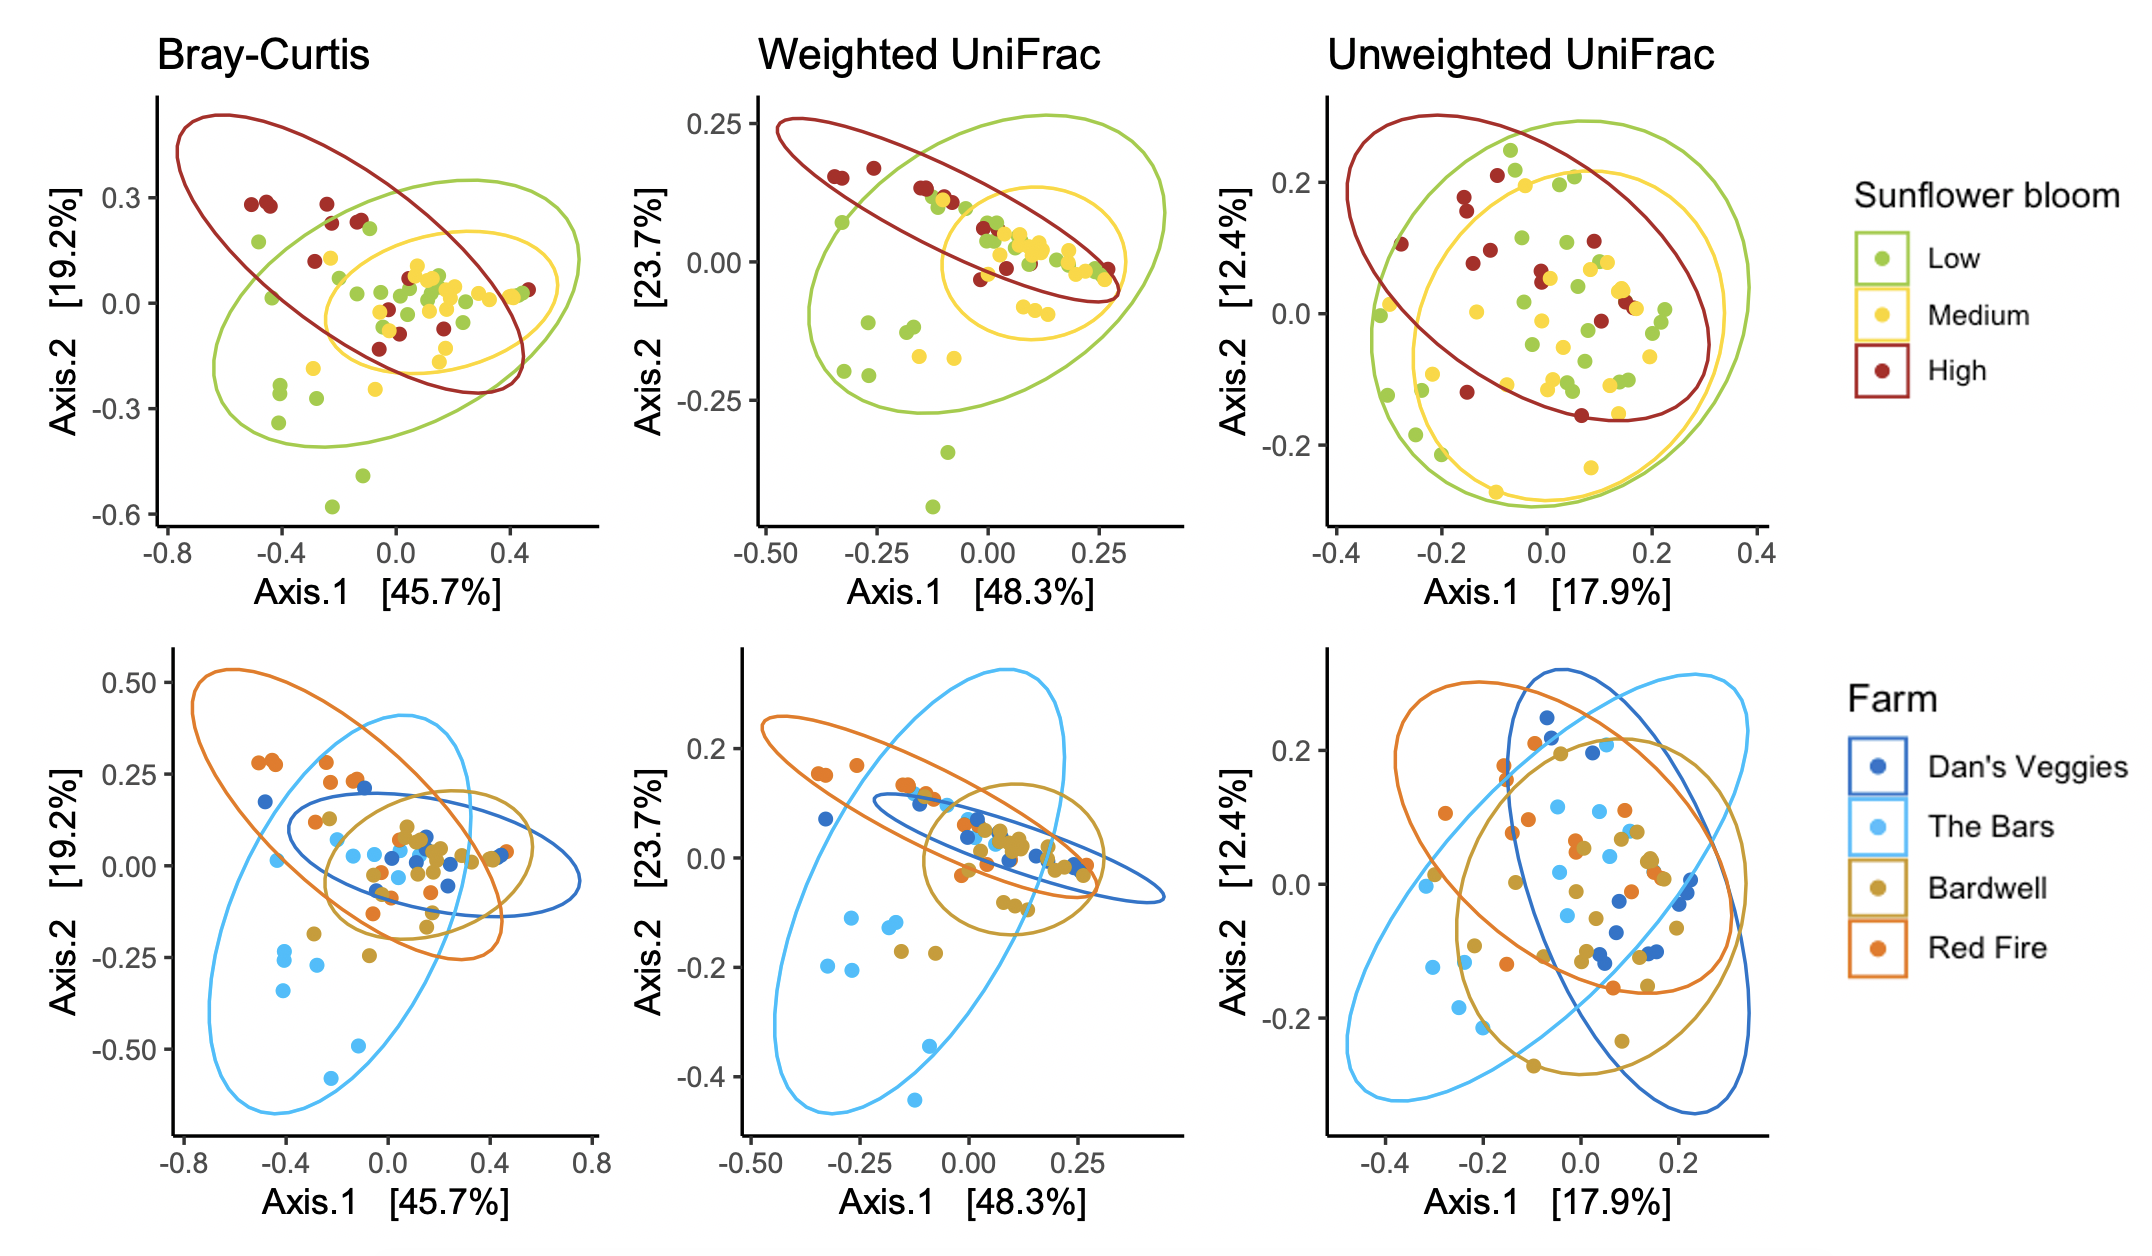
Figure 9. Bee species differed in their gut bacterial communities. Compared to M. rotundata, B. impatiens had higher (A) species richness, (B) Shannon diversity, and (C) community variation, visualized as a PCoA ordination of Bray-Curtis dissimilarities. Ellipses are 95% confidence intervals. The effect of diet on bacterial species richness in B. impatiens depended on worker age (D, E). Diet did not significantly affect bacterial species richness in M. rotundata (F, G). (Diets are D = Dandelion, H = Hawthorn, S = Sumac. Diets 1, 2, and 3 refer to the number of pollen species.)
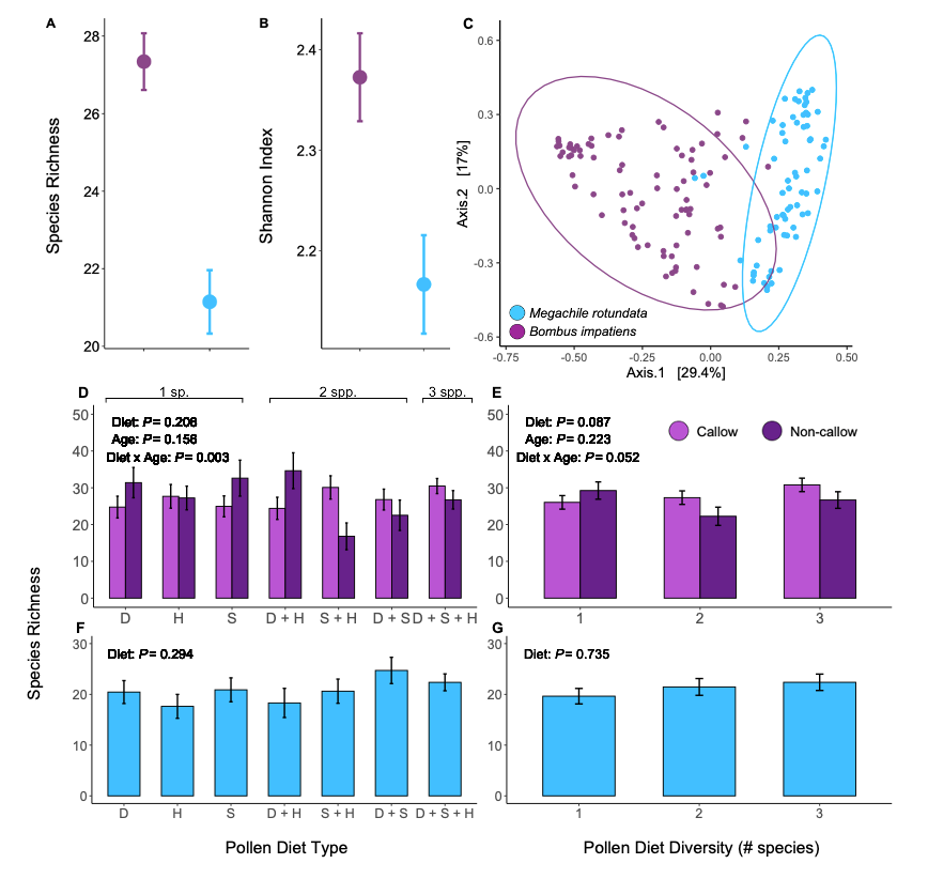
Figure 10. Relative abundance of genera (with >1% abundance) across the seven different diet treatments in B. impatiens (A) and M. rotundata (B). Plots are ordered by diet treatments (D = Dandelion, H = Hawthorn, S = Sumac). Each column represents one individual bee.
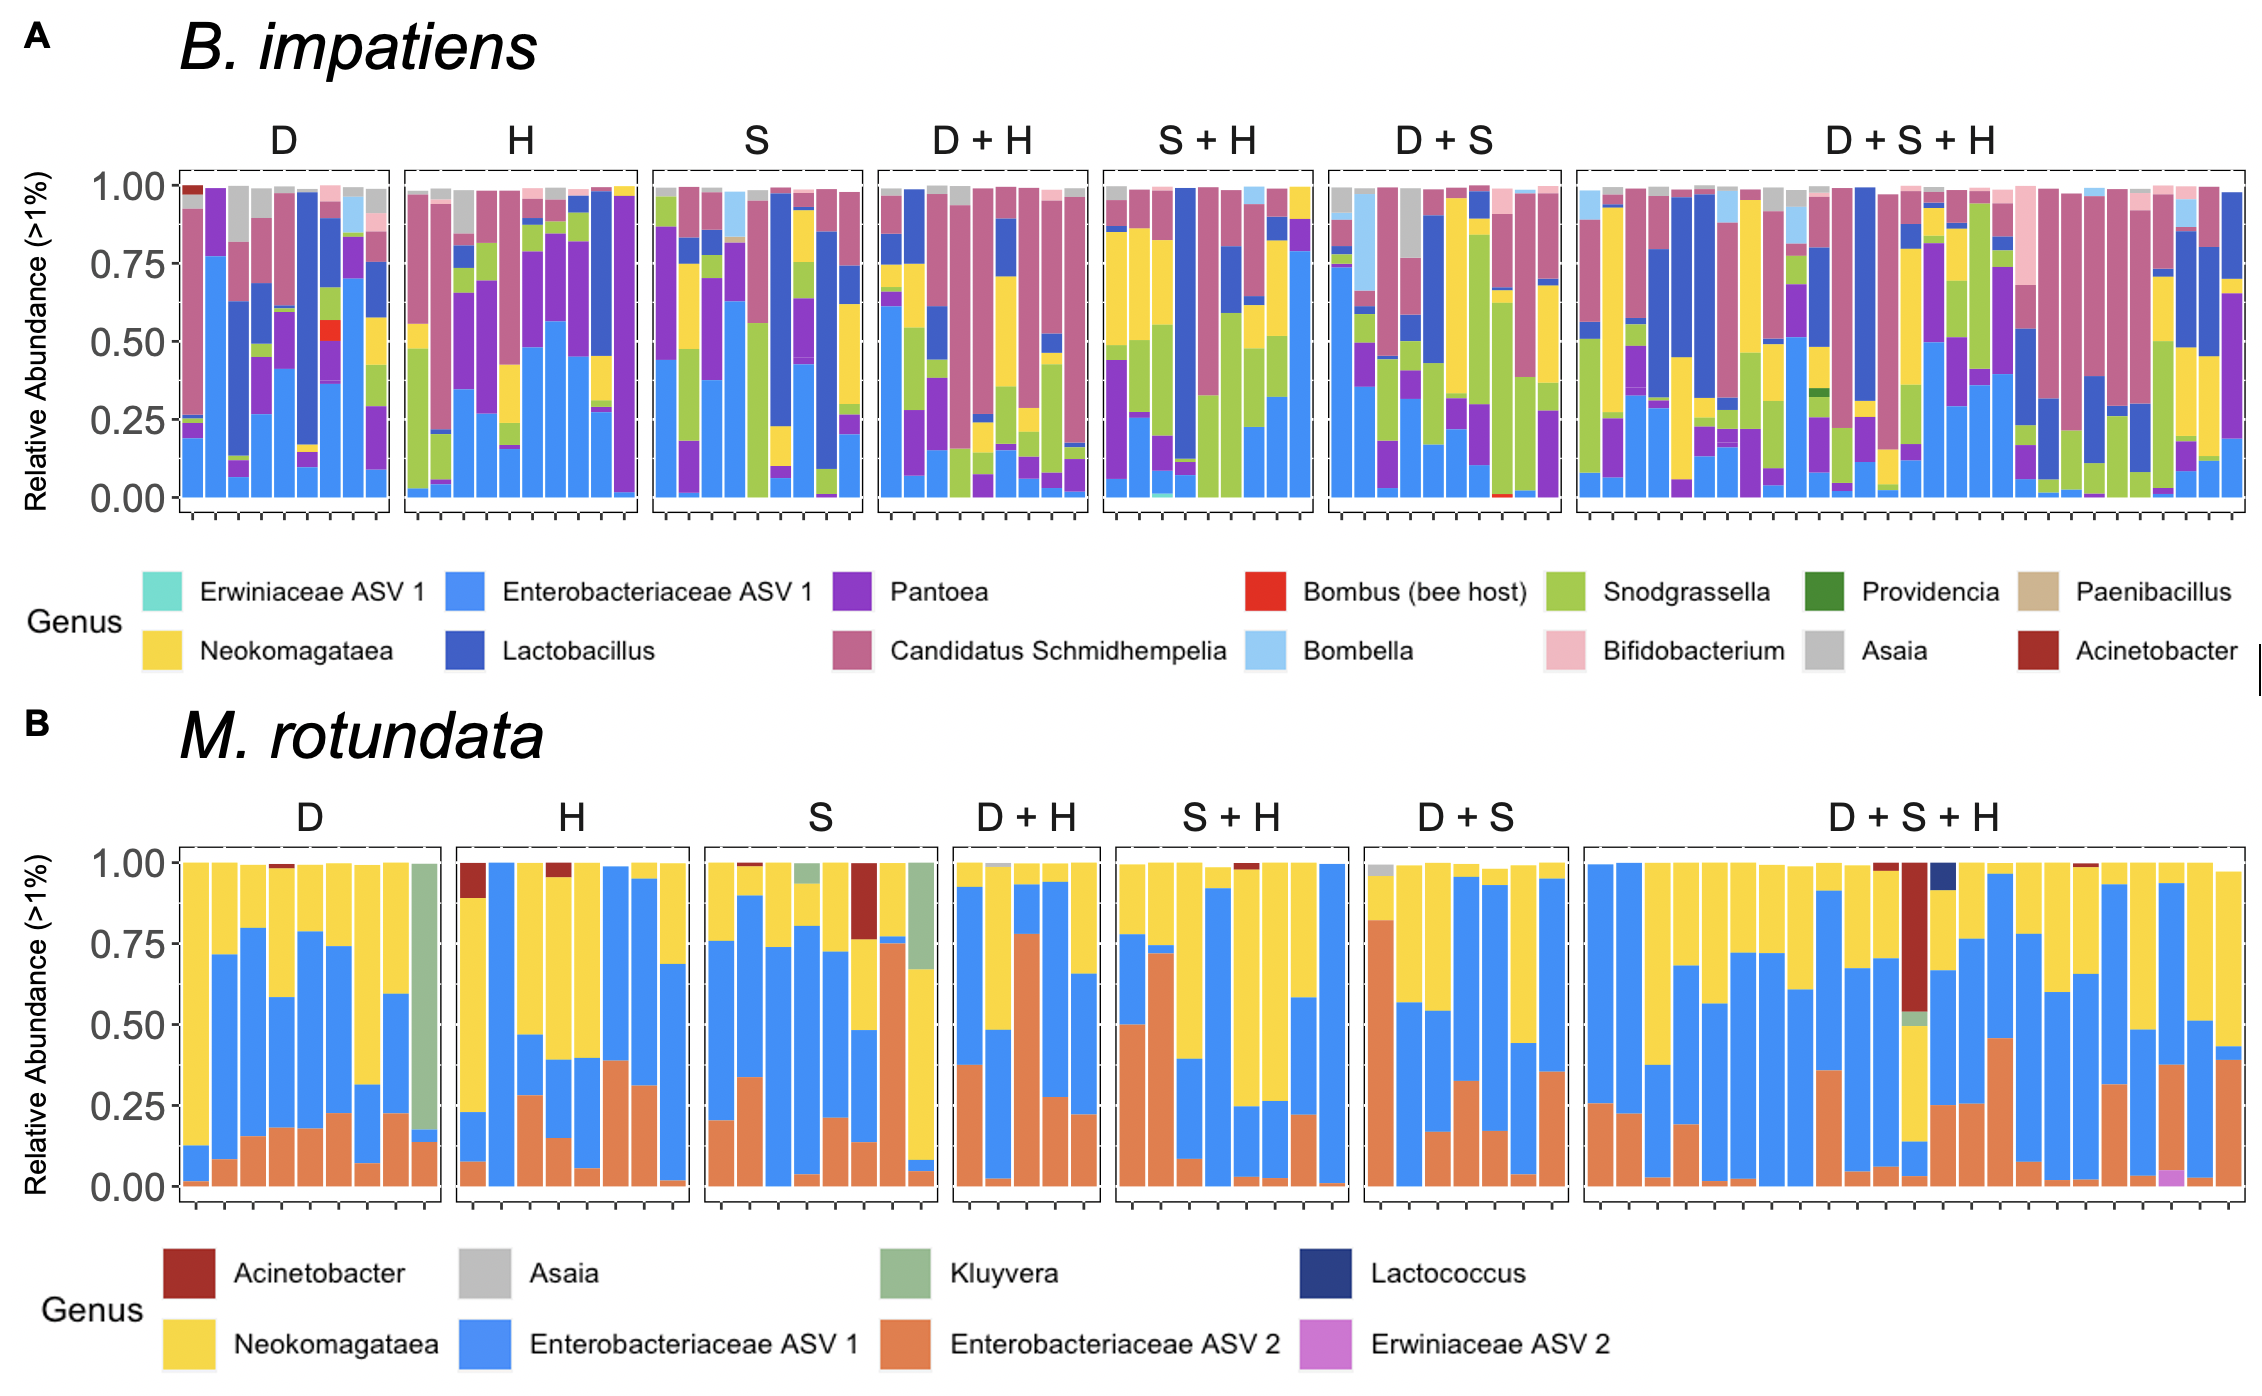
Figure 11. Pollen diets did not significantly affect melanization response in B. impatiens, as measured by percent melanization (A) or the proportion of samples that were categorized into three melanization levels (B). Percent melanization means are model estimates, produced with emmeans; error bars are standard error. (Melanization levels are low = 0-10%, 11-24%, and >25%. Diets are D = Dandelion, H = Hawthorn, S = Sumac.)
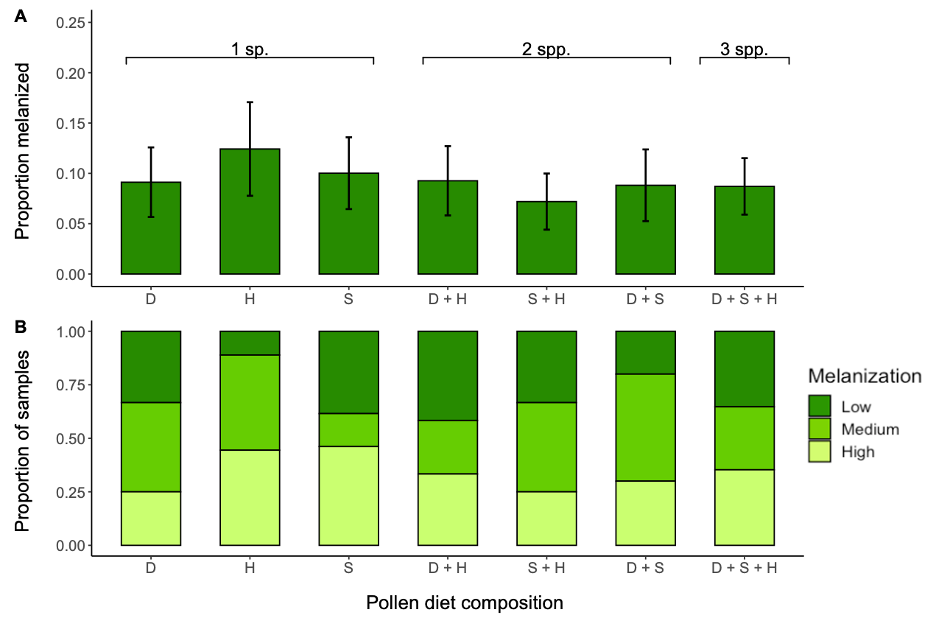
Our results suggest that bee gut microbiomes are influenced by host species, landscape, and sometimes diet, however these differences are not correlated with dietary diversity. Further, our results suggest that when the available diets are low diversity, such as the monofloral diets in the lab experiments and the farms with low floral diversity, we found bees had similar gut microbiomes to those fed diverse diets and collected on the high diversity farms. Given that sunflowers provide medicinal benefits to bumble bees, understanding how sunflower monoculture landscapes may otherwise affect bee health is an important next step before recommending sunflower plantings to promote bee health. Our results suggest that a sunflower pollen diet and sunflower-dominated landscapes with low floral diversity provided enough nutrition for both bumble bees and sweat bees to maintain diverse gut microbiomes. Further, we found that low diversity diets did not negatively impact immune function in bumble bees. While low floral diversity may negatively impact bee species diversity, our research shows that low floral diversity does not negatively impact the gut microbiomes or immune system in these generalist species. We conclude that farmers may use sunflowers as part of diverse wildflower plantings on/near their farm to promote bee health.
Education & outreach activities and participation summary
Participation summary:
I created a website to document and disseminate the research activities associated with this grant. I have shared this website with the farmers involved and have linked to this website on the UMass Pollinator Extension Page as well as the Adler Lab home page. My research website can be found here and my blog post about collecting bees on the farms in 2020 can be found here.
One farm I visited, Natural Roots, featured my research in a newsletter and explained my project to share with the broader community.
Additionally, I gave a talk about native pollinators for the Hatfield, MA agricultural advisory committee, which can be found here.
Project Outcomes
This study adds to the growing body of research about the costs and benefits of sunflower pollen for bee health. Our research on sunflower and other Asteraceae pollen has shown that it reduces a common gut pathogen in the common eastern bumble bee, B. impatiens, but not three other bumble bee species (Fowler et al. 2022). These flower species appear to reduce this pathogen in part due to its spiny exine (Figueroa et al. 2023), which we hypothesize disrupts the pathogen cell attachment to the gut lining. Our work here shows that sunflower pollen's medicinal effect is not mediated by the gut microbiome. Our other studies show that pollen from sunflower and other Asteraceae species is relatively low in protein and can result in reduced offspring production (Fowler et al. 2022), therefore, even though high-sunflower diets did not negatively affect adult physiology (immunity, Fowler et al. 2022; or gut microbiomes, current study and unpublished data), I still recommend that sunflowers be planted as part of a diverse, native plant community, rather than a monoculture, to promote both bee reproduction and growth, as well as pollinator diversity. Our research will hopefully encourage farmers to grow sunflowers to their farms, whether as part of wildflower strips, used as cover crops, rotation crops, or cut flowers.
References
Figueroa, L. L., Fowler, A., Lopez, S., Amaral, V. E., Koch, H., Stevenson, P. C., … Adler, L. S. (2023). Sunflower spines and beyond: Mechanisms and breadth of pollen that reduce gut pathogen infection in the common eastern bumble bee. Functional Ecology, (November 2022), 1–13. doi: 10.1111/1365-2435.14320
Fowler, A. E., Giacomini, J. J., Connon, S. J., Irwin, R. E., & Adler, L. S. (2022). Sunflower pollen reduces a gut pathogen in the model bee species, Bombus impatiens, but has weaker effects in three wild congeners. Proceedings of the Royal Society B: Biological Sciences, 289(1968). doi: 10.1098/rspb.2021.1909
Fowler, A. E., Sadd, B. M., Bassingthwaite, T., Irwin, R. E., & Adler, L. S. (2022). Consuming sunflower pollen reduced pathogen infection but did not alter measures of immunity in bumblebees. Philosophical Transactions of the Royal Society B: Biological Sciences, 377(1853). doi: 10.1098/rstb.2021.0160
I learned a lot while conducting this project about the implications of this research for both bee health and biodiversity, but also for the farmers in my community. I learned that most of the farmers that I interacted with were eager to learn more about bee pollinators and had desire to support bee populations on their land. Fortunately, many farmers and home owners are happy to plant sunflowers as they are also popular for cut flowers and scenic backdrops. For example, Red Fire farm plant sunflowers in a maze for farm visitors and Valley View farm had a large sunflower field as a backdrop for their wedding venue. This indicated that there is already a high demand for sunflowers and that it would be relatively easy, cheap, and enticing for farmers and homeowners to plant more of them to also promote bee health.
My next career step is to work as a postdoctoral researcher at the Smithsonian Conservation Biology Institute, where I will continue performing research focused on animal diets and gut microbiomes with hopes of improving wildlife conservation efforts.