Final report for LNE19-372
Project Information
Livestock graziers in the Northeast cannot escape compaction in their pastures, since animals go out to pasture in all-weather, even when the soil is damp and more prone to compaction. This study, done by educators of Cornell Cooperative Extension, found that the damage to pasture productivity doesn’t come from intermittent compaction, but comes from many years of compaction. When compacted, the soil’s air and water pores are reduced so that functions of biology, water retention, and root elongation are also reduced. If the pasture is rested or switched to hay production the pores return and no change in productivity is seen. Pasture productivity is reduced when compaction is allowed to remain for many years and the grazing sward (the species of plants in the pasture) change to ones that can handle compacted soils such as sedges, broadleaf weeds with taproots, and shallow rooted grasses that are less productive.
The Northeast SARE project was titled “Identification and Remediation of Compaction on Northeast Pasture Soils”. We first set up “Train The Trainers” for educators who worked with graziers and then followed up with these educators to hold on-farm outreach events with their graziers. There were fifteen events held across five states during 2019 and 2021. These were intended to help graziers identify compaction in their pastures. The project team also researched a technique for graziers to monitor compaction in their pastures. The penetrometer is a readily available tool to measure compaction, but it cannot be used to monitor compaction since its readings are highly affected by the changing moisture of the soil. A soil will have more or less resistance on different days as the soil dries out or becomes damp. We hypothesized that possibly using a ratio of penetrometer readings of two points in the pasture might be a way to monitor any changes in compaction. Our report contains the full description and results of the “Pasture Compaction Ratio” (PRC). The PRC is obtained by collecting five readings (lbs./sq. inch) of the top six inches of the pasture; these are then averaged to determine Pasture Resistance. Collect five readings under the fenceline to determine Fenceline Resistance. Divide the Fenceline Resistance number by the Pasture Resistance number to determine the PCR. If over a year, the ratio moves closer to 1.0, it means it is closer to the fence line compaction, which is the optimum resistance. If the number reduces from the previous year, it means it is becoming more compacted and management changes should be explored.
There were several primary take-aways from this project. These include:
- The furtive nature of pasture compaction: The declining productivity of the pasture sward happens after many years of neglected compaction, so the damage is done without the grazier even noticing it.
- Even the most compacted pasture soils recover in a matter of months if management changes are made. If the species that make up the sward are impacted, then a much longer time or reseeding will be needed.
- The Pasture Compaction Ratio was successful on monitoring changes in pasture compaction.
Twenty livestock grazing operations change their grazing management to adopt practices known to reduce compaction on 1,000 acres of pasture.
How This Study Started
This project leader was working on another SARE-funded study, the planting of brassicas into fall pastures to improve the nutrient density of fall swards (https://projects.sare.org/project-reports/one14-197/. He noticed that the soil under the fence in one of the study paddocks was about six inches higher than the soil in the pasture. He also noticed the sward under the fence was greener and had only cool season grasses compared to the pasture’s which included broadleaf weeds and sedges. Knowing that sedges grow in oxygen-limiting soils, He realized that soil compaction was limiting the productivity of this pasture.
Reading previous research on soil compaction it was learned that unmanaged compaction over many years causes a very slow and damaging effect on the functions of the soil and in turn the species of plants that grow in the soil. It was further learned that animal compaction can surpass a tractor’s compression on the soil when measured in pounds per square inch. Since the total weight of the animal was much less than a tractor the compaction did not travel as deep into the soil so was much easier relieved. This project sought to address the issue of pasture compaction from two directions: First through extension work to make Northeast Graziers aware of the issue of compaction in their pastures. Secondly our project sought to research a technique to use penetrometer readings to allow graziers to monitor compaction in their pastures from year to year and recognize when a change in management was needed to not affect the function of the pasture soil. These two objectives were accomplished by the following activities:
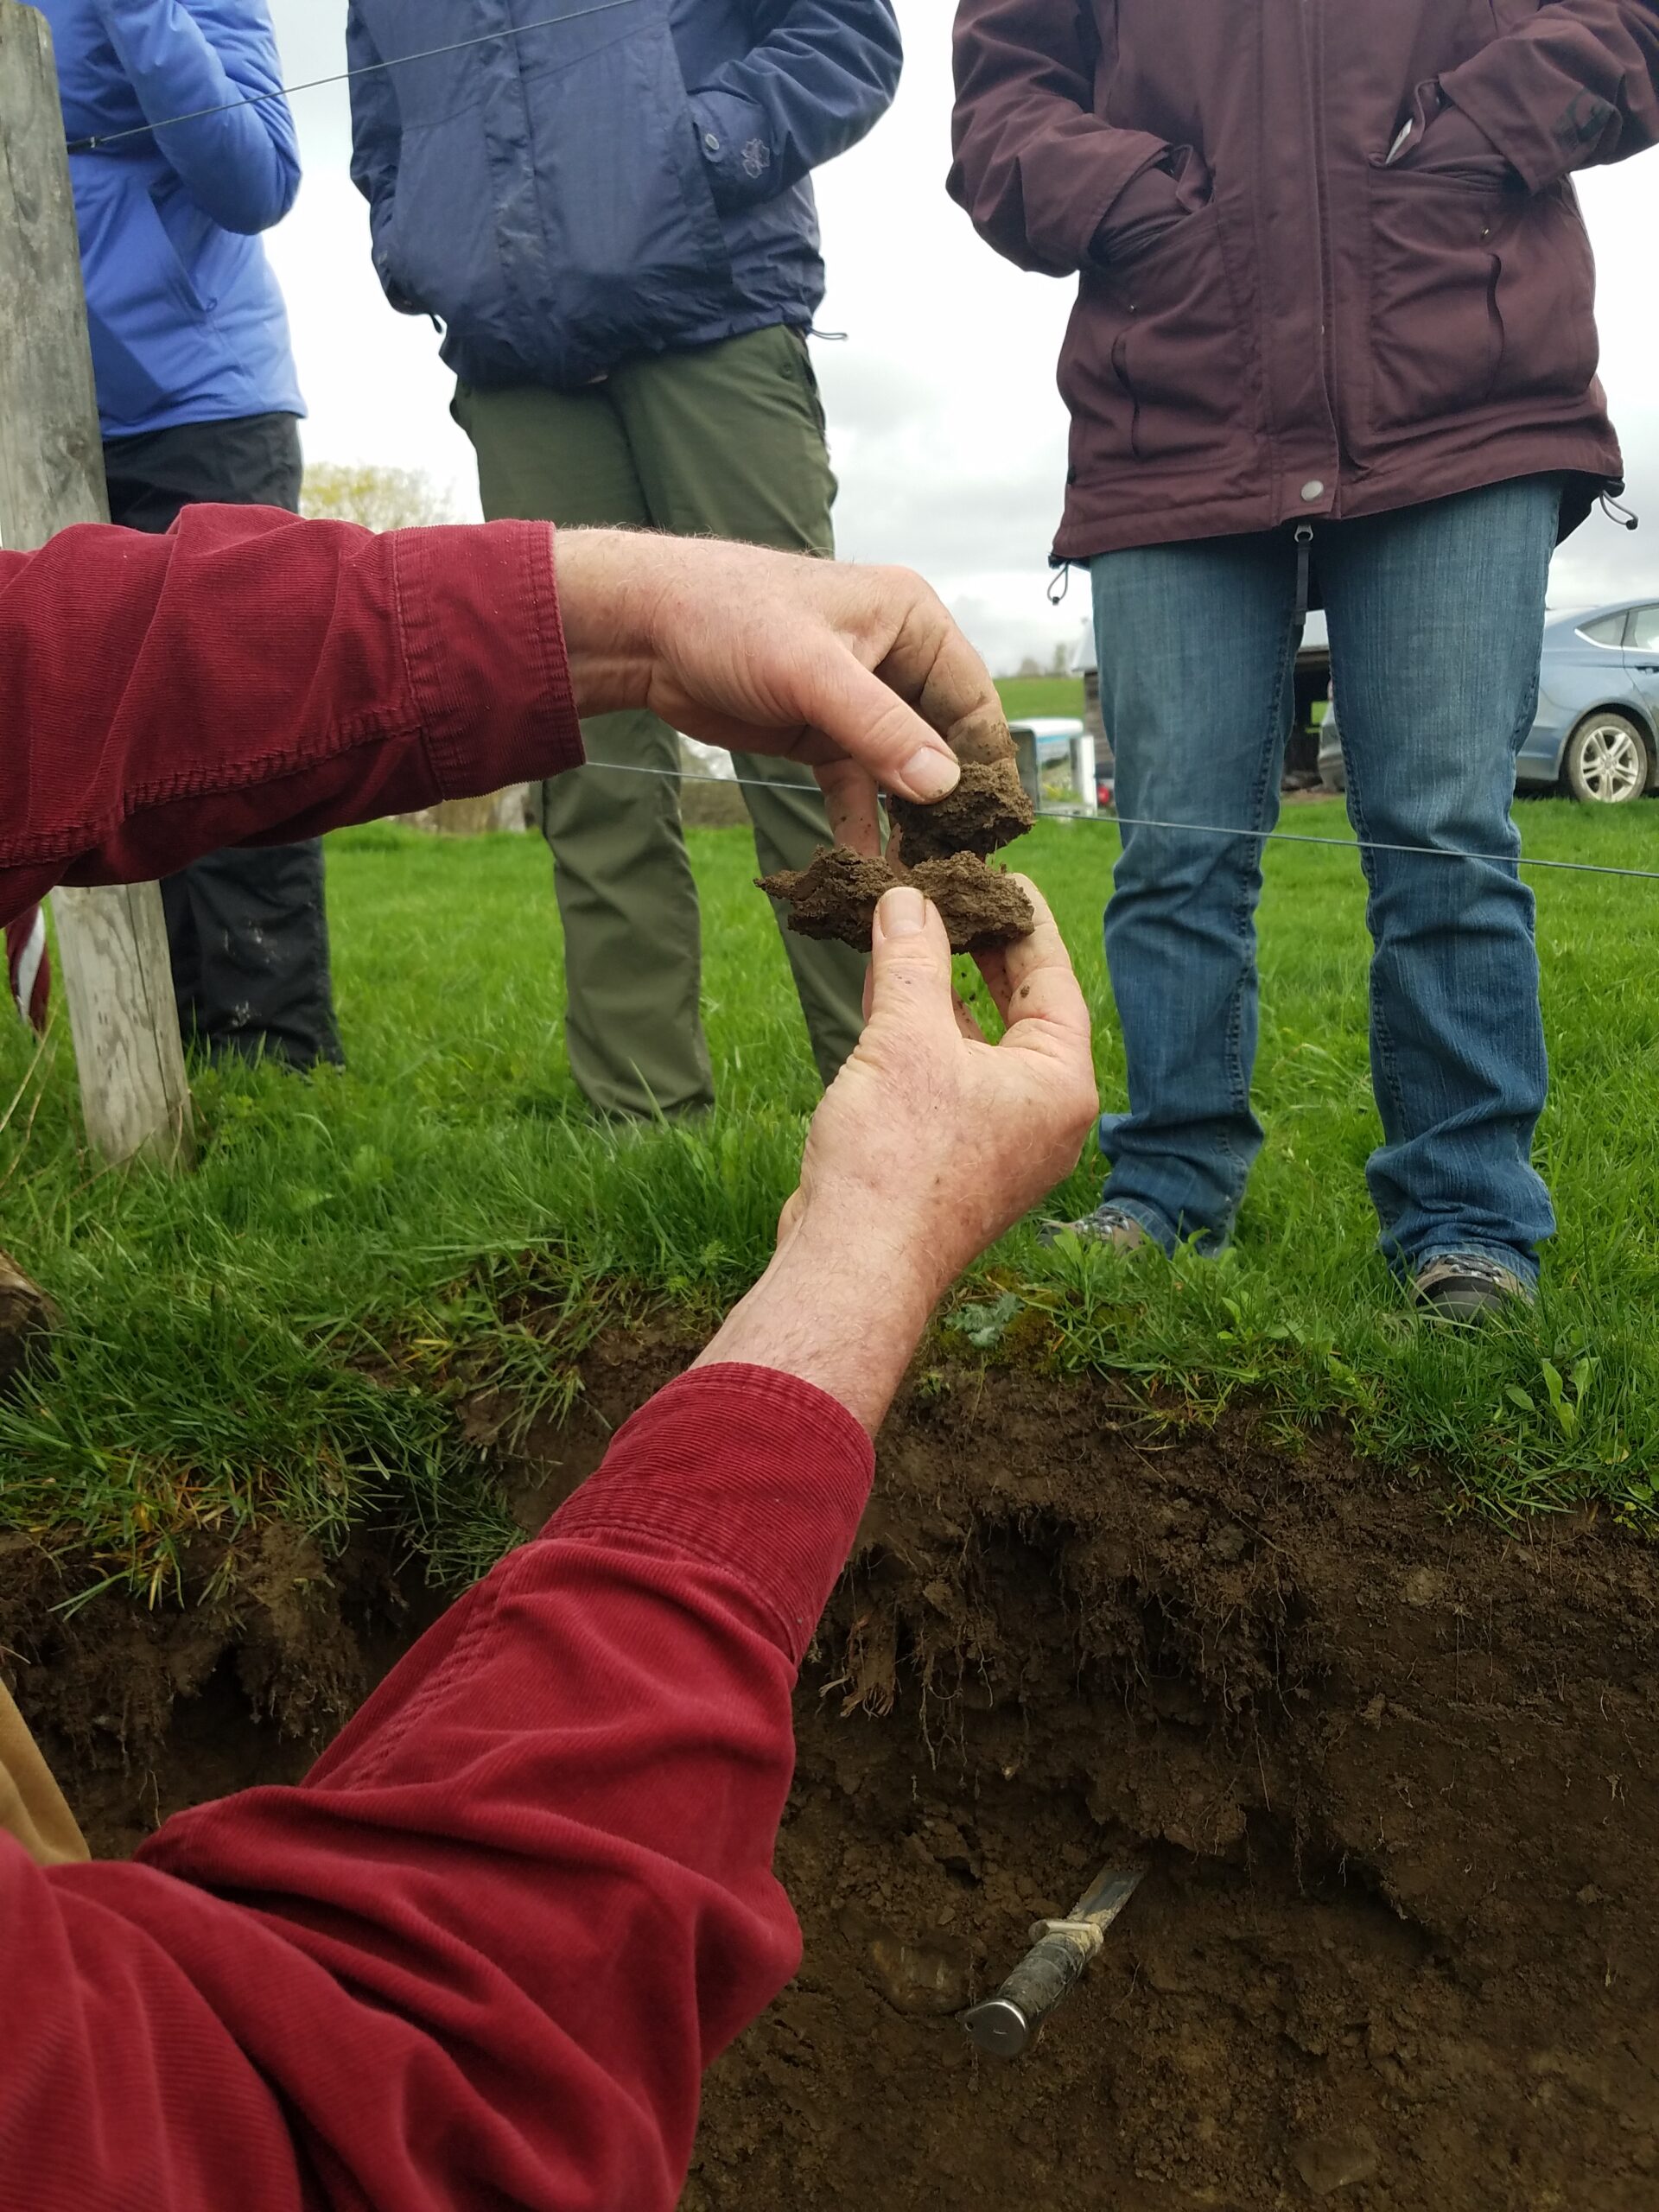
- The project held two “Train the Trainers” events in 2019. Seventeen educators from NY, ME, VT, PA, and NH attended these trainings. The first part of the day included presentations by the project’s PI and two PhD soil scientists. In the afternoon we went to a local pasture to look at methods to identify compaction above ground and below ground in a soil pit dug for each event.
- The seventeen trainees agreed to host a pasture walk in their region and invite the New York Soil Trailer to demonstrate soil health principals including the effects of soil compaction. Due to the interruption caused by COVID regulations we didn’t hold any events in 2020 but with the aid of a no-cost extension of the project we were able to hold fourteen events by the end of the project.
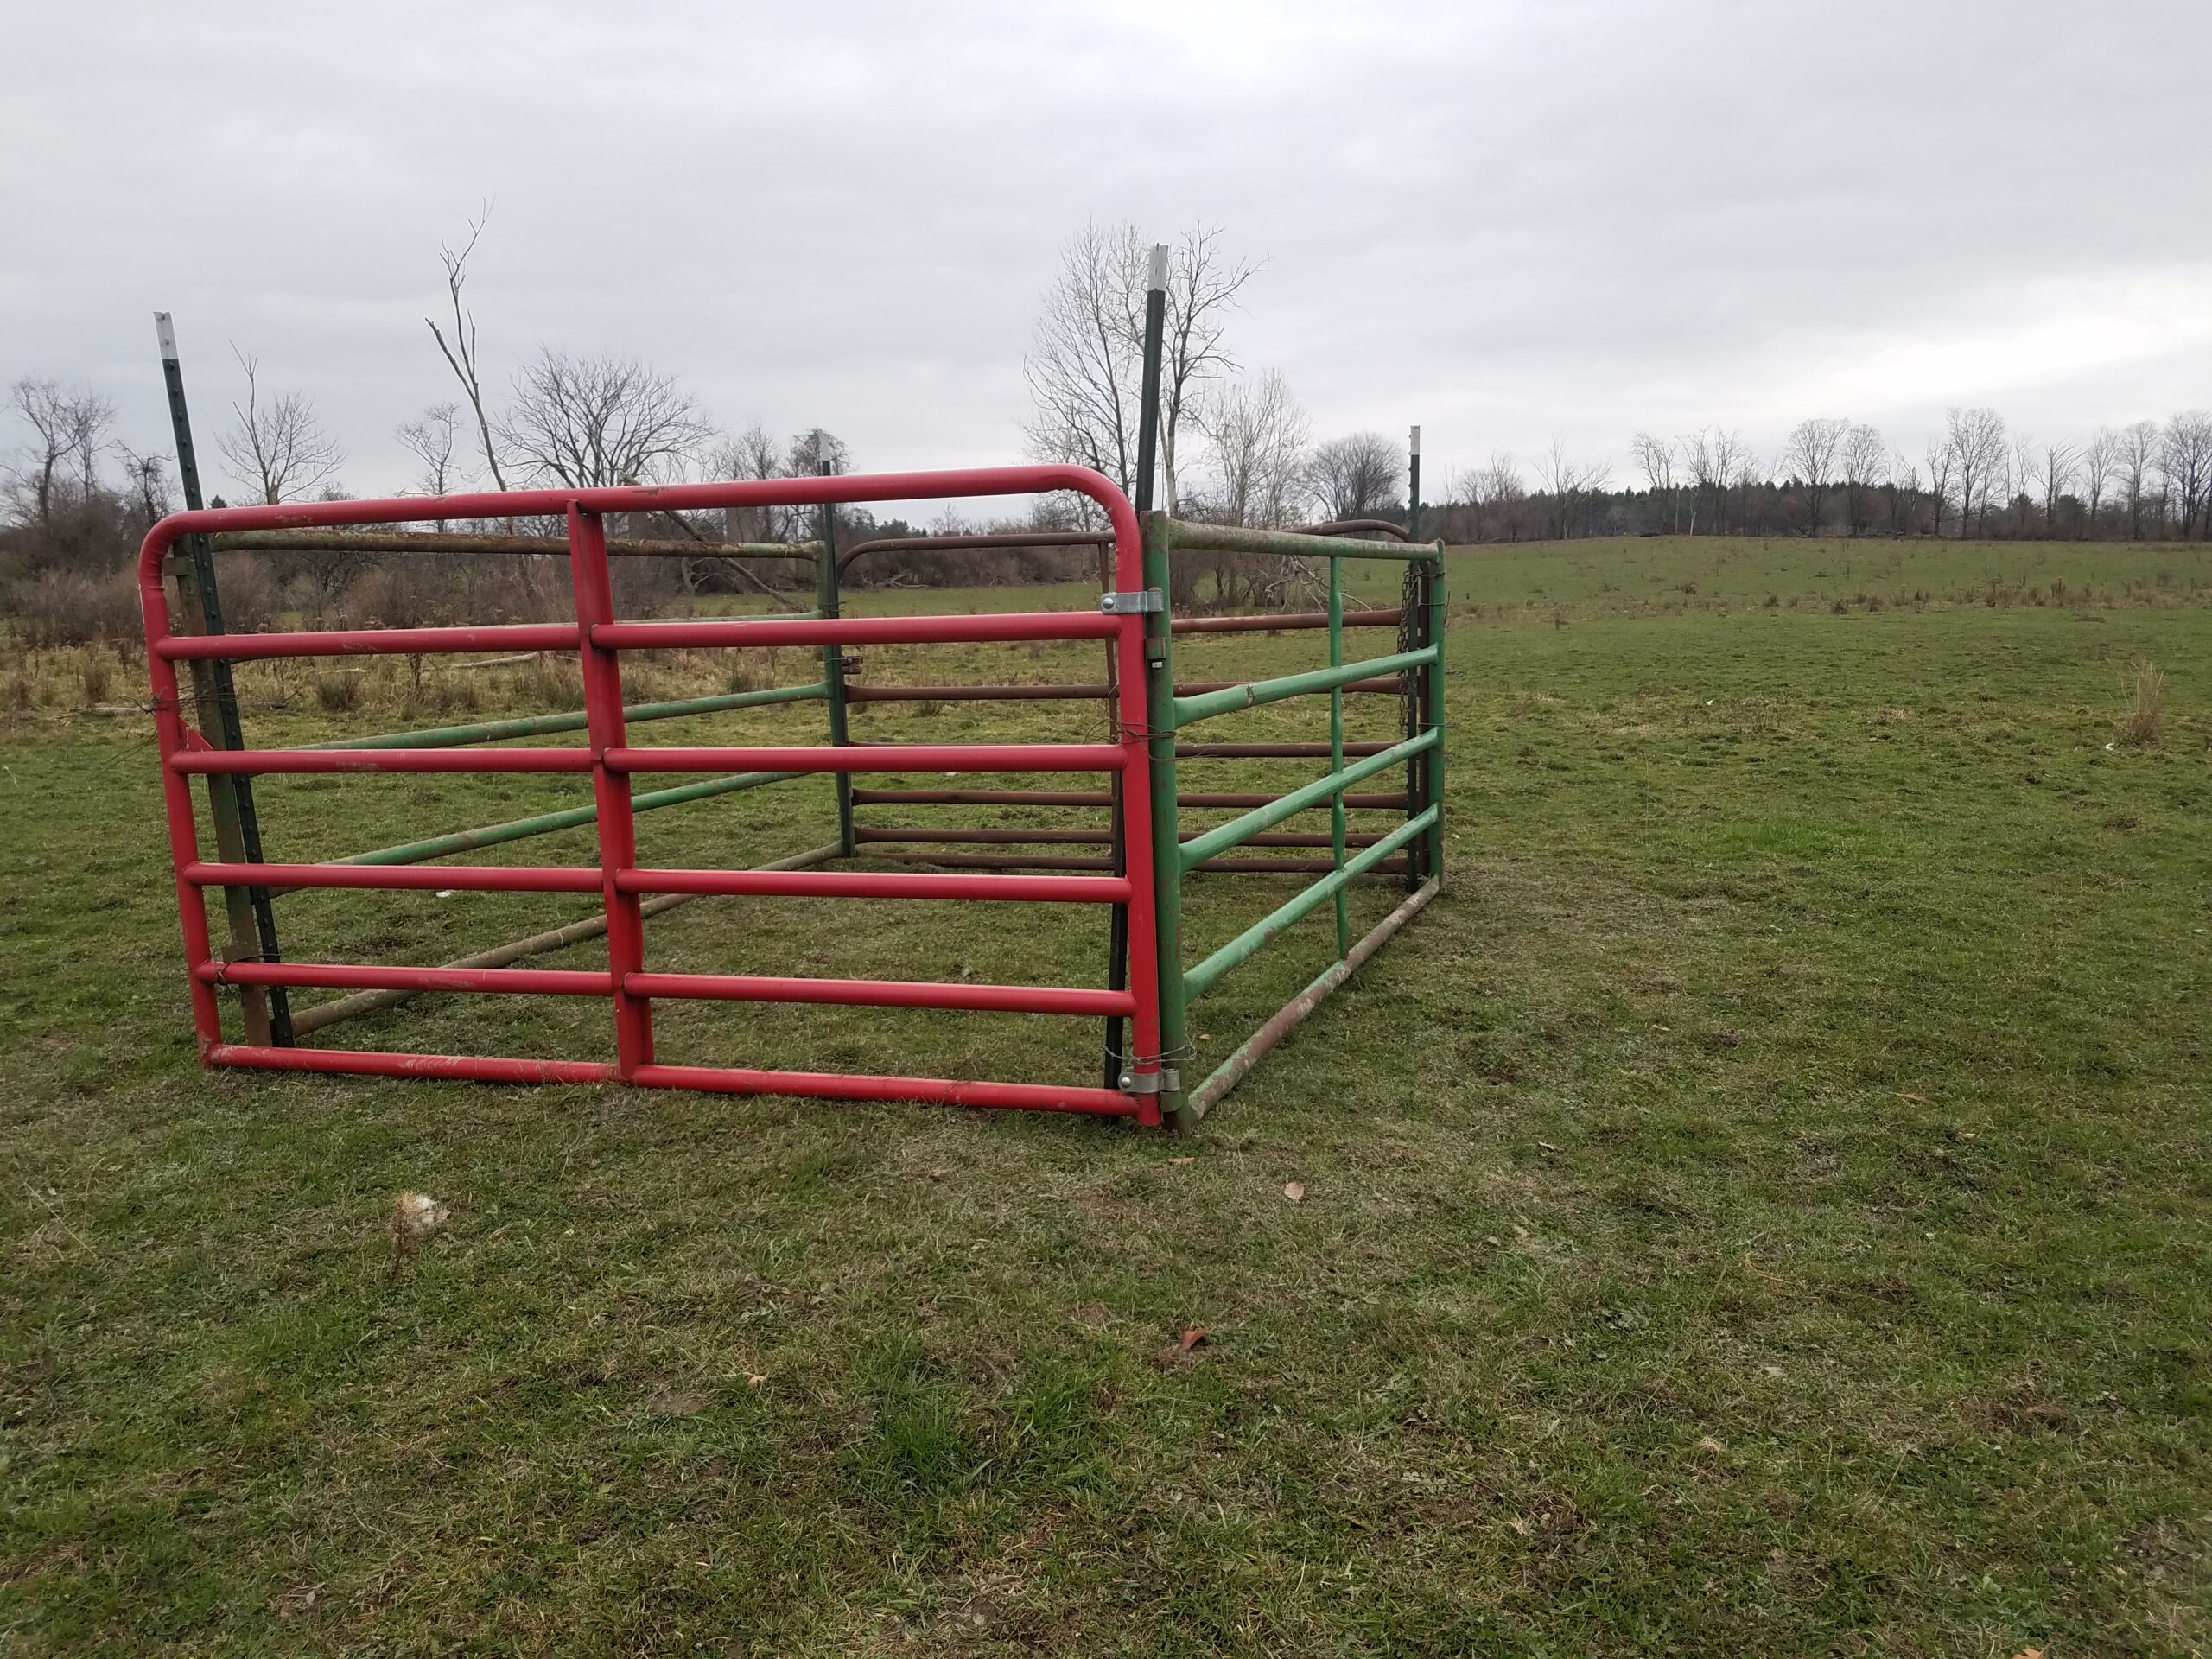
- The research objective to find a way to monitor compaction in a pasture consisted of using a ratio of penetrometer readings of two points within twenty feet of one another to arrive at a ratio that could be used to monitor pasture compaction from one year to another. In order to collect data on a change in management we installed an enclosure on a severely compacted pasture and took penetrometer readings over two years. A description of the study can be found at: https://scnydfc.cce.cornell.edu/submission.php?id=1477&crumb=soil|7
Discussion of Pasture Compaction Ratio Data
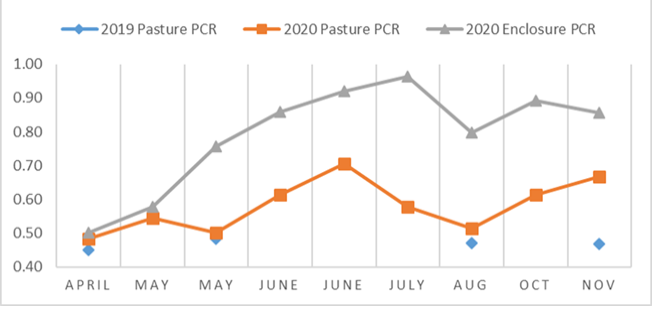
Each point on the graph above represents the ratio of the penetrometer readings for points in the pasture or enclosure and the fenceline. All readings were taken within a 30-foot circumference.
The Y axis shows the range of the PCRs. The highest point 1.0 would mean that the penetrometer reading for the pasture or enclosure, was equal to the fenceline for that date. A reading of 0.5 would mean that the penetrometer reading for the pasture or enclosure was two times the fenceline.
The X axis is the date of the penetrometer readings. There were fewer readings taken in 2019
Some of the interesting results shown in Figure 3 are as follow.
- The pasture PCRs for 2019 and 2020 are similar which would be expected since no management changes happened.
- The three PCR points in April of 2019 and 2020 were essentially the same. After May the enclosure's ratio increased and stayed elevated for the rest of the year. A rising ratio indicates less compaction and meant that the enclosure's soil resistance was moving closer to the fenceline's resistance.
- The separation of the two lines of PCR for the enclosure and pasture is an indication that the use of the PCR is capable of monitoring management changes. Switching the management within the enclosure to mimic hay production reduced the compaction of the soil. And the PCR was able to monitor how long it took to improve.
- I would have expected that the reduction in compaction in the enclosure would have shown up in April of 2020 due to frost and heaving of the soil. The reduction in compaction happening after the beginning of May indicates that possibly it occurred as a result of the pasture sward growing longer roots and/or the increase in soil temperature and biological activity causing the (aggregate) soil's air and water spaces to expand.
- I can't explain why the 2020 PCRs for pasture and enclosure deviate in August. Why did they both drop? It was suggested that the one measurement I failed to track was soil moisture. I assumed that moisture would change equally but if the pore spaces increase as the soil is less compacted that soil would have more water in those pores.
The reduction in compaction in the enclosure happened within a few months. What didn't change was the sward of bluegrass and other lower productivity species brought about by years of compaction in the pasture.
The fact that the shallow compaction caused by livestock will dissipate within months shows that properly managed grazing can maintain a healthy soil. The damage comes when compaction is left unchecked over many years with the result of lower productive grazing species entering the sward.
Cooperators
- (Educator)
- (Educator)
- (Educator and Researcher)
- (Researcher)
- (Researcher)
Research
To measure soil compaction, the penetrometer is a readily available tool. When pushed into the soil, it measures the soil’s resistance. Its meter indicates the pounds per square inch (PSI) of resistance at the tip. The limitation of the penetrometer reading is that the resistance is highly affected by the changing moisture of the soil. A soil will have more or less resistance on different days as the soil dries out or becomes damp. This has precluded the penetrometer from being a reliable monitoring tool.
This project hypothesized “that by using a ratio of penetrometer readings within a short distance (10-20 feet) the ratio would remain constant since the soil’s moisture would change equally”. We refined this hypothesis for pasture compaction since we could use the unique conditions of pastures where the soil which is impacted by grazing animals is a short distance to the fenceline which is not impacted by animal or machine-based compaction. If our hypothesis were true we could use the ratio, which we decided to call the “Pasture Compaction Ratio” or PCR, as a monitoring technique. When comparing the PCR for a paddock from year to year the grazier would be able to tell if the pasture compaction was moving towards the fenceline compaction or away from it.
How to Compute the Pasture Compaction Ratio (PCR) Using a Penetrometer collect five readings (lbs./sq. inch) of the top six inches of the pasture; these are averaged to determine Pasture Resistance. Divide the Pasture Resistance number by the average of five readings collected under the fenceline to determine Fenceline Resistance. Divide the Fenceline Resistance number by the Pasture Resistance number to determine the Pasture Compaction Ratio (PCR).
PCR = Fenceline Resistance/Pasture Resistance.
As stated earlier, the Pasture Compaction Ratio (PCR) would utilize the same day ratio of penetrometer readings from a pasture and a nearby fenceline. The goal of the PCR was to use the ratio to monitor the level of compaction in the soil from months or years earlier. We applied two approaches to prove the above hypothesis.
- The first approach was to evaluate the repeatability of the PCR throughout a season. We took regular penetrometer readings from multiple paddocks and looked for repeatability of the ratio as the moisture changed during the season and from year to year.
- What we expected to see was that the penetrometer readings would change each visit due to changes in soil moisture, but the ratio would remain constant.
- The second approach was to evaluate using the PCR to monitor a change in pasture management. To do this we selected a severely compacted paddock, and collected PCRs for the 2019 season then installed an enclosure in that paddock where we change the management from grazing to hay production. Then collect the PCRs for the pasture and the enclosure to assess whether the PCR showed any differences between the two areas.
- What we expected to see was that the paddock PCR would stay the same but the enclosure’s PCR value would move closer to 1.0. The way the ratio was calculated a value of 1.0 would mean that the area had the same compaction reading to the fenceline or essentially that there was no compaction.
Plot Design
To test the first approach, eleven paddocks were selected to collect monthly penetrometer readings from. The monthly readings included readings from the area of the paddock within 15-20 feet from a fenceline, plus readings from under the fenceline. The paddocks were selected on the criteria that they had received no tillage for more than five years. The criteria for the fenceline was that they had been in place for more than five years. Five penetrometer readings were taken at the six-inch depth for each area and then averaged to become one point on the graphs. Obviously many more that five were taken at each area since rocks were common at all our sites.
To test the second approach, we selected the “Adams” paddock which had been severely compacted due to being continuously overgrazed for more than 20 years. The paddock was 35 acres with by 40-60 beef animals. As expected in overgrazed pastures, there was increased traffic by the animals as they got only small bites from the sward that consisted of mostly bluegrass, Dutch clover and other forbs. The increased traffic lead to increased compaction. Due to the declining productivity of the pasture, the animals in the trial pasture mostly relied on stored hay brought into the pasture. The 2019 readings for the “Adams” paddock were the ratio of the paddock and under the fenceline. In November of 2019 a ten-foot by ten-foot enclosure was installed to exclude animals. During 2020 the management of the enclosure mimicked hay production cutting the sward to 4-5 inches twice during the season. In 2020 the readings included the paddock, the enclosure, and the fenceline. All points were within 20 feet of one another. The PCRs for the paddock and the enclosure utilized the same fenceline reading.
2019 SEASON
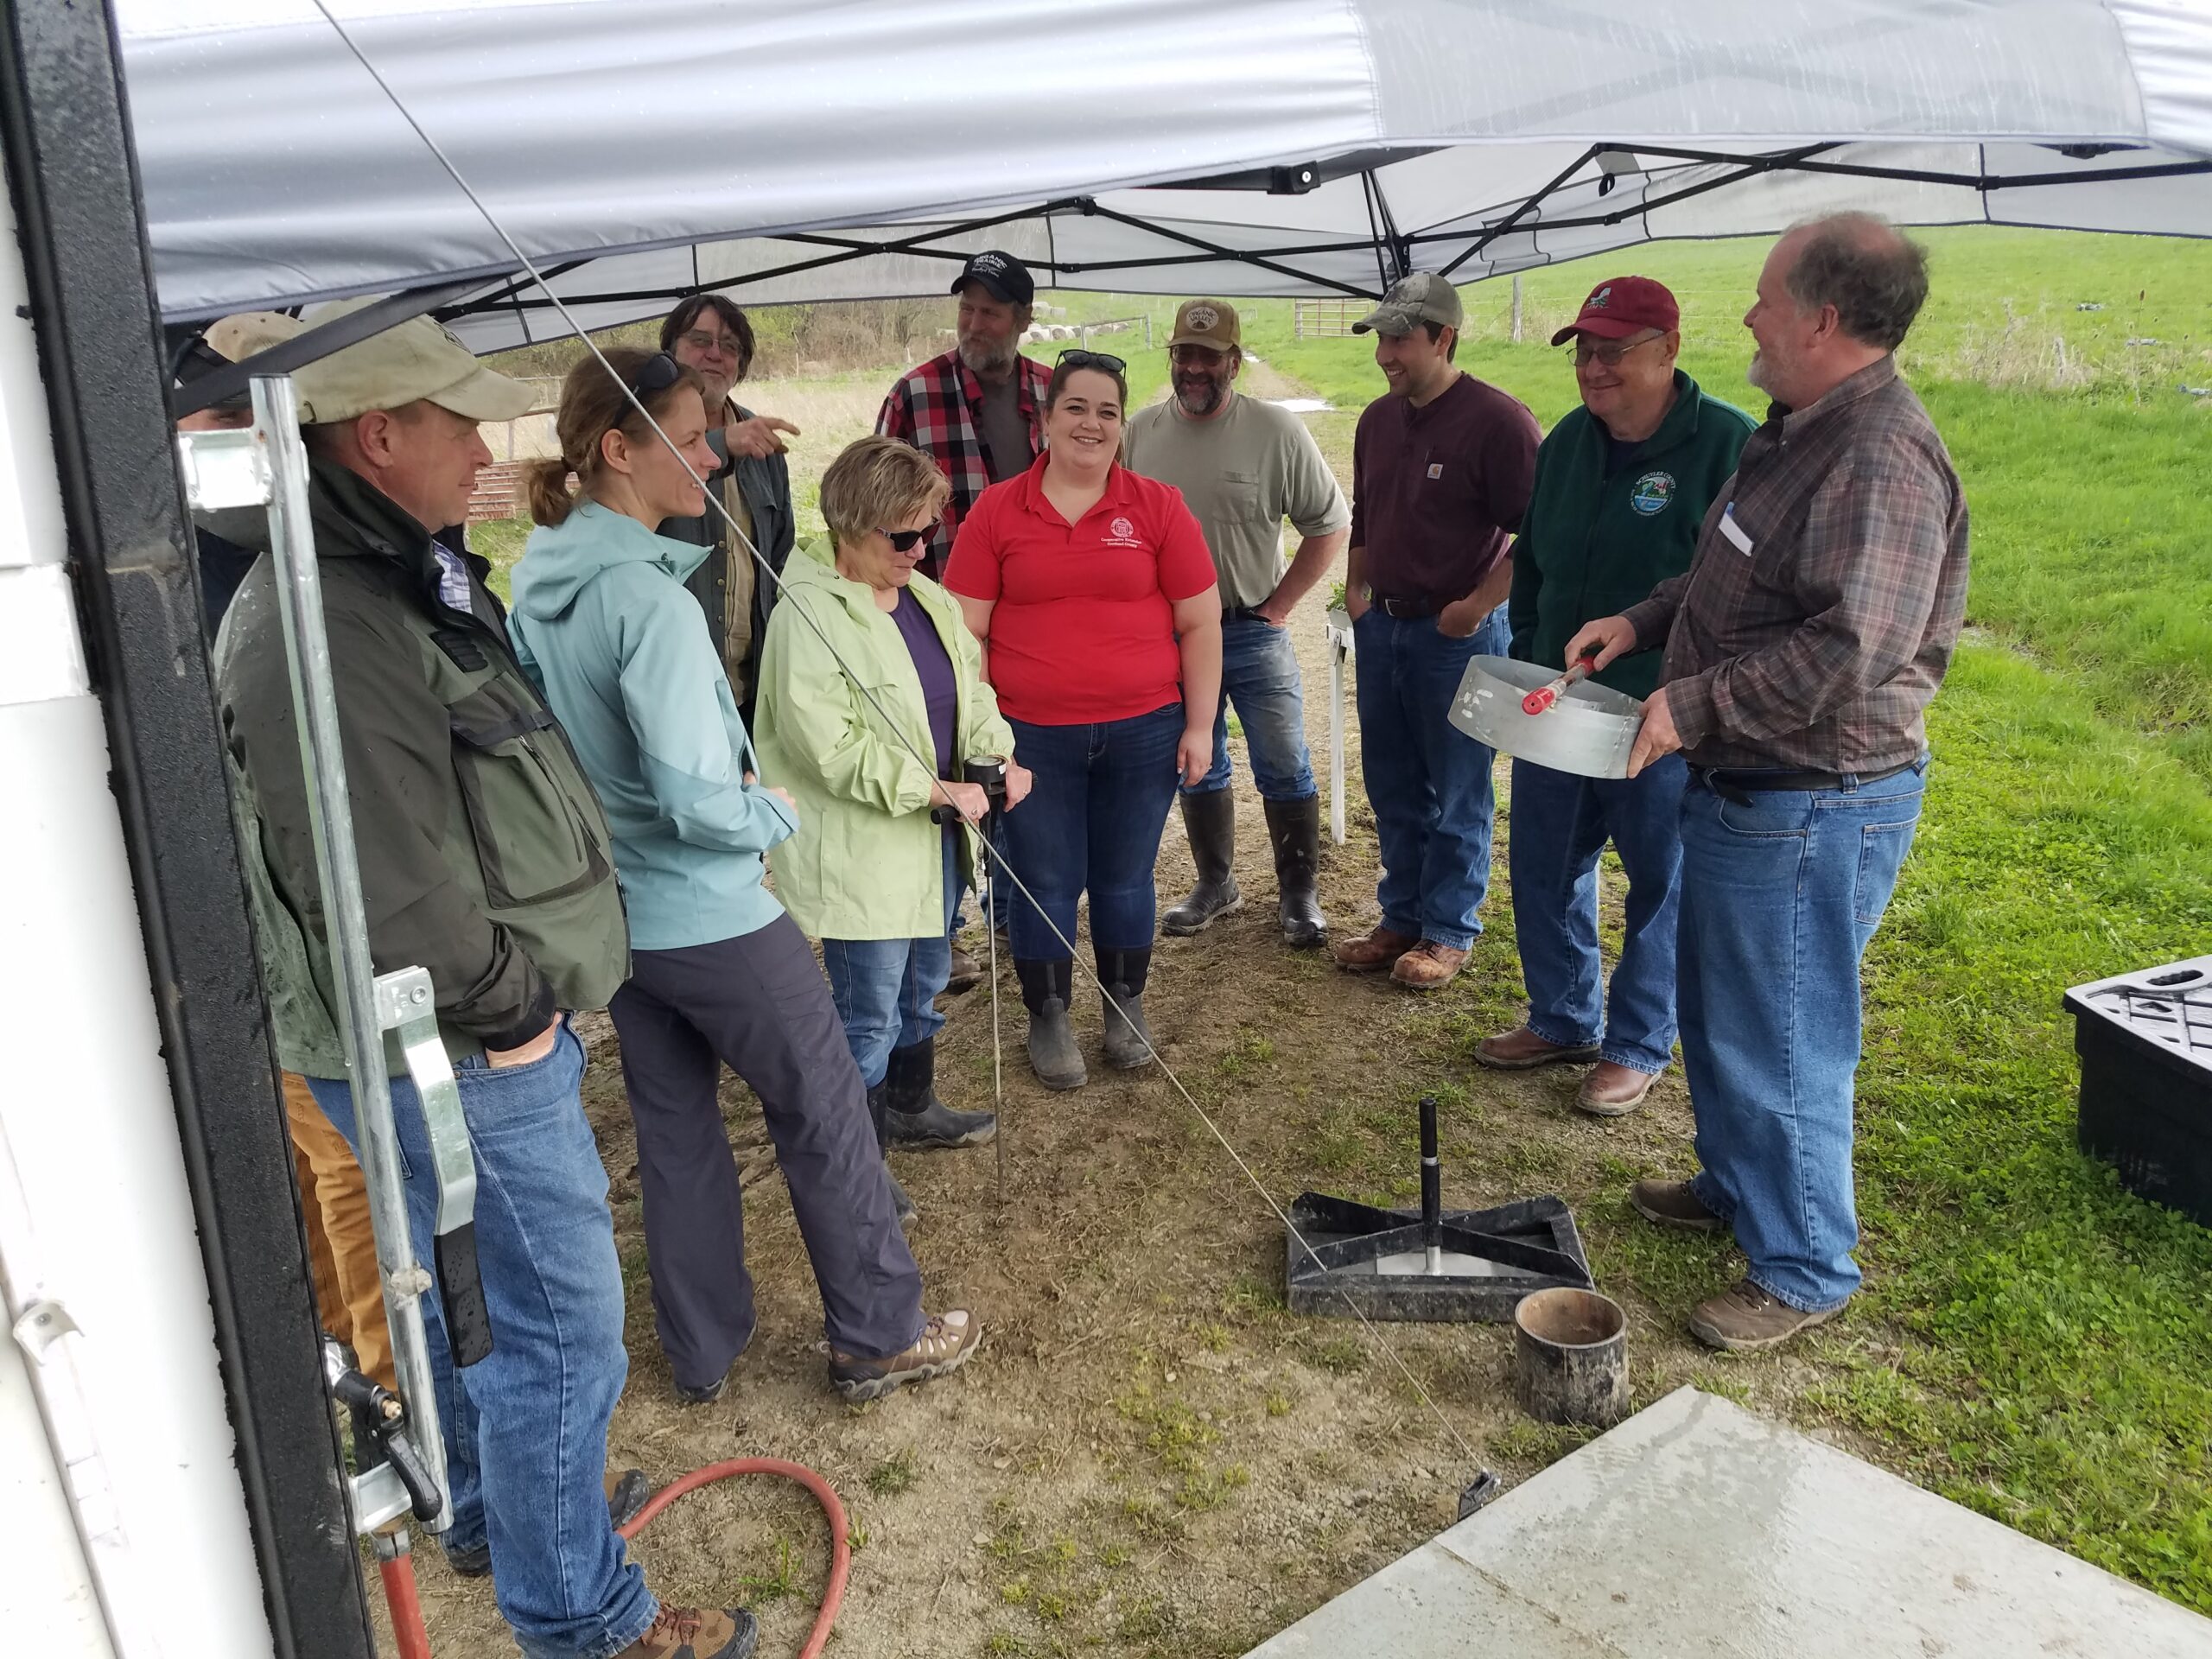
The project held 12 on-farm events with 436 attendees in 2019. At each one of these we had attendees use the penetrometers to collect the readings at the host farm which were needed to calculate the PCR. By collecting this data we were able to educate attendees on using a penetrometer and at the same time show them the compaction differences between the fenceline and the pasture. Many were surprised by the difference in compaction readings from the penetrometer. One educator in Maine expressed "Holy Moly" when doing the comparison of the two areas. This data collection by attendees helped highlight the existence of compaction in pastures as well as help them visualize the concept behind using the Pasture Compaction Ratio.
2020 - 2021
Due to Covid and the restrictions by Cornell Cooperative Extension, our plan to revisit farms to collect penetrometer readings throughout 2020 had to be changed. The PI for the project asked to alter our plan. Instead of fourteen educators collecting three readings from fourteen farms the PI would collect eight readings from eleven paddocks. Not all paddocks had the same number of readings during the summer of 2020. Due to dry conditions some of the paddocks had readings which surpassed the maximum of 500 lbs./inch2 which could be read by the penetrometer.
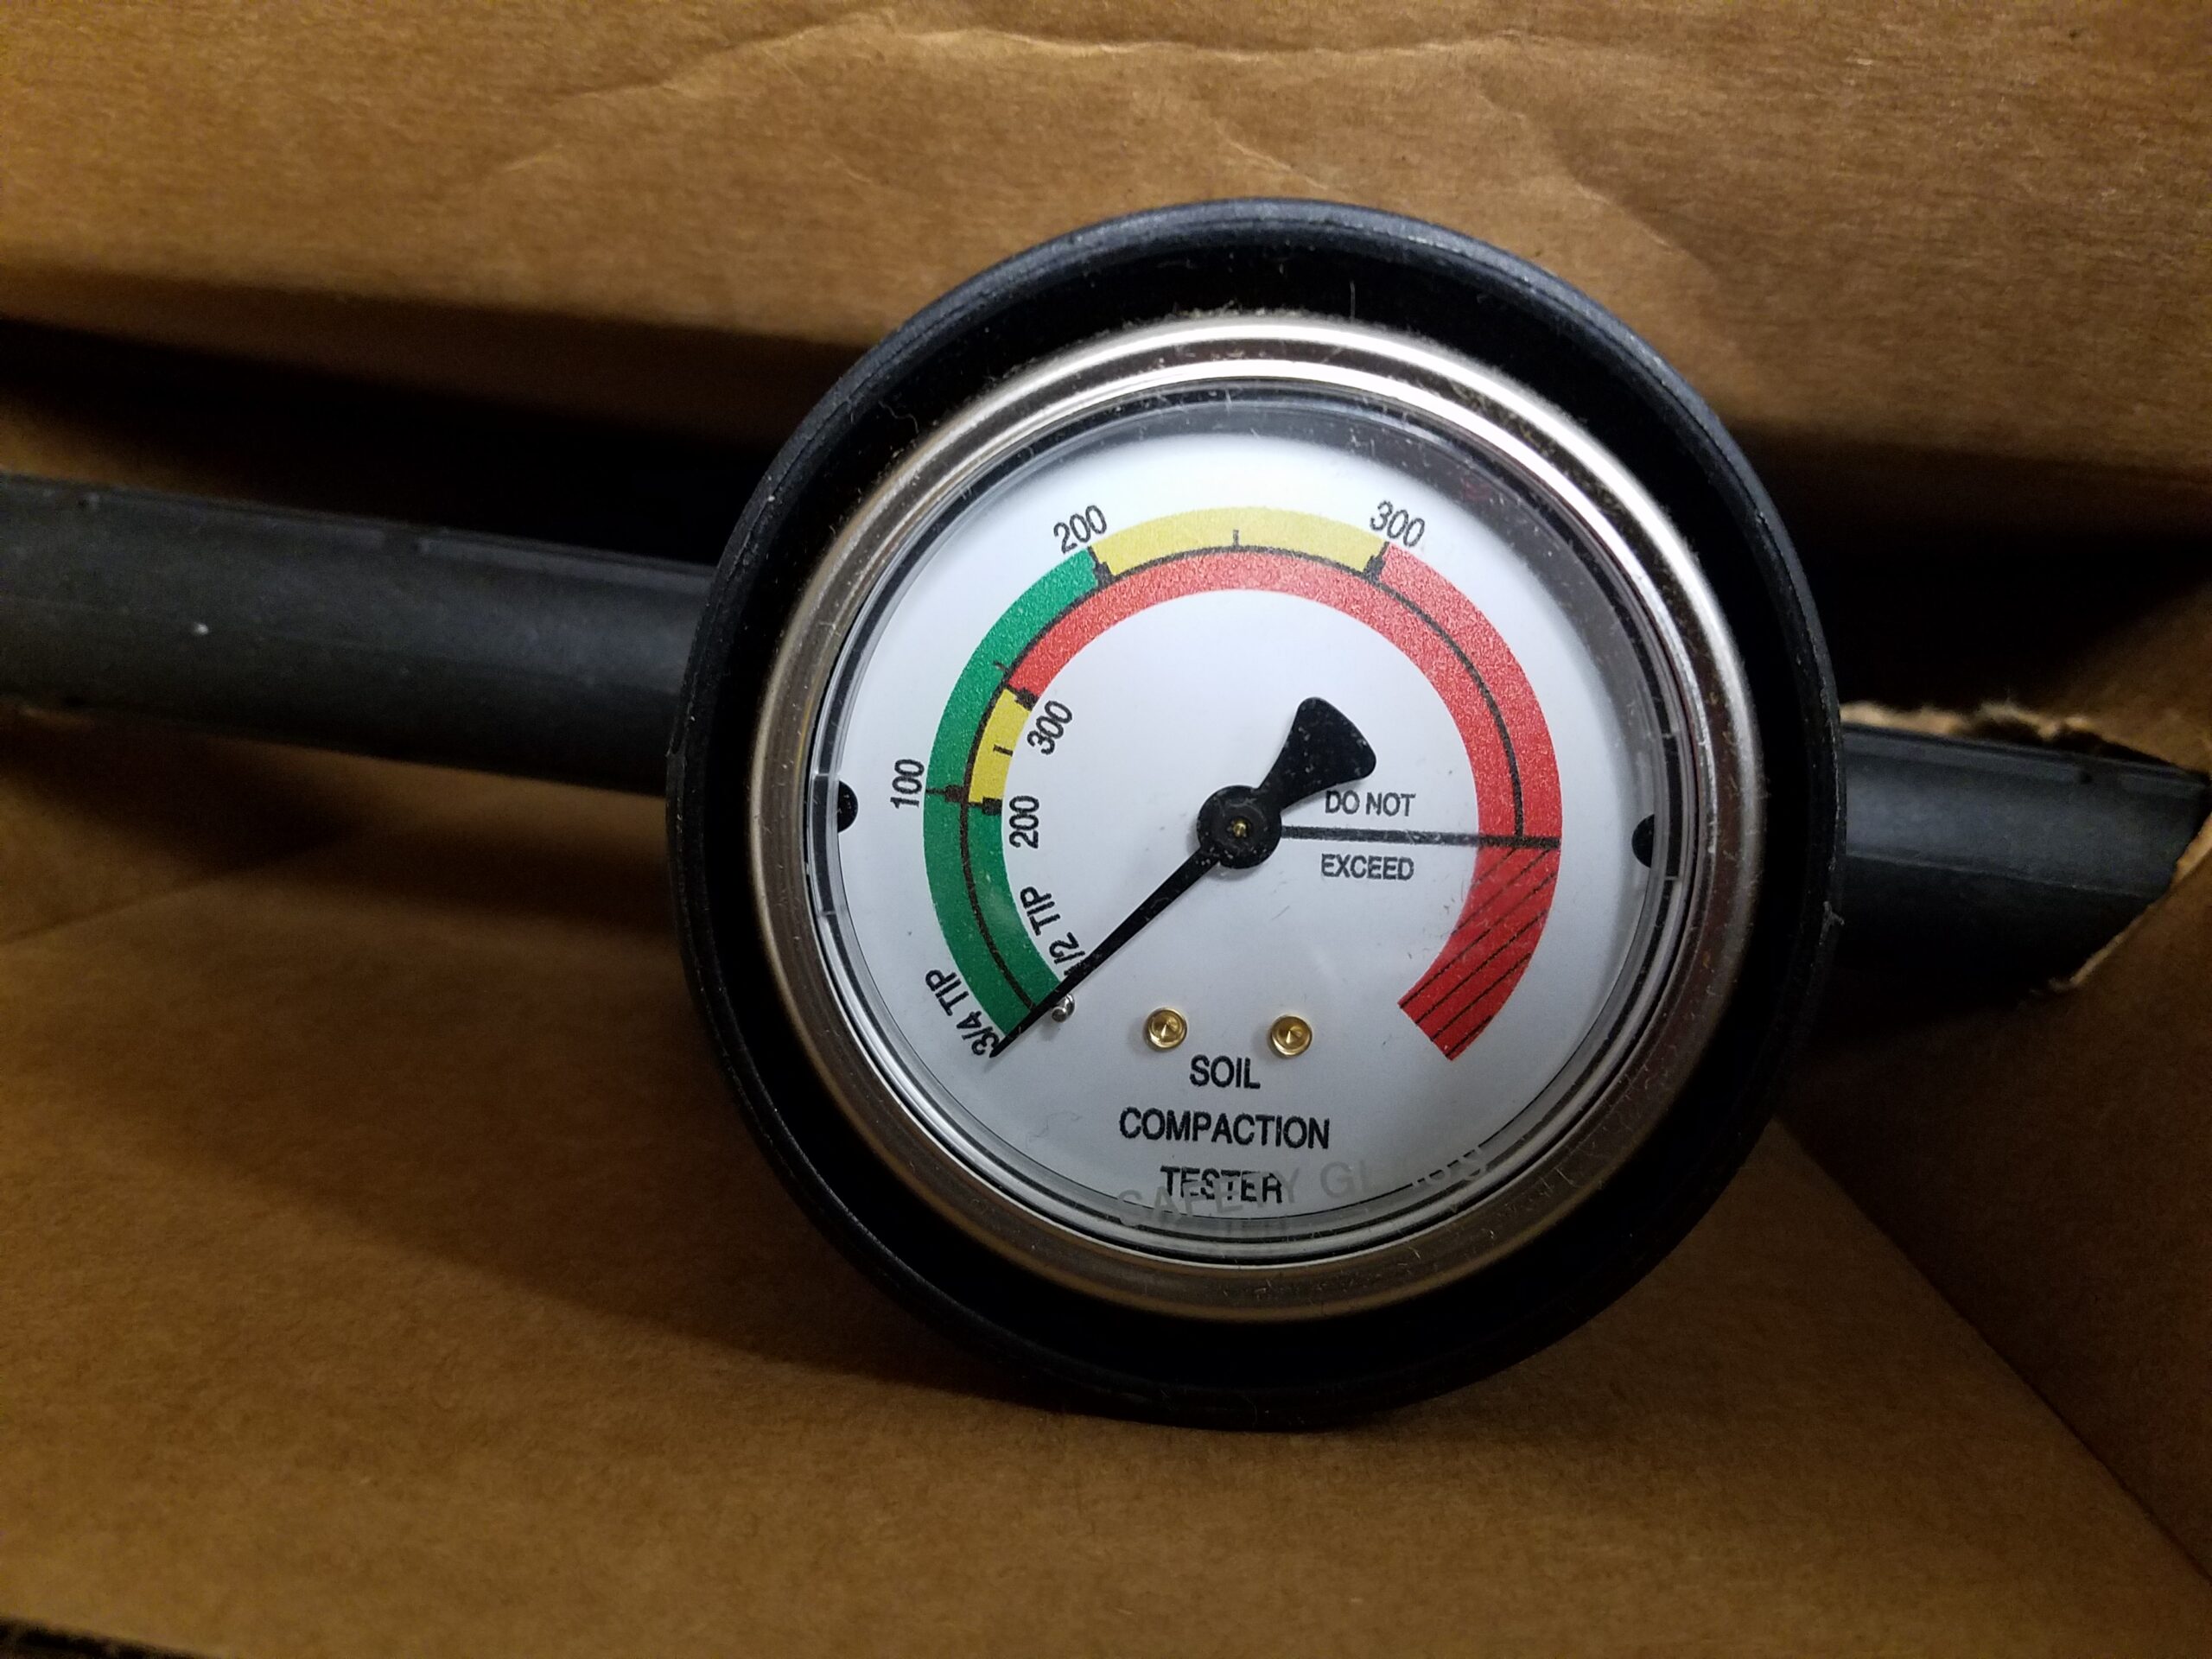
Part of the problem in collecting more data points was because our penetrometer calibrations only go to 300 lbs/in2 . The gauge goes up more but there are no numbers to read. During the summer months many of the pasture readings are over 300 lbs/in2 so in order to collect readings we determined to calibrate the gauge to be able to measure higher readings. In the photo below it shows the gauge on the penetrometer we purchased for the project. Even though the numbered scale ends at 300 we used a scale to mark higher readings on the scale. Our calibrations allowed us to read up to 500 lbs/in2
The results of all eleven paddocks sampled are available in the attached “PCR 4” spreadsheet attached in “Information Products.” Since the results were similar only two of the graphs showing the data points are displayed here in figure 2 and 3 below. The blue points representing the penetrometer readings of the pasture are higher on the graph since there was more compaction. The red points show the same day results for under the fenceline. The grey points show the ratio of the two readings. It can be seen that even though the fenceline and pasture readings changed throughout the season the PCR remained fairly constant, but not the straight line we had hoped for. Regarding our first approach to proving our hypothesis the result was "partially" since we would need to see a high degree of repeatability to be completely successful but we did see that the PCR was much more constant than the penetrometer readings.
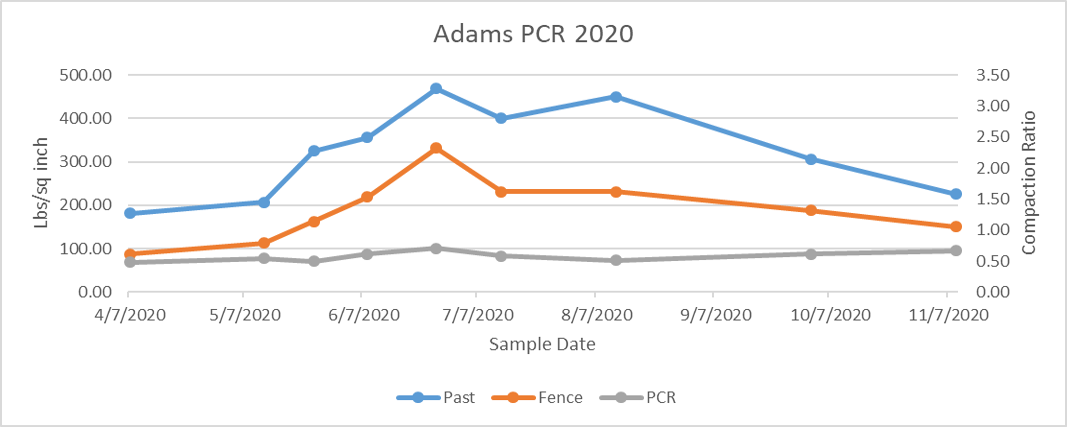
Figure 2: Adams PCR pentrometer results for Arpil through November of 2020.
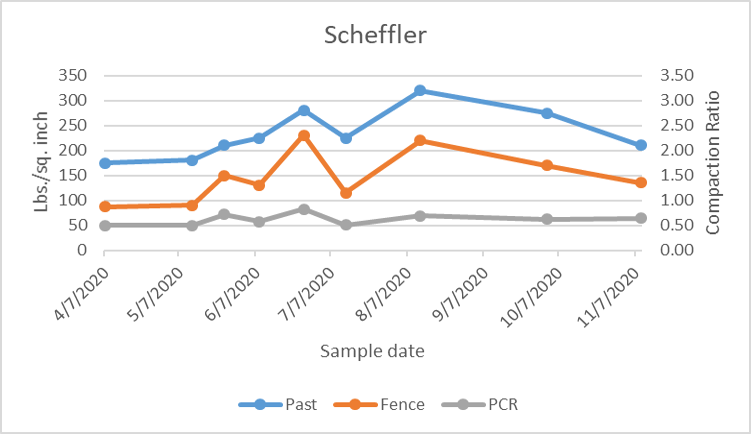
Figure 3: Scheffler compaction ratios for April through November of 2020.
To test the second approach which was to use the PCR to monitor a change in management, we selected the “Adams” pasture. This pasture had been severely compacted due to being continuously overgrazed for more than 20 years. The paddock was 35 acres with by 40-60 beef animals. As expected in overgrazed pastures, there was increased traffic by the animals as they got only small bites from the sward that consisted of mostly bluegrass, Dutch clover and other forbs. The increased traffic led to increased compaction. Due to the declining productivity of the pasture, the animals in the trial pasture mostly relied on stored hay brought into the pasture. The 2019 readings for the “Adams” paddock were the ratio of the paddock and under the fenceline. In November of 2019 a ten-foot by ten-foot enclosure was installed to exclude animals. During 2020 the management of the enclosure mimicked hay production cutting the sward to 4-5 inches twice during the season. In 2020 the readings included the paddock, the enclosure, and the fenceline. All points were within 30 feet of one another. The PCRs for the paddock and the enclosure utilized the same fenceline reading.
Each point on the graph above represents the ratio of the penetrometer readings for points in the pasture or enclosure and the fenceline. All readings were taken within a 30-foot circumference.
The Y axis shows the range of the PCRs. The highest point 1.0 would mean that the penetrometer reading for the pasture or enclosure, was equal to the fenceline for that date. A reading of 0.5 would mean that the penetrometer reading for the pasture or enclosure was two times the fenceline. The X axis is the date of the penetrometer readings.
When reviewing the data with the research team they agreed that the basic assumption of using a ratio was a unique technique. The graphs showed that there was a degree of repeatability but since there was variability in the ratios it reduced its effectiveness on being a monitoring tool. They pointed out that my experiment design could have been improved by collecting soil moisture levels at the same time the penetrometer readings were taken. The assumption that moisture would change equally in the pasture and in the fenceline (or the enclosure) was not studied. The original rationale did not take into account for pore space differences in the two areas where the penetrometer readings were taken. The fenceline soil was less compacted so would have larger pores than the pasture soil. Larger pores would mean that there was more water in the soil and so would not change as fast as the pasture soil.
The research team did say that the PCR did capture the change in management for the Adams Pasture. The deviation of the enclosure’s PCR from the Pasture PCR gave a documented, reliable proof that the change relieved the pasture of the compaction. Dr. Kitty O’Neil stated, “A good rationale for more study. Regardless, you found really cool stuff, especially the ‘speed of recovery’ in the enclosure.”
PCR Results for Other Paddocks Studied:
Below are graphs of penetrometer readings of pasture and fenceline and the resulting PCR taken from other paddocks during the study. The take away of all of these is that the PCR was "fairly" constant throughout the grazing season even with the variations caused by soil moisture changes. As stated above the fact that since the pore space in the soil under the fence were larger due to less compaction the water holding ability was also larger so did not change equally with the pasture soil.
Data Collection Sheet for Study:
Combining the education goals of the project and the research goals was a successful format to help graziers better understand the nature of compaction in their pasture soil. The 436 graziers who attended the fourteen pasture walks and had the chance to use penetrometers to measure the difference in compaction between the pasture soil and the fenceline soil, gained knowledge to use on their pastures. The results on the use of the Pasture Compaction Ratio (PCR) as a monitoring tool did show promise. The results would have been better had the data collection also included moisture of the soil. This might have improved the repeatability of the PCR.
The use of PCR to monitor the management change from over grazing to hay production was successful. If graziers want to use the PCR to monitor minor management changes it would be good to collect moisture data in addition to the penetrometer readings.
The one surprise to the project team was the speed and timing of recovery of the compacted soil when switching to hay production. It was expected that since the enclosure was installed in November there would have been a lessening of compaction in early spring when frost heaving takes place. Instead it wasn’t until late May that a big improvement happened. When discussing this point with the research review team the theories included.
- The May improvement was caused by the roots of the existing sward growing longer because they weren’t being grazed off. This caused a corresponding physical reduction in compaction.
- The May improvement happened as the soil warmed and the biology began to strengthen and enlarge the pore space. The lack of compacting animal traffic allowed this to continue.
- It was a combination of both of these points. The roots grew since the plant wasn’t being grazed and the corresponding synergy between the roots and the biology helped the health of the soil.
Education
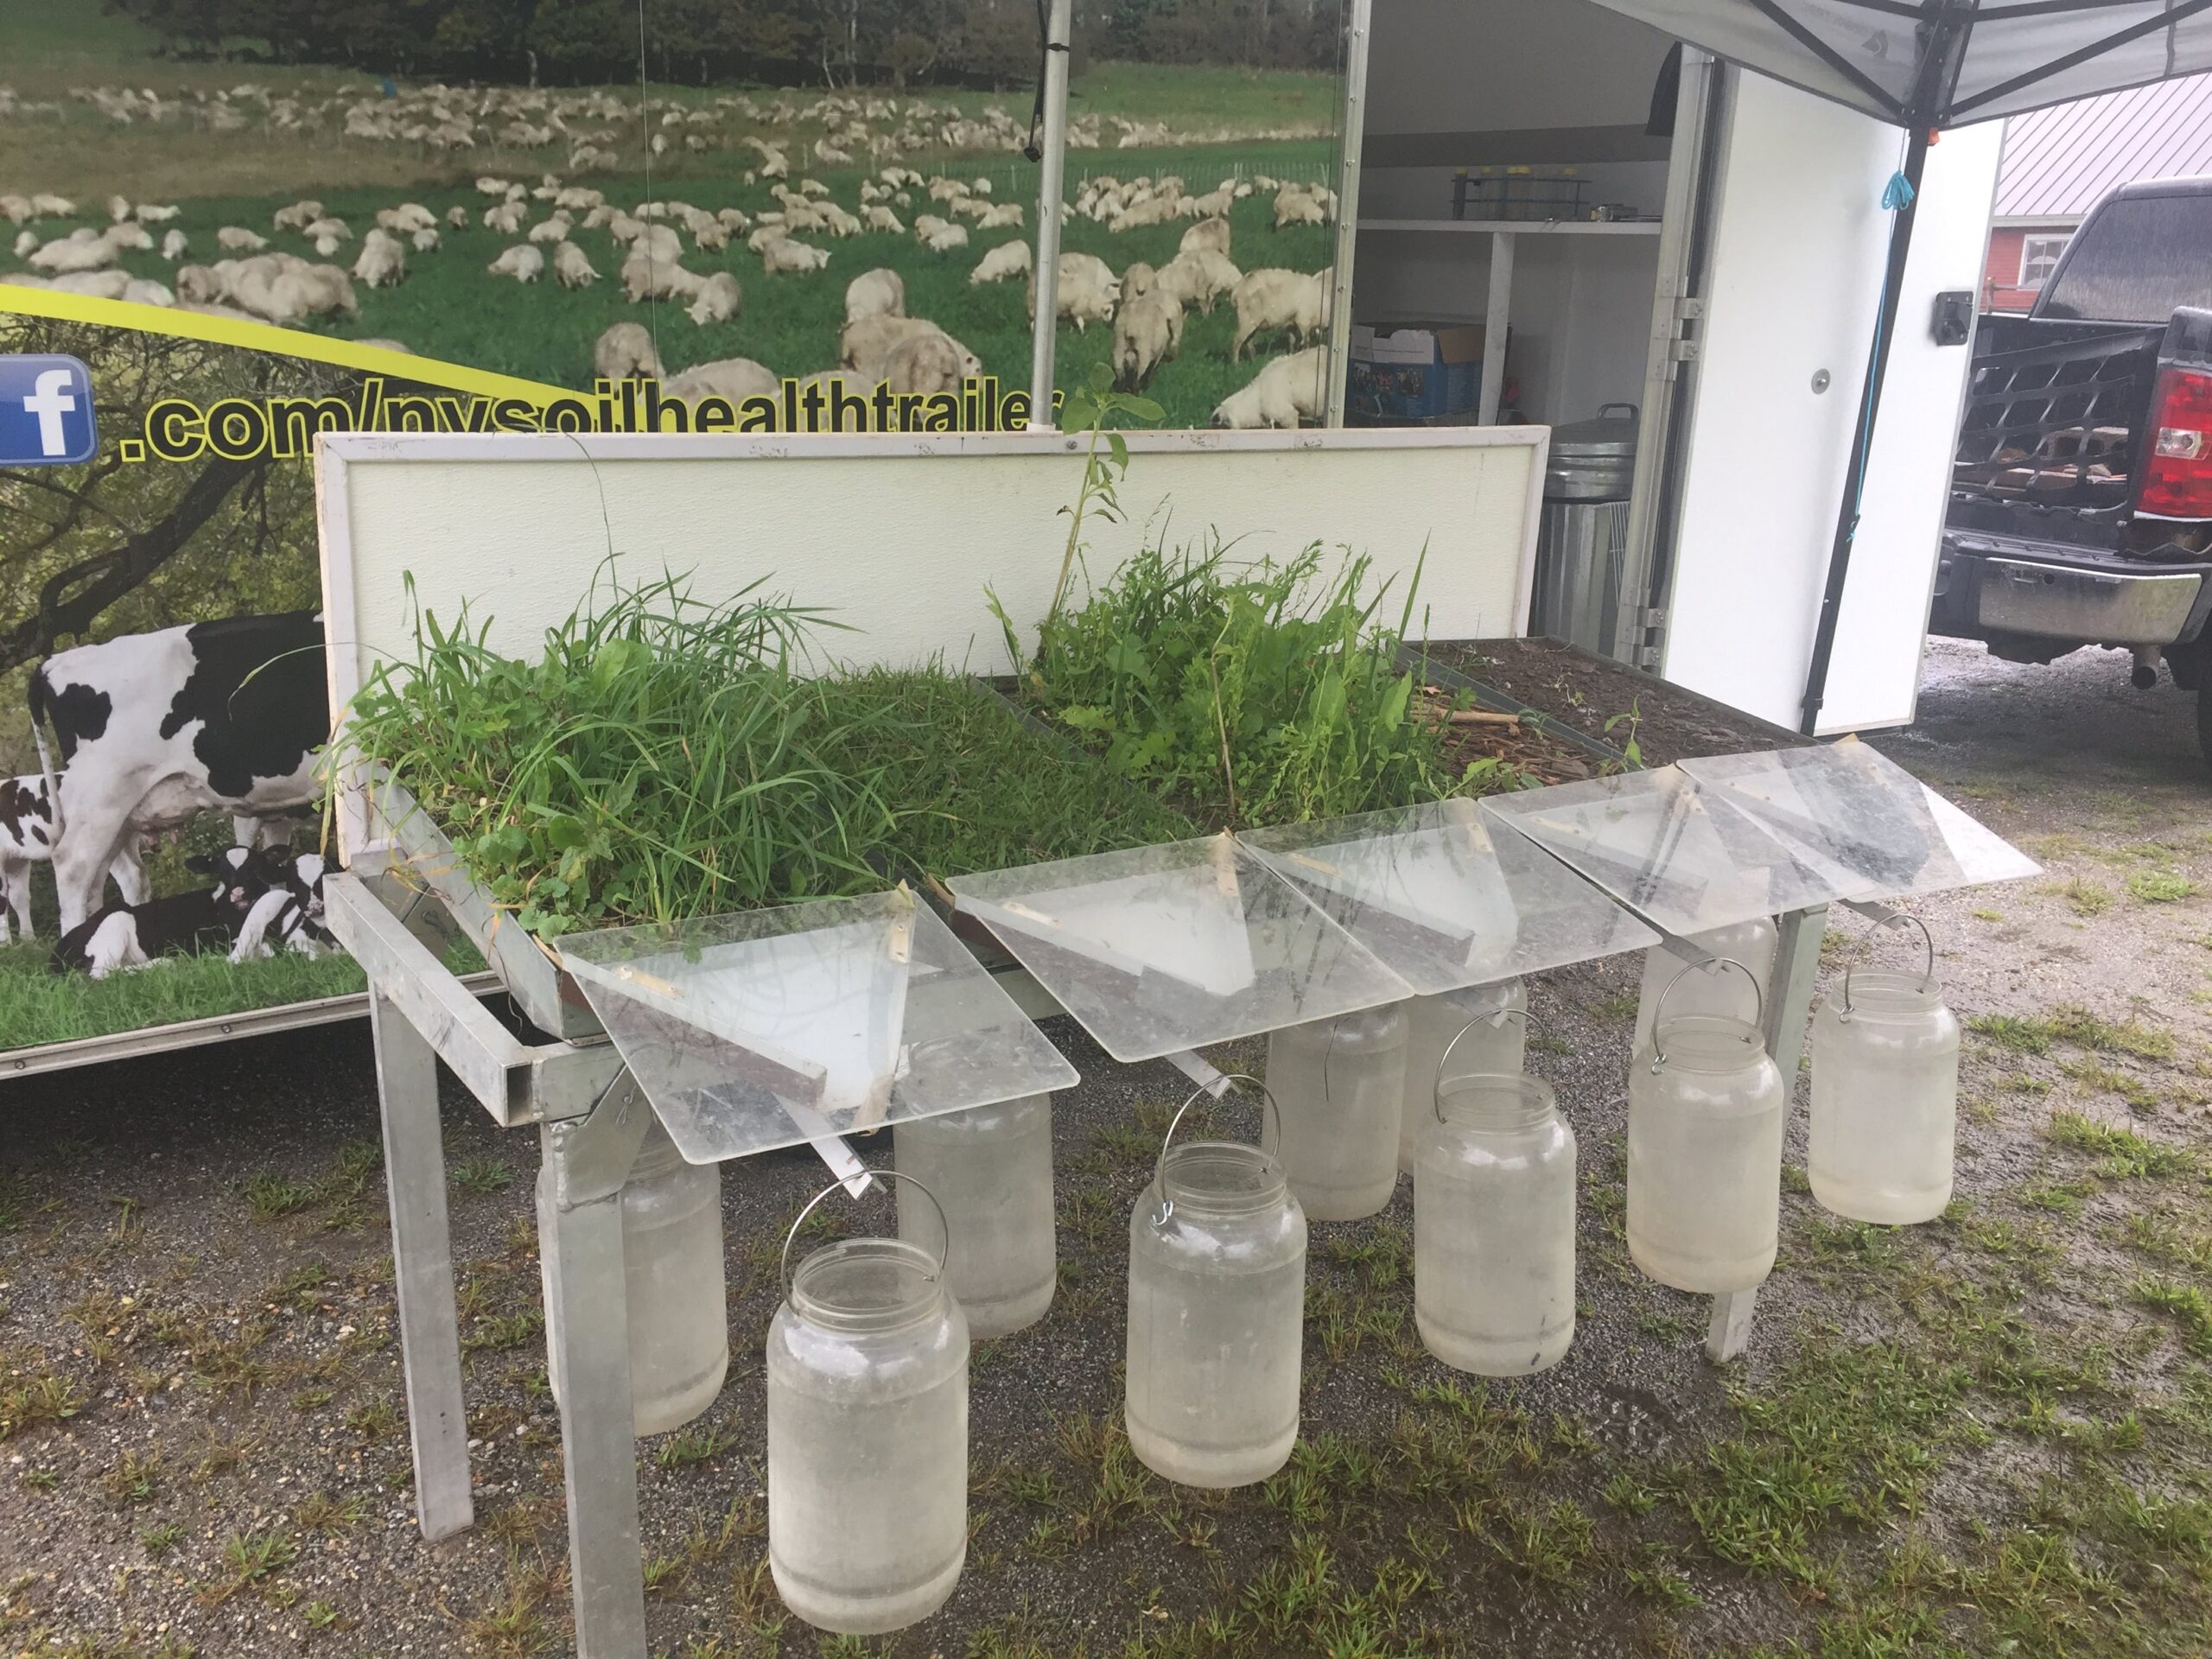
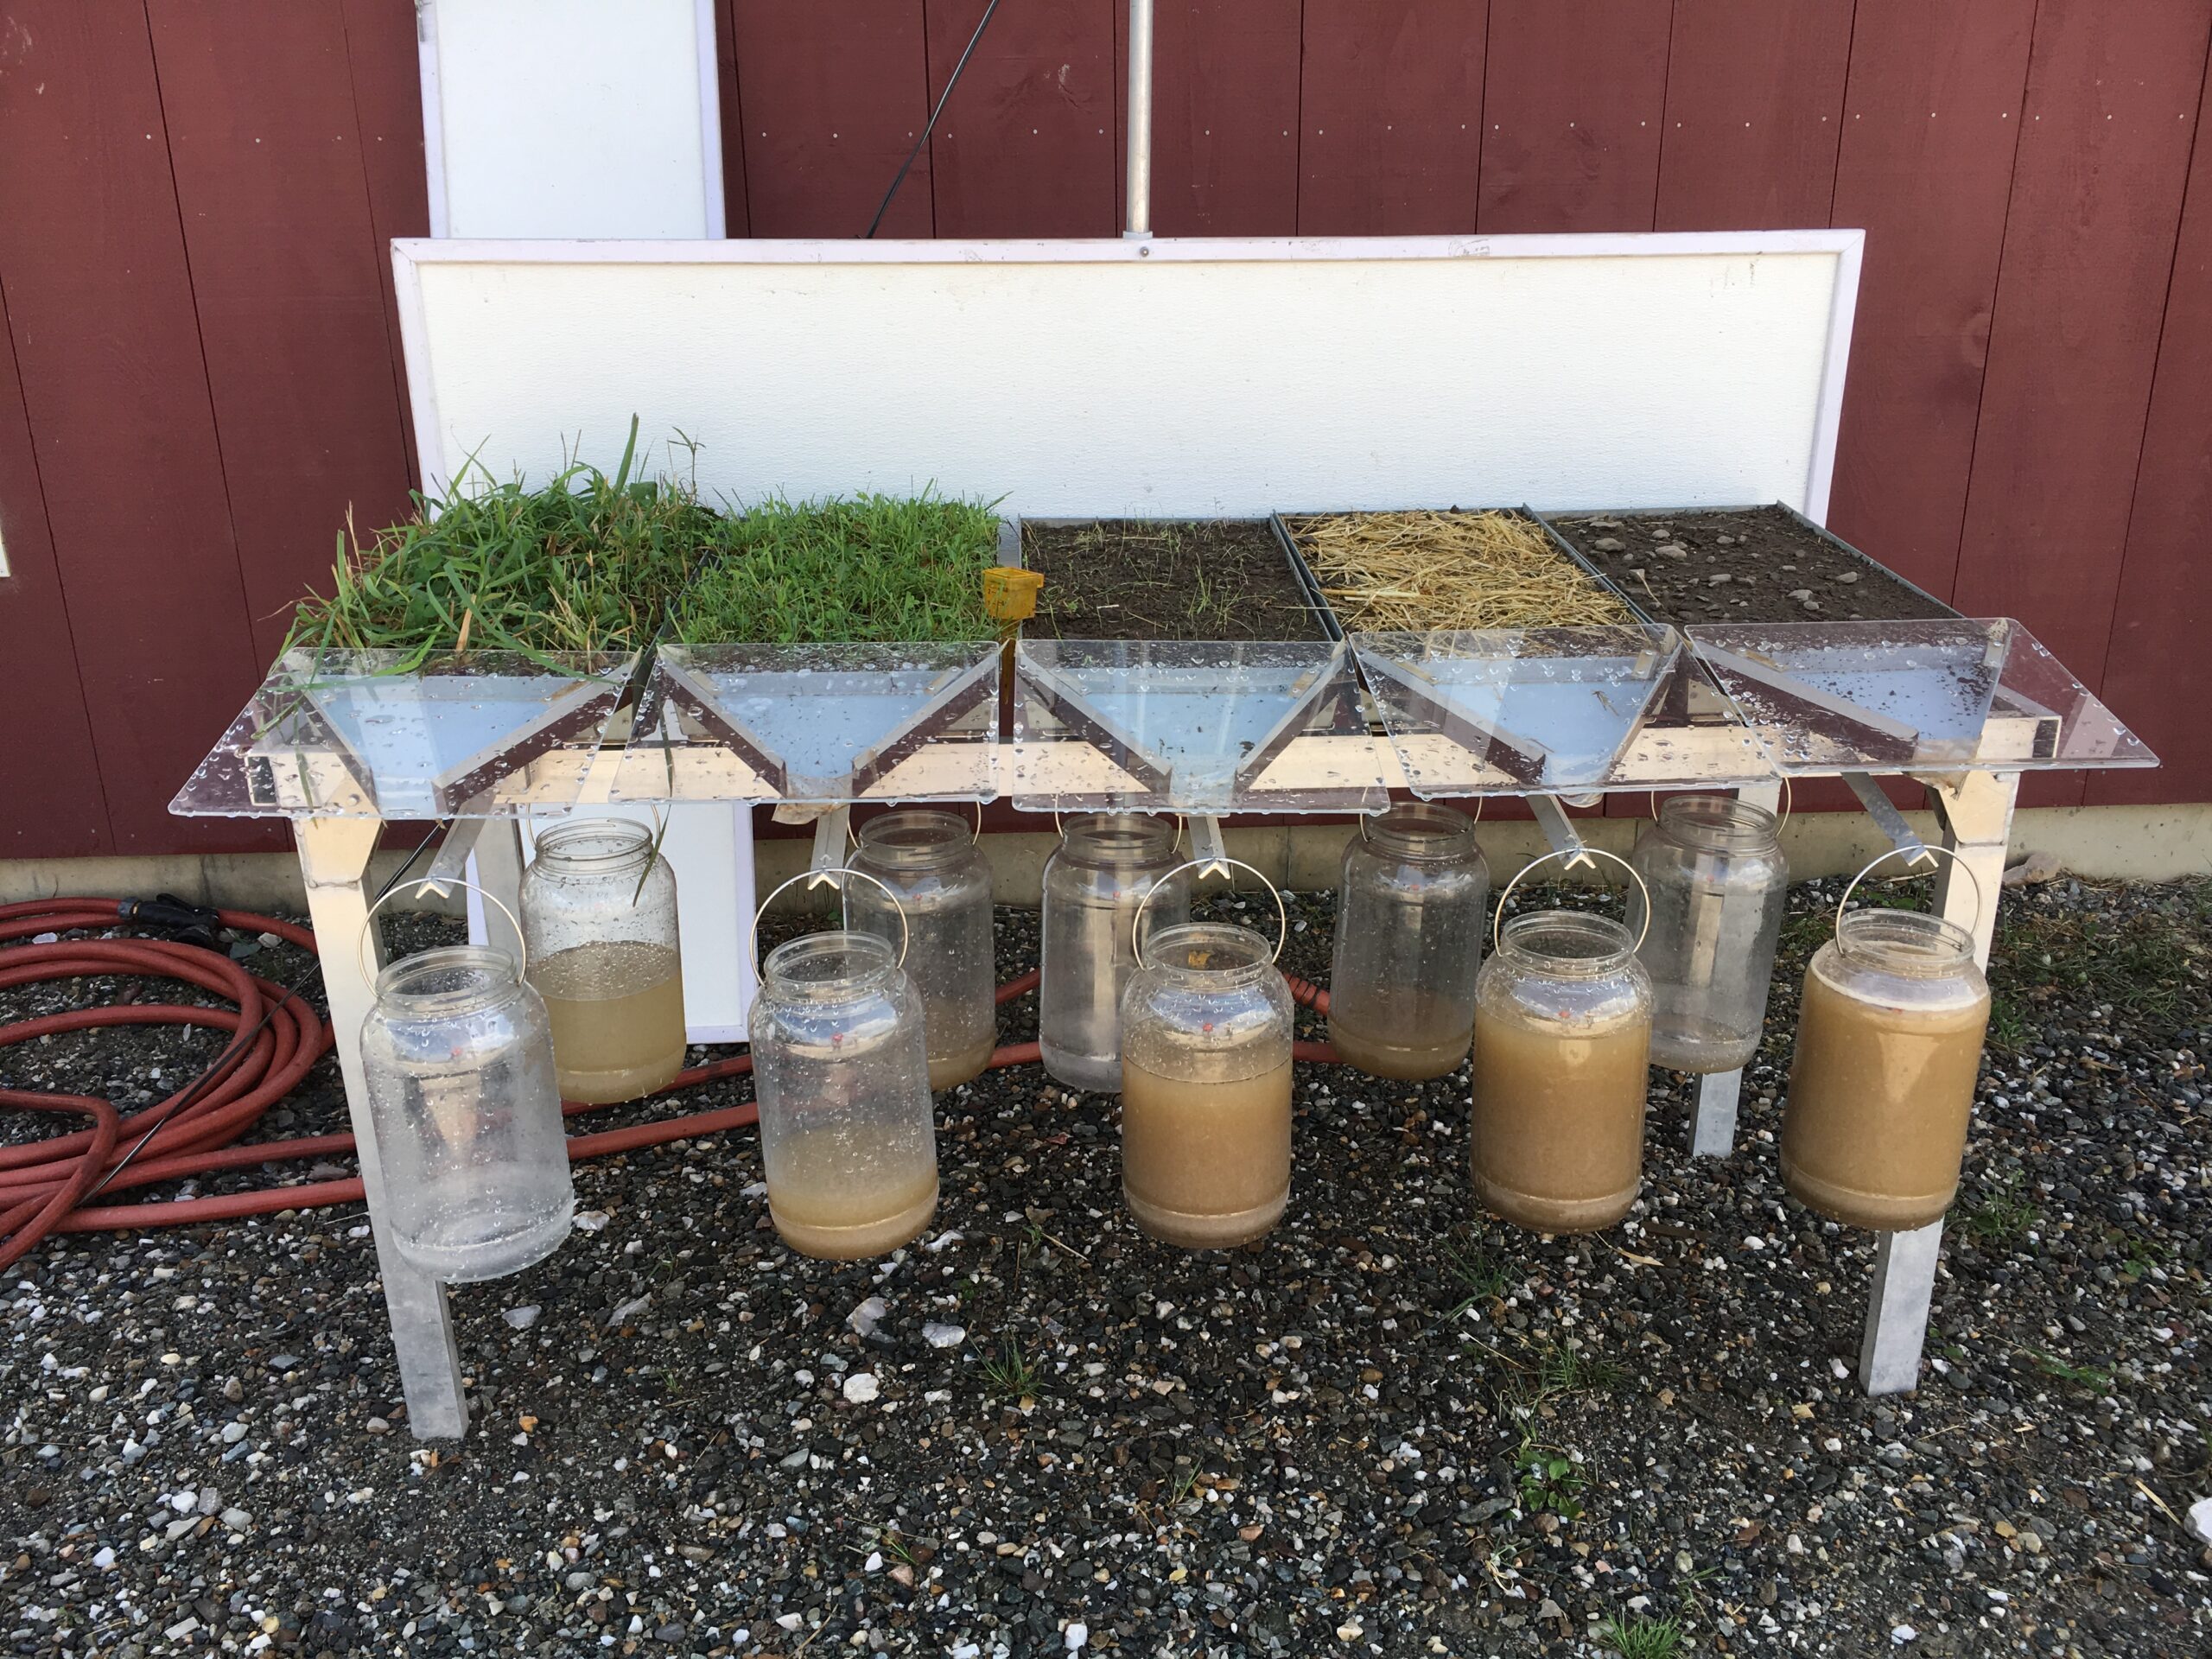
Pasture soil compaction is a topic that all graziers deal with. It doesn't matter what type of animal or what management style is utilized, compaction is going to happen. The issue to the project team was that many graziers didn't comprehend what compaction may be doing to their pastures since it was difficult to monitor. To address this lack of comprehension the project held two Train the Trainers events. The thought was to train these educators to identify compaction in soils and the resulting negative affect on soil health. These educators were asked to then hold events in their areas on pasture compaction and they were part of the presentation. The New York Soil Health Trailer was also part of each of these events. The demonstrations done by the trailer were visual in nature which reached attendees with a different education style. The rainfall simulator always had one pan cut from a compacted pasture and one from a managed pasture. The amount of rainfall runoff from the compacted pan vs. the managed pan told a clear story about lack of infiltration. (see figure 6)
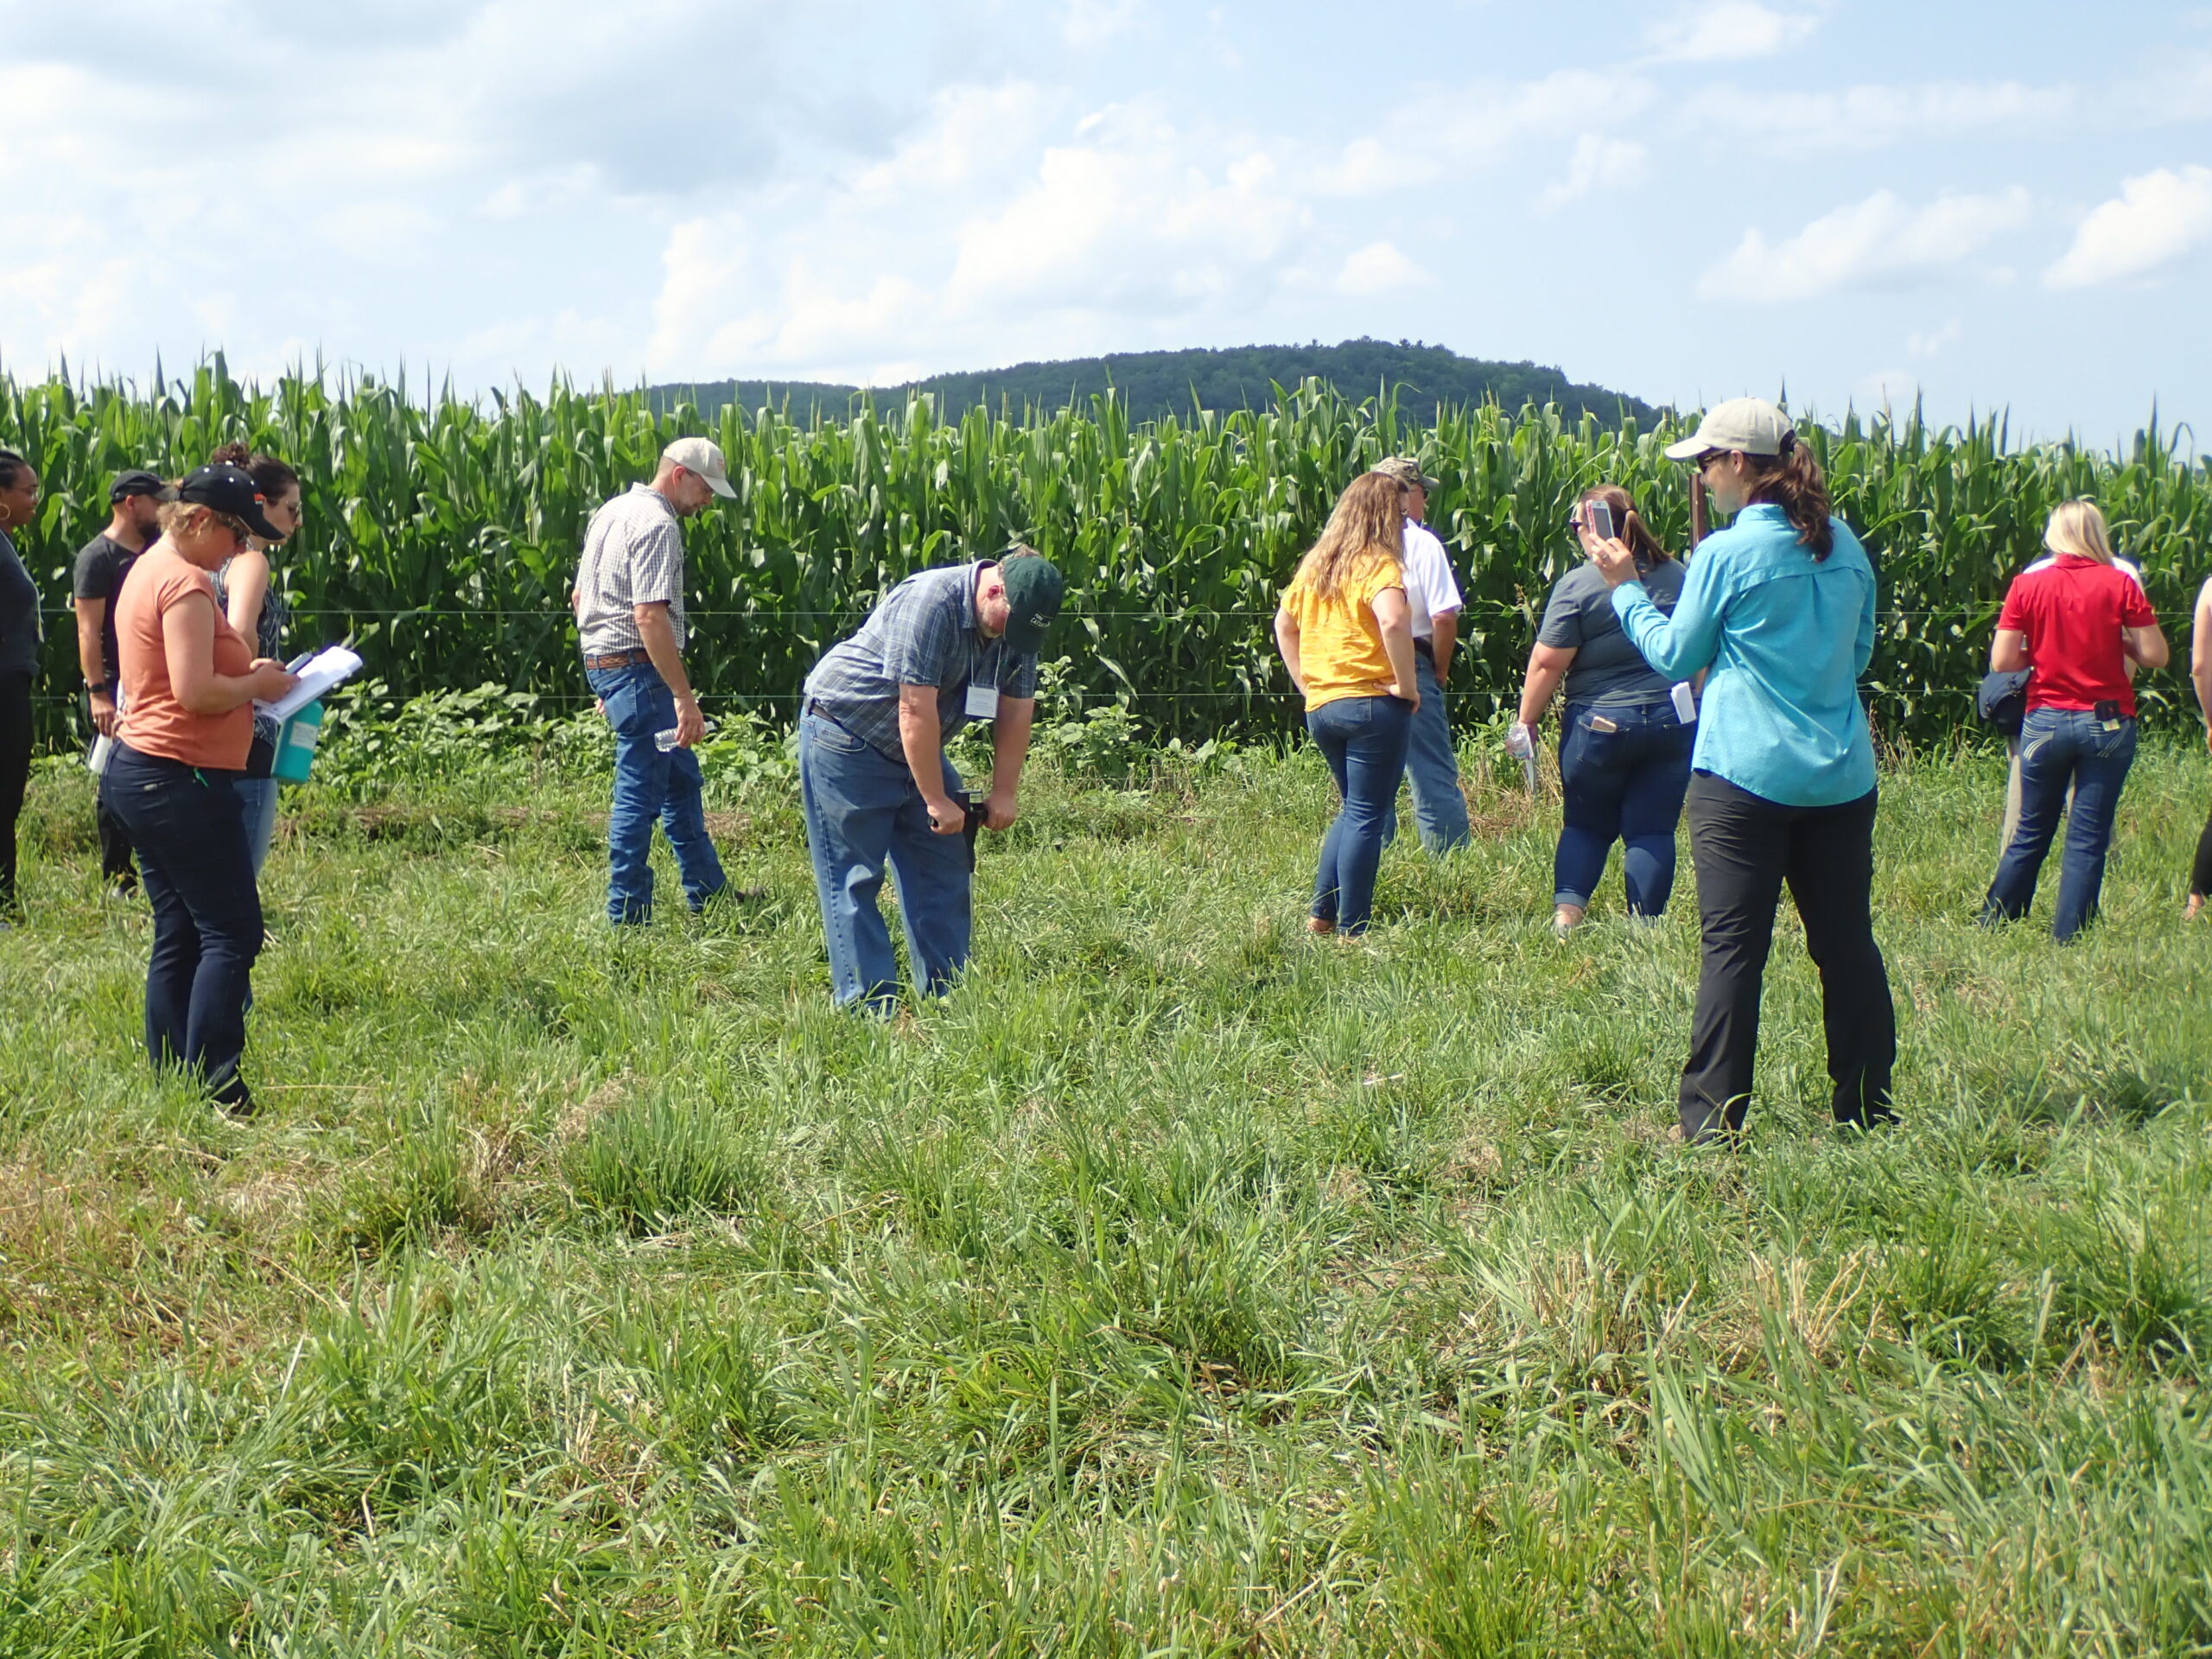
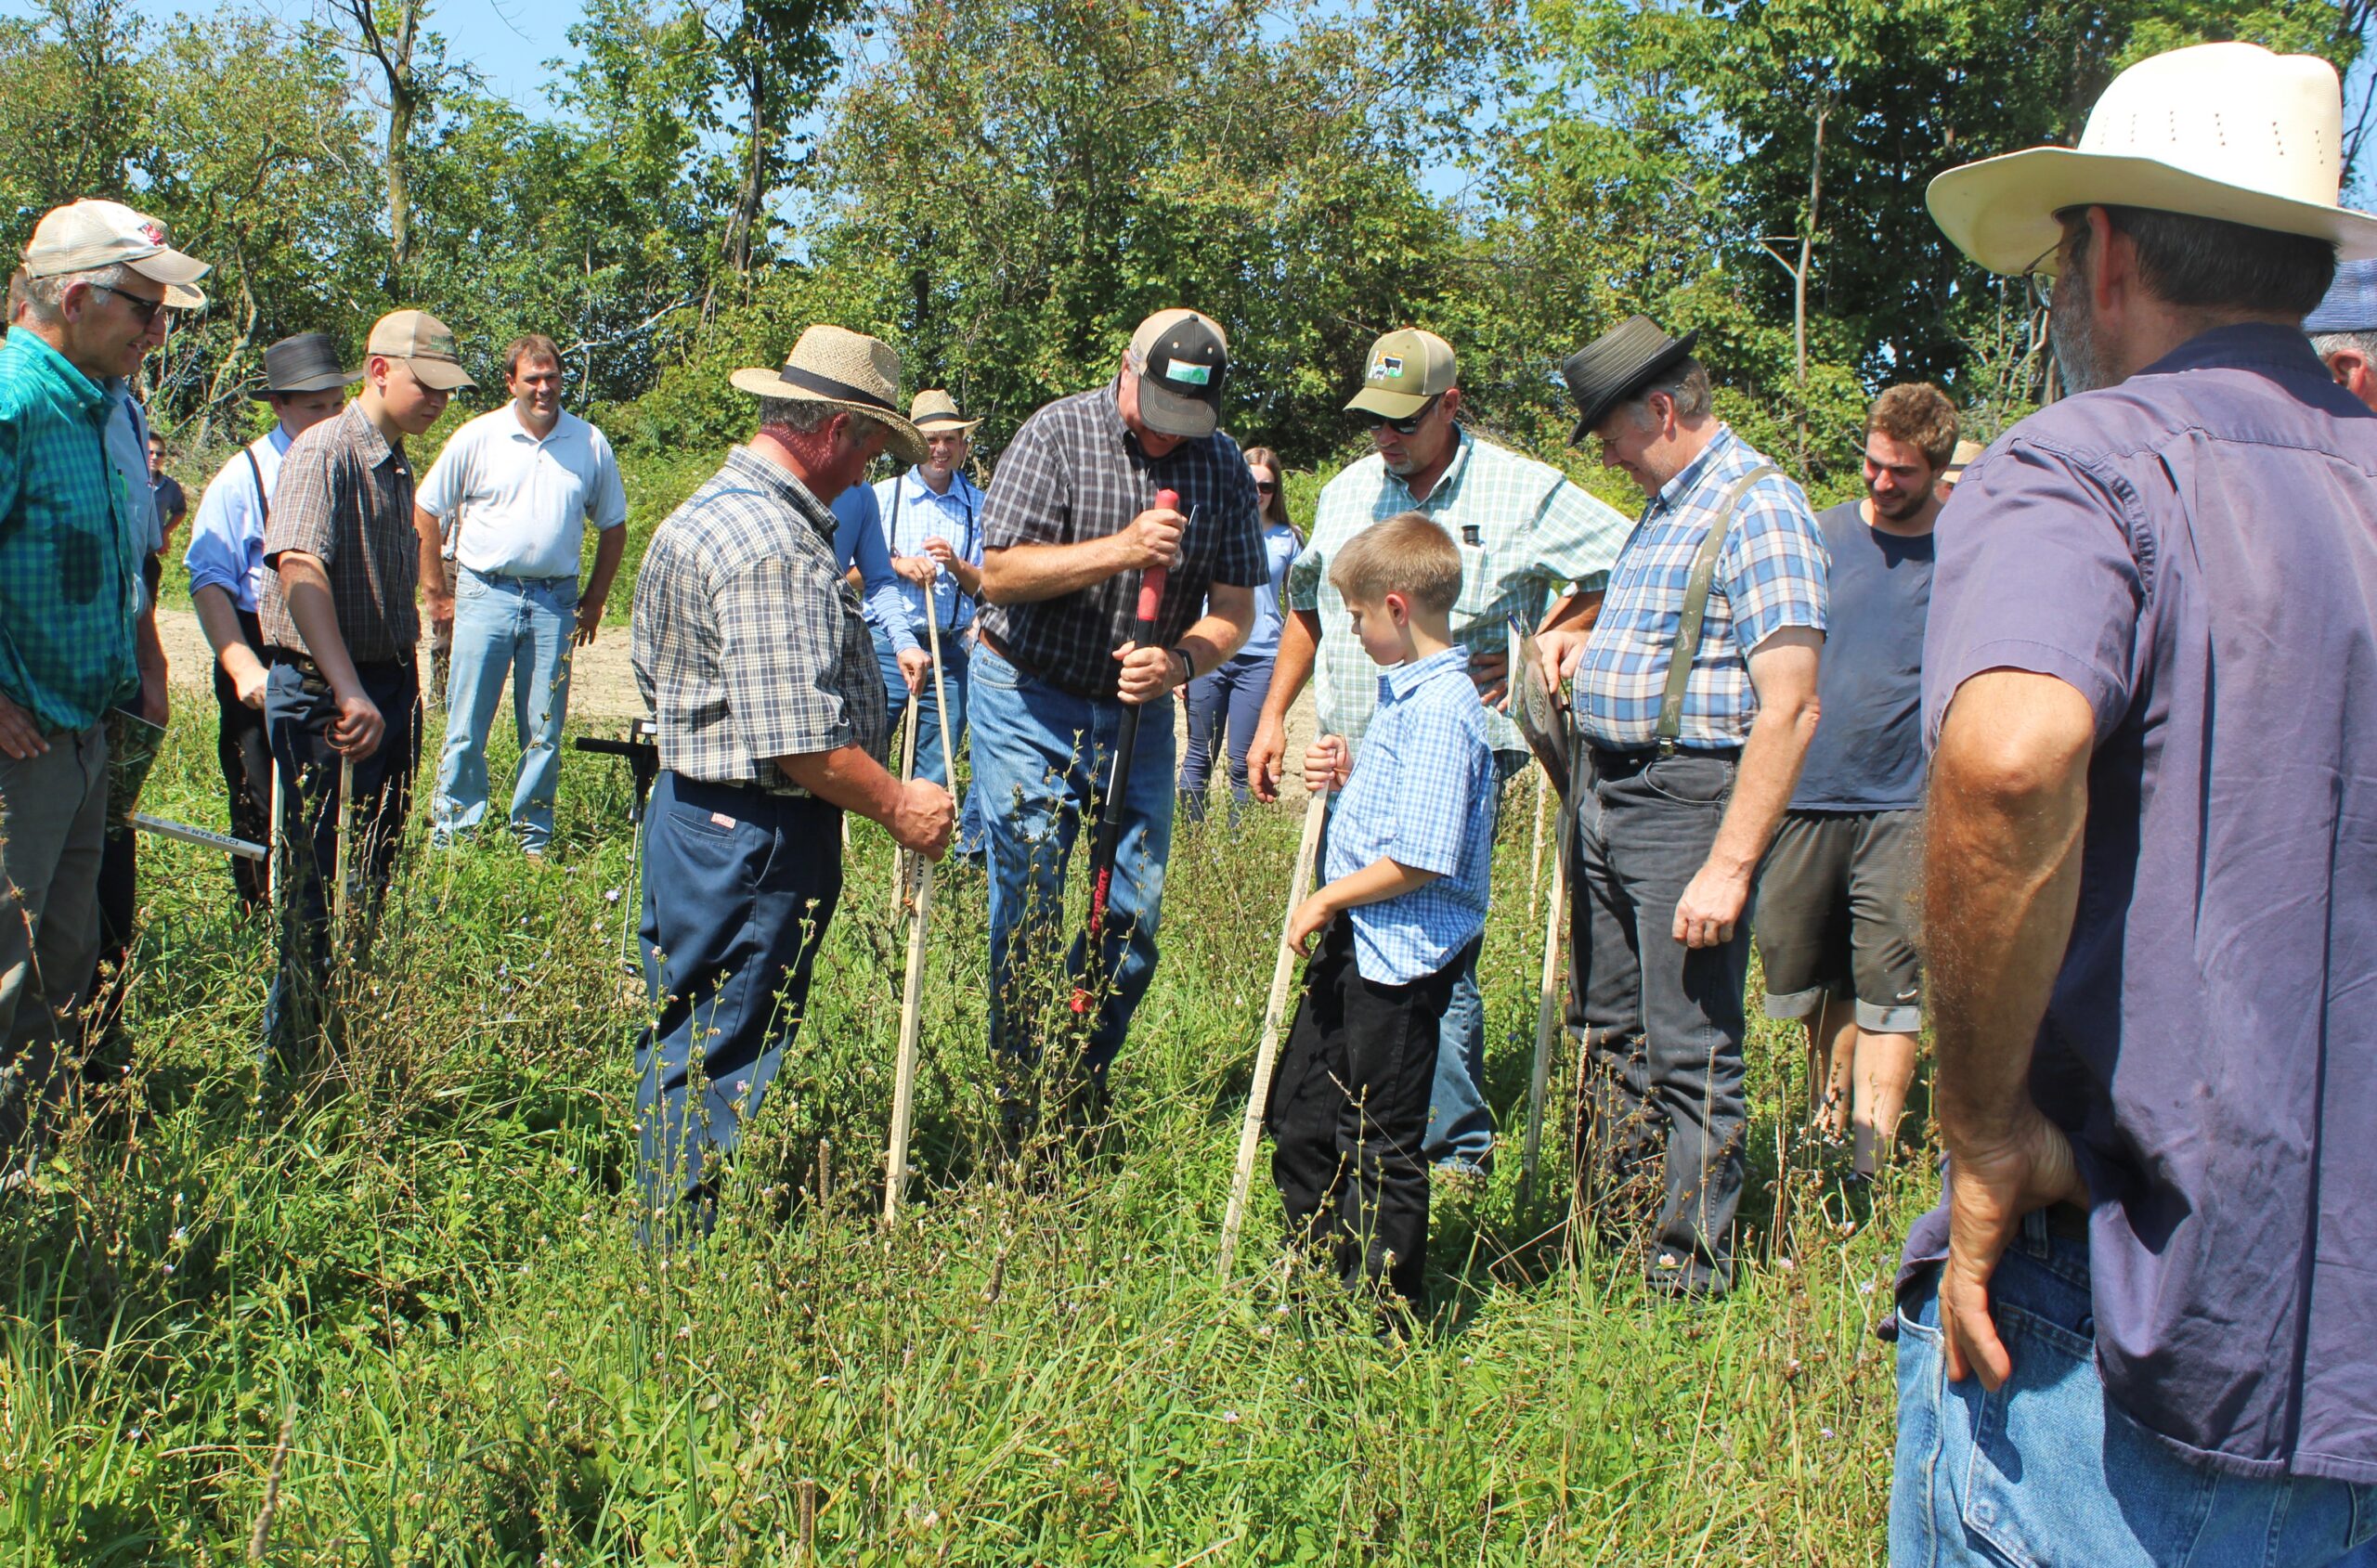
At each of the pasture walks we provided penetrometers to the group to share and asked everyone to measure the compaction in the pasture and then under the fenceline. This often generated discussion because of the big difference between the two. The discussion allowed us to describe the concept behind the Pasture Compaction Ratio. We also calculated the ratio using the readings provided by the attendees for the pasture we were on. Involving the attendees in the research component of the project connected them to the outcome of the project. (see figure 7)
Some important information wasn’t clear till the end of the project, such as understanding that short term compaction wasn’t as negative an impact on pasture productivity as was first imagined and that compaction in pasture soil is reduced in a matter of months if management is changed. To share this information two articles were written in January 2022 to describe these findings.
Mainstream article: “The Slow and Furtive Nature of Pasture Soil Compaction” can be found online at: https://scnydfc.cce.cornell.edu/submission.php?id=1495&crumb=soil|7
Technical Article: “A Possible New Technique To Monitor Soil Compaction” can be found online at: https://scnydfc.cce.cornell.edu/submission.php?id=1477&crumb=soil|7
This information plus other work by the project were presented at the National Grazinglands Coalition meeting in December of 2021. Because of this outreach the PI has been contacted by three organizations for future education opportunities:
- “Three State SARE Project” asked the PI to present at five of their summer events.
- The Noble Research Institute, LLC
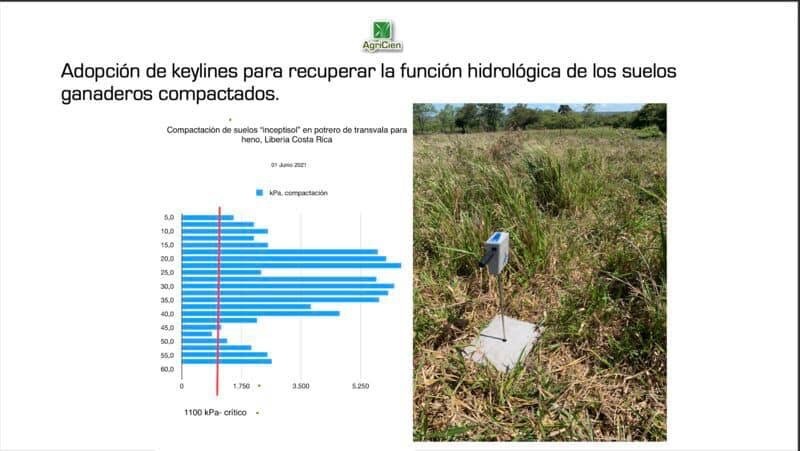
- JOSÉ MA. AGÜERO, AGRICULTURA CIENTÍFICA SA, Costa Rica
The contact from Costa Rica is a consulting and agricultural technology company that has decided to open its own line of action to combat soil degradation and promote an improvement in the economy of rural producers. The company is duplicating the testing work described in the research description. They plan to share with graziers they work with.
Milestones
20,000 farmers in the Northeast learn about the pasture compaction research and education project through an article written and circulated through publications such as OnPasture, NY Grazette, Northeast Country Folks, American Agriculturalist, and regional grazing publications. Readers will learn about the project and will be alerted of project activities and events. The article will also suggest farmers use push-in posts to compare compaction on their home farms.
20000
30000
200
April 30, 2019
Completed
October 30, 2019
Versions of this article, Compaction and Soil Health in Northeast Pastures Blog, were hosted at the following sites:
https://www.morningagclips.com/learn-about-compaction-soil-health-in-northeast-pastures/
https://www.farmprogress.com/crops/soil-health-trailer-provides-tools-compaction
https://www.facebook.com/nysoilhealthtrailer/posts/?ref=page_internal
https://www.nrcs.usda.gov/wps/portal/nrcs/detail/ny/soils/health/?cid=nrcseprd1293219
https://www.la-basse-cour.com/blog/compaction-and-soil-health-northeast-pastures
30 grazing educators from the Northeast will attend a 6-hour training where they will be trained on soil health and compaction on grazing operations in the Northeast and this projects role in reducing compaction. The training will be given by Fay Benson, Larry Hepner and Bob Schindelbeck. After this training, educators will be asked to plan one pasture walk per year for the duration of the project. We will use a pre- and post-test at the training to evaluate learning.
30
19
May 31, 2019
Completed
December 29, 2020
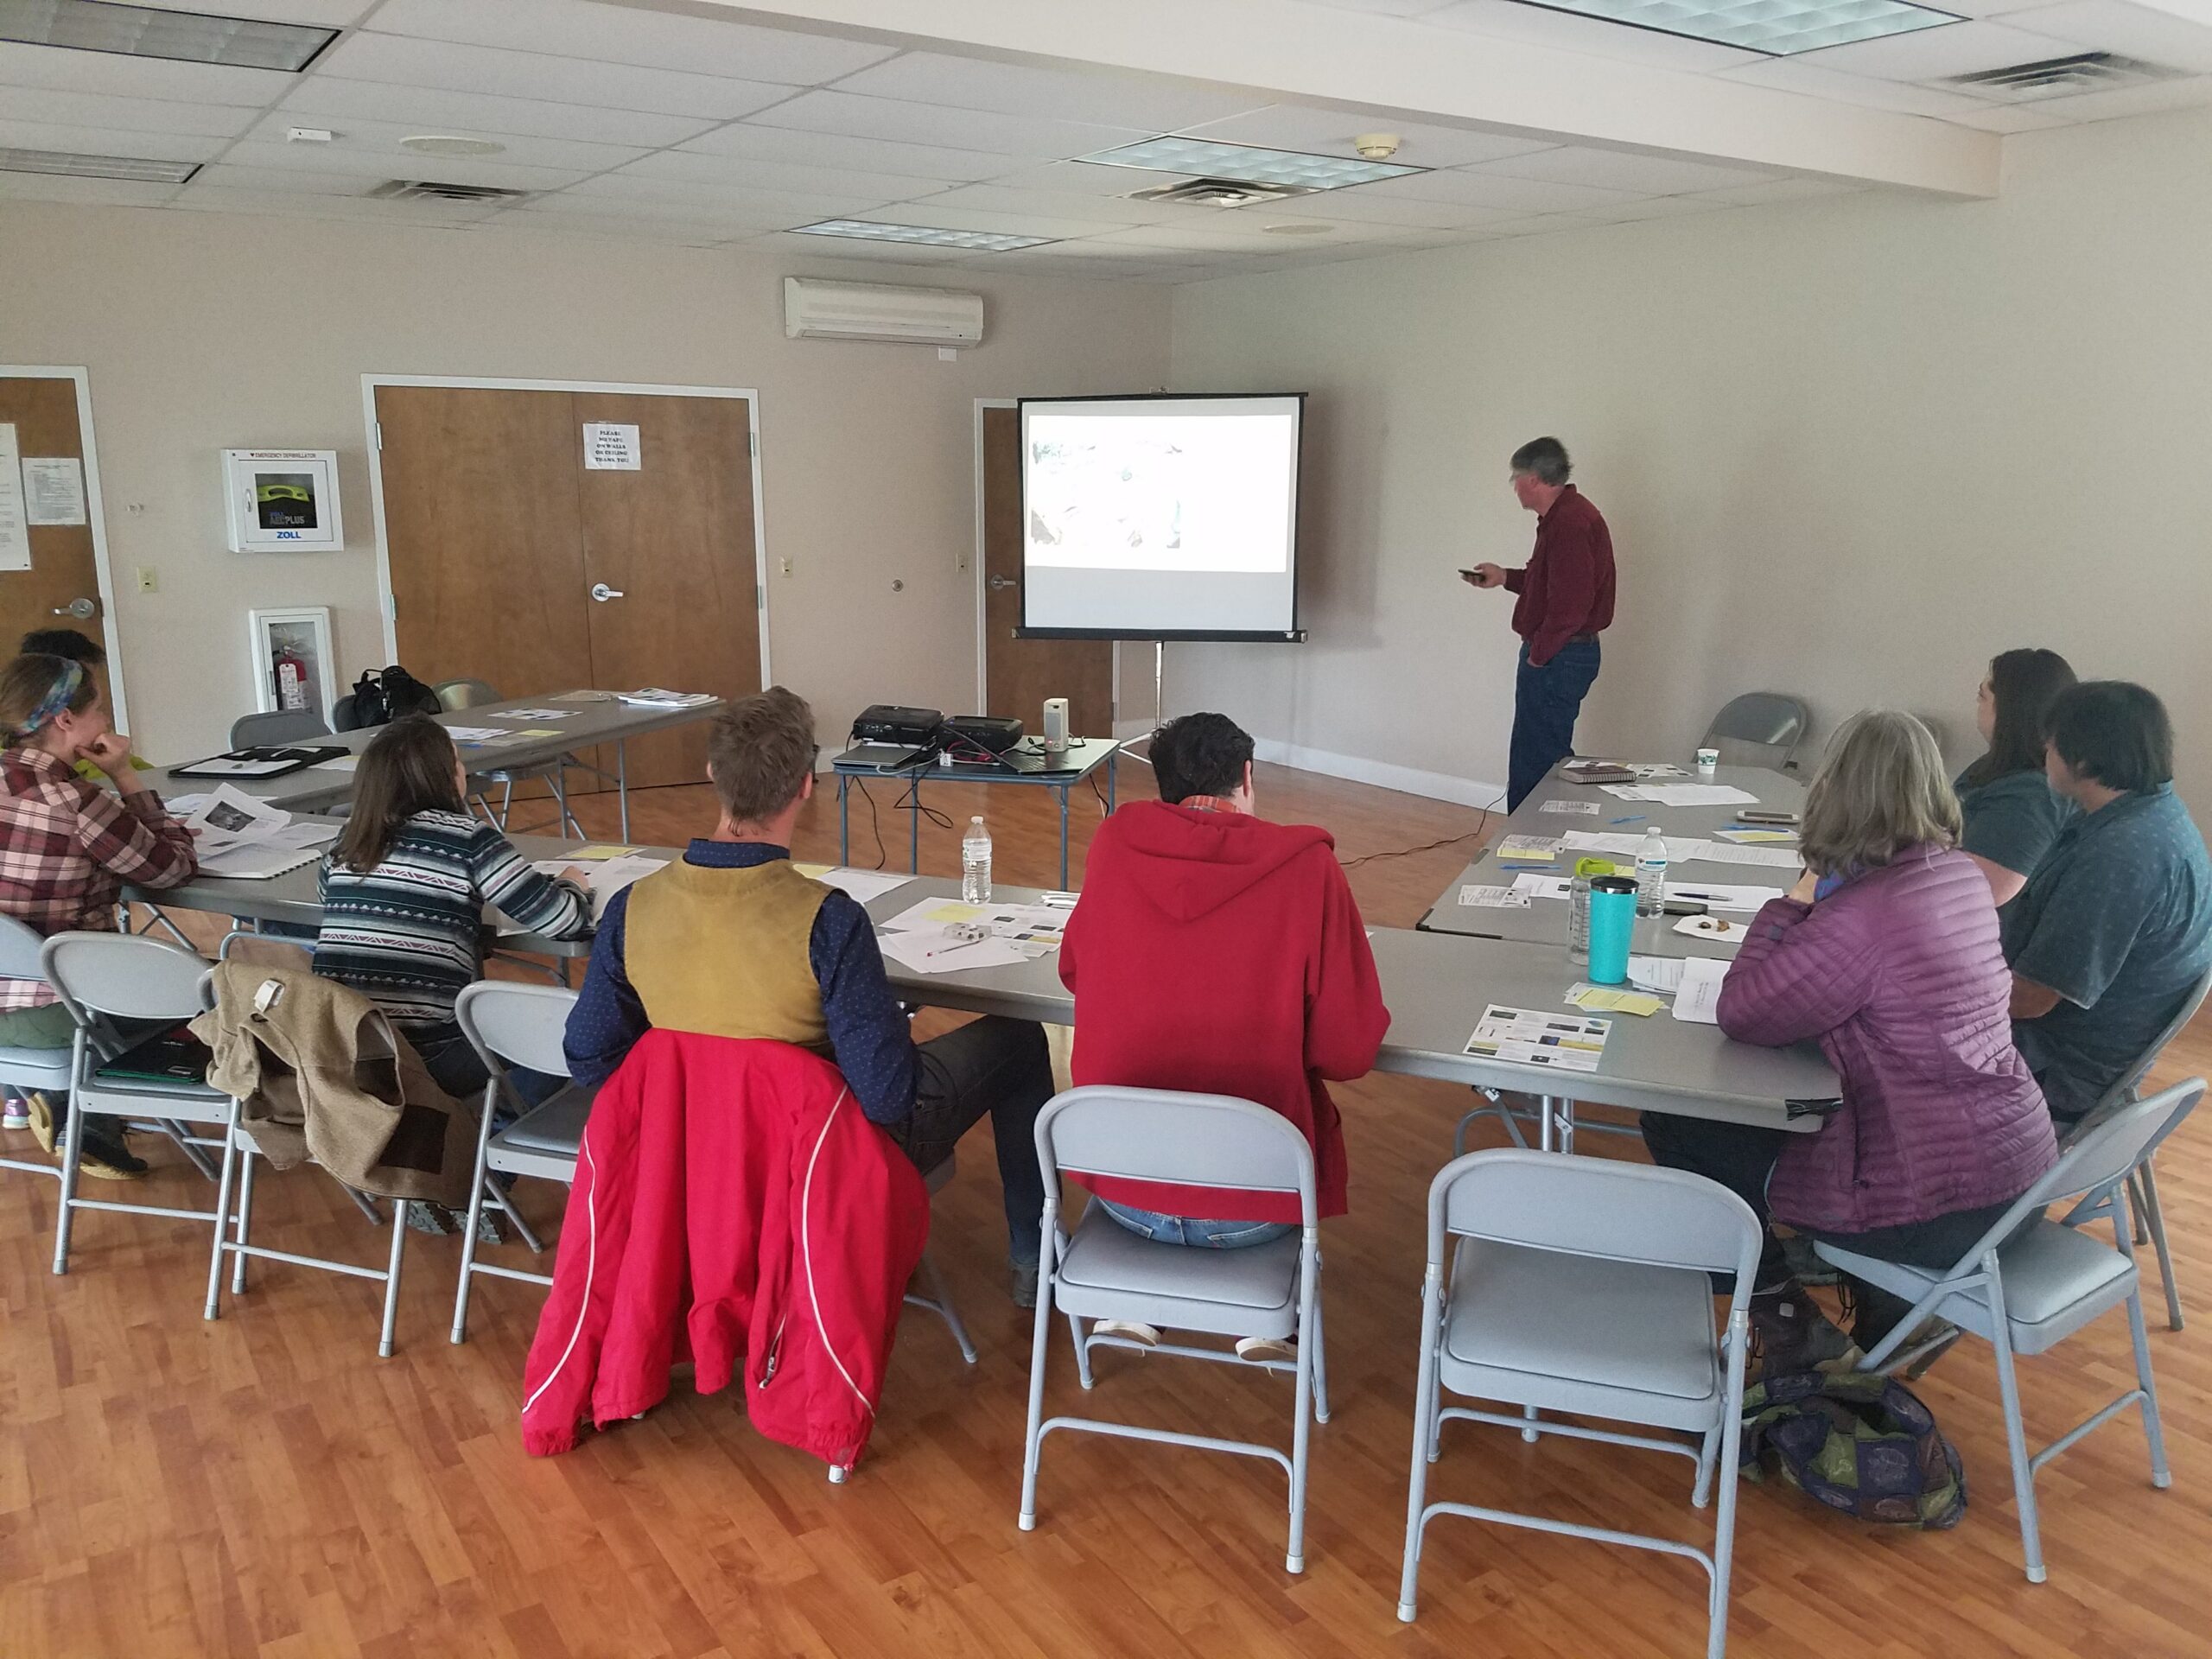
We held two train-the-trainers meetings: One on April 26th in Hoosick Falls, north eastern NY, and another on May 3rd in Jasper, south western NY. Presenter's talks included: Fay Benson - Introduction to Pasture Soil Compaction, Larry Hepner - “Identifying Soil Structure Changes When Compacted”, and Bob Schindlbeck - “Plant/Soil Interaction and how it is affected by soil compaction”.
15 grazing educators plan at least one pasture walk each. The pasture walks will take place in New York, Pennsylvania, Vermont and Maine. The Soil Health Trailer will attend each event for a demonstration to reach a total of 300 farmers. Demonstrations include with the New York Soil Health Trailer, including the slake test, percolation test, active carbon test, rainfall simulator and compaction test.
300
15
400
30
October 31, 2019
Completed
October 19, 2019
Some of the educators who attended the trainings organized events in their area. We participated in 12 events but had the good fortune to have the Soil Health Trailer at "Grasstravaganza." We hosted "Pasture Soil Compaction" as one of four outdoor stations at the event. Each of the 110 attendees rotated through the presentations.
Here is a list of all the events the project team participated in in 2019: 2019 eventlist.
300 will work in groups to collect data points for the Pasture Compaction Ration. A total of 400 points will be collected from each pasture walk resulting in 4 Pasture Compaction Ratios per pasture walk.
300
400
30
October 31, 2019
Completed
October 19, 2019
At each event we supplied 4-5 penetrometers to teams to measure in the pasture and then under a near by fence line. The teams reported back their measurements and took plant ID's from each area. The exercise created a lot of interest at each event since there was such difference between the two areas. As Rick Kersbergen, Extension Associate from University of Maine, pushed the penetrometer into the fence line soil after having done the pasture readings declared "Holy Moley." His experience was similar to many who made the measurements.
15 grazing educators will return to the pasture walk location monthly to collect follow up compaction numbers. They will take an additional 10 points per farm per trip for two return months. This will result in 6 Pasture Compaction Ratios per farm.
15
4
3
October 31, 2019
Completed
October 21, 2019
This part of our project was impacted by the Covid Restrictions. Our educators could not return to follow up on additional readings. We received only follow up readings from three of our educators. Because of the restrictions the project requested a change from educators following up to get data. We requested to increase the amount of data collected in the research portion of the project. In hind sight this improved the project since having different people collecting data caused for a lot of variation, as can be seen in the data below. Having one person collect the data reduced the variability.
20,000 farmers in the Northeast learn about the pasture compaction research and education project through articles written and then circulated through publications such as OnPasture, NY Grazette, Northeast Country Folks, American Agriculturalist, and regional grazing publications. Readers will learn about the project and will be alerted of project activities and events. The article will also suggest farmers use push-in posts to compare compaction on their home farms.
20000
50000
1000
April 30, 2020
Completed
January 20, 2022
Compaction and Soil Health in Northeast Pastures Blog
The Compaction Fact Sheet below was prepared during our 2019 tour. It was given out to the farmers who attended and also sent by email to those (about 10 individuals) that had questions on how to manage pasture compaction. The Fact Sheet was also published in the South Central NY Dairy and Field Crop Digest. It was also uploaded to the NY Soil Health Trailer Facebook acct.
To provide outreach on the final results of the research work for the project, three activities were undertaken:
Dec 6th 2021, the PI was invited to speak at the National Grazinglands Coalition meeting in Myrtle Beach SC. A PowerPoint of the work done on this project was presented. A copy of this is attached to the report. There were 36 attendees at the talk. From this presentation there were numerous discussions at the conference but more importantly there were follow up emails from two of the attendees. These conversations continue.
January 2022, two articles were written to explain the takeaways for the project: One was written for the mainstream agricultural media. It described the takeaways of the research component of this project. A second article was written to provide the more technical explanations of the results of the PCR. This second article was sent to service providers and the link to it was included in the first article for those that wanted more information.
I hired a publicist, Kara Dunn to help edit and promote the mainstream article: “The Slow and Furtive Nature of Pasture Soil Compaction” She reported that this article was reprinted in:
- NE Country Folks 2/14/22 - Circulation; 40,500 with 50% farmers
- Morning Ag Clips 1/30/2022 - Circulation: 10,222 with 50% farmers
- Lancaster Farming in their New York Farm Show issue - Circulation 6000 with 80% farmers
- New York Ag Connection - Circulation: 5000 with 60% farmers
- South Central NY Dairy Team Digest - Circulation 615 with 90% farmers https://scnydfc.cce.cornell.edu/submission.php?id=1495&crumb=soil|7
- Cornell Sheep listserv, 1-28
- On Pasture requested pdf copy, 2-11
- Cornell Field Crops Blog, 1-28
- American Agriculturist Online
The more technical article was a link to the above article: “A Possible New Technique To Monitor Soil Compaction” https://scnydfc.cce.cornell.edu/submission.php?id=1477&crumb=soil|7
250 will work in groups to collect data points for the Pasture Compaction Ration. A total of 400 points will be collected from each pasture walk resulting in 4 Pasture Compaction Ratios per pasture walk.
250
436
October 31, 2020
Completed
August 24, 2021
In 2020 due to the need to isolate only one of our Agricultural service providers and the PI had permission to visit farms to take compaction readings. In order to still collect enough data to study the use of the "Pasture Compaction Ratio" (PCR) the PI made up to eight visits to nine paddocks. Below (Milestone 8) are graph representations of the compaction readings in the pasture and under the fenceline and the resulting PCR which was arrived at by dividing the pasture reading by the fenceline reading.
The intended milestone was changed sue to the Covid restrictions. The only follow up data collections were done by the PI and the three farms he tested. He had permission to do this provided that he not meet with the farmers, although there were conversations about the work held outside at a safe distance.
4
3
3
December 31, 2020
Completed
October 21, 2021
Due to the interruption caused by the Covid-19 pandemic the PI requested a change to the focus for the milestones for 2020. The request was to reduce the number of on-farm education events from fifteen to one event, and increase the research component from in-depth compaction readings from four paddocks to nine paddocks.
Additional Testing: Two soil samples from Adams and Carey paddocks were submitted for the Cornell Soil Health Assessment. Below are the key portions of those reports. The Cornell Soil Health Lab has agreed to cooperate again with samples for next year's data collection. The project would like to see what soil composition (proportion of sand, silt, and clay), Organic Matter, and other soil health measurables have if any on the PCR data.
At conclusion of data collection for the Pasture Compaction Ratio in December of 2020, the project team will evaluate the data to determine the Standard Deviation of the readings and comparison of the plant species reports. The team will attend three conferences attended by 200 people and write one article about the findings of the project.
200
May 31, 2021
Completed
December 06, 2021
Submitted the data for the eleven paddocks tested for 2020 and 2021 to a panel of agronomist and soil scientist for review. It was determined that the variation in the PCRs was too wide for analysis of repeatability. The suggestion was that the data could have been aided if soil moisture testing had taken place at the same time of the penetrometer readings.
Dec 6th 2021, the PI was invited to speak at the National Grazinglands Coalition meeting in Myrtle Beach SC. A PowerPoint of the work done on this project was presented. The slides from the presentation can be found here: https://projects.sare.org/?post_type=information_product&p=855553. There were 36 attendees at the talk. Future talks have been planned in Canton NY on March 3, 2022 and five pasture walks in Conn. Mass. and RI. during the week of June 20th 2022.
15 grazing educators plan at least one pasture walk each. The pasture walks will take place in New York, Pennsylvania, Vermont and Maine. The Soil Health Trailer will attend each event for a demonstration to reach a total of 300 farmers. Demonstrations include with the New York Soil Health Trailer, including the slake test, percolation test, active carbon test, rainfall simulator and compaction test.
300
15
539
July 31, 2021
Completed
October 20, 2021
15 in-person events were held over the course of the project. Below is the list of on farm events that took place during the entirety of the project. Three additional events were held in 2021. At least five more are planned for 2022.
300 will work in groups to collect data points for the Pasture Compaction Ration. A total of 400 points will be collected from each pasture walk resulting in 4 Pasture Compaction Ratios per pasture walk.
300
93
July 31, 2021
Completed
August 24, 2021
There were no pasture walks in 2020 due to Covid. In 2021 with the No-cost extension we were able to hold three pasture walks with the NY Soil Trailer. Total attendees for 2021 was 93 farmers. Troy Bishopp (The Grass Wisperer) wrote about one of the pasture walks.
| Attendees | ||||||||
| August 18, Pasture Walk in Candor. | 15 | |||||||
| August 24th, Pasture Walk Ontario Co. with Soil Trailer | 36 | |||||||
| August 24th Pasture Walk Yates Co. with Soil Trailer. | 42 | |||||||
Fay.Benson_Capturing Rain is a Full-time Job for Grazing Dairies
The increased data collection on nine paddocks will be expanded on to include more Cornell Soil Health Tests, in particular we will collect "Soil Respiration" rates of the nine paddocks. This information will help farmers understand that compaction reduces the size of pores in the soil and whether this reduction negatively affects the soil's ability to recycle nutrients in the soil.
500
50
3
October 29, 2021
Completed
October 20, 2021
Reviewing the Cornell Soil Health Assessment for the Carey and Adams pasture and fencelines, we found very little difference in the areas tested except for the compaction readings. This is due to the inability of one penetrometer reading to be compared to another reading since the soil moisture will have changed. This inability for monitoring of compaction of all soil health assessments was the premise for the PCR. Although this project didn't come up with a final solution it has provided information for soil scientist to do more research to use the premise of a ratio which includes penetrometer plus additional data such as soil moisture to be used in the future of soil health assessments to monitor soil compaction.
3pg SH Assessment Adams. 2020
2021 Comprehensive Assessment of Soil Health Carey Fenceline
2021 Comprehensive Assessment of Soil Health carey past.
Milestone activities and participation summary
Educational activities:
Participation summary:
Learning Outcomes
The one on one discussions with farmers through our pasture walks were the most affective at providing knowledge to farmers. of the more than 500 who attended we did have follow up communications with 23 of them to ascertain changes in management.
We reached at least 2000 farmers, graziers, and service/educators through the six articles written on the subject. We had six responses from this audience.
Our first goal with this project was to make farmers aware of compaction as potential weak point of the pasture's soil health. Prior to proposing the project the PI had seen numerous occasions where graziers had not realized that their pastures had become compacted and that the compaction had reduced the productivity of those pastures. As with other soil health indicators, change (either positive or negative) happens very slowly. In the case of pasture soil change happens over 5-10 years. Graziers that graze with a management style that works for a couple of years may not realize the slow reduction in productivity. At our more than fourteen pasture walks, we reached more than 500 farmers and gave them penetrometers to measure the compaction in the pasture and then right next to that they read the readings for the fenceline. Most attendees were surprised at the compaction levels of the pasture that were 1.5 to 2.5 times more than the fenceline.
The change in knowledge from our research findings of using the ratio between these two areas as a monitoring tool has just begun. The project team was surprised to find how fast compaction was reduced when switching from an overgrazed pasture to hay production. It also became clear that reducing the compaction with this change in management didn't affect the productivity of the soil. The damage to productivity came from the length of time (years) that the soil had remained compacted and the eventual change in pasture species which could survive in compacted soils.
Performance Target Outcomes
Target #1
20
Grazing management change in response to soil compaction.
The change in management will affect 1000 acres.
The change sought from this project would be a prevention of compaction. Unable to quantify a preventive change.
13
Some graziers switched to grazing more mature swards. This allowed longer rest periods before animals were introduced to a paddock, it also allowed roots of the sward to grow more thus reducing compaction and increasing root exudates in the soil. Others alternated paddocks from hay production to grazing more often.
Carey, 350 acres + Belding, 45 acres +Sheffer, 300 + Gould, 250 acres + Scheffler, 120 acres = Total Verified -1065 acres
Was unable to measure benefits of a soil health indicator in just a couple of years.
As stated earlier it is difficult to measure a soil health indicator. Our Verified information came from direct knowledge of farms we advised during the project plus the follow up survey we did of graziers who attended our events. The responses to our survey was only eight and can be found here: Qualtric Report.
6 of 8 respondents indicated their knowledge of soil compaction increased. 5 indicated they had changed their practices by trying to keep animals off of wet soils, 3 allow pasture plants to mature before grazing, and 2 practice more frequent animal moves and monitor organic matter in the soil.
Some respondents said:
"I appreciate Fay's inclusion of both the theory and science, AND the practical, boots-on-ground recommendations!"
"Fay Benson has been a passionate leader, practical teacher and an inaugural resource for learning about soil health and its importance to farmers."
Additional Project Outcomes
Interest in this project was substantial from the beginning. Attendance at our "Train the Trainer", follow up pasture walks, all showed the interest in soil health in pastures. As the research component progressed the new knowledge we had to share increased. Some of the information that we reported in articles, presentations, and the fact sheet generated included:
- The loss of pasture productivity caused by soil compaction came from the change in plant species which made up the grazing sward.
- Our study of installing an enclosure on an over grazed, compacted pasture provided multiple points of new knowledge.
- First that the use of the "Pasture Compaction Ratio" was capable of monitoring the change in soil compaction when management changed.
- Secondly the PCR indicated that the change happened only after the soil warmed up in the beginning of the grazing season.
- After the compaction decreased in the enclosure the grazing sward did not improve in production.
The data from the enclosure study only became known towards the end of the project. The two articles written and the presentation given at the National Grazinglands Meeting has generated much interest. This was indicted by:
- The contact from a grazing consultant in Costa Rica who intends to duplicate the study in his country as a way to help the graziers he works with.
- The invitation from the Three State SARE project to speak on soil health in pastures at events in the summer of 2022.
- American Agriculturalist published the Article "THE SLOW AND FURTIVE NATURE OF PASTURE SOIL COMPACTION" in their online publication in January 2022. They contacted the PI that the article was one of the top five articles requested for that month.
From an email of a multi specie grazing operation in Northern NY; After reading our article "we switched to tall grazing with a goal of 60 day recovery period and hopefully leaving 4” of residue. I call it Holistic Management Intensive Grazing. The impact on soil health, sward productivity, and animal health has been amazing."
From a Costa Rican grazing consultant: "I’ve been working with ranchers in Costa Rica to raise awareness on this silent problem that robs them productivity and income every day of the year. The attached picture illustrates how serious soil compaction is in our soils. I would like to know more about the PCR criteria and compaction alleviation strategies you may be recommending to ranchers. I look forward to your reply"
Follow up email from Costa Rica;
The problem of pasture compaction is universal among graziers. One of the barriers to graziers managing it is because of its furtive nature. The productivity changes that happen from it are very slow so the graziers don't notice it. The other barrier is that it is difficult to monitor because lack of a measurement technique. The concept of using penetrometer readings from two points in the pasture, one being in the pasture itself and the other in a non-compacted area under the fenceline, was a good one. The Pasture Compaction Ratio is "relatively" accurate monitoring tool. What needs to be studied is a way to improve its repeatability. One method is to combine the penetrometer readings with collecting soil moisture at the same time.