Final report for LNE19-378
Project Information
Irrigation helps grow agricultural crops in dry areas and during periods of inadequate rainfall. Effective irrigation strategies can help reduce water usage and increase crop yield and quality. Sensor-based irrigation strategies and systems were investigated in this research for fruit and vegetable crops. Firstly, three irrigation strategies (soil moisture, evapotranspiration (ET), and crop water stress) were studied and compared, and among them soil moisture based irrigation was selected for further evaluation. Different types of soil moisture sensors were then tested for different crops, with evaluation on water use efficiency and crop quality and yield. An automatic irrigation system was developed with a communication protocol named 'long range range wide area networks' (LoRaWAN) technology and internet of things (IoT). With this system, irrigation valves can be automatically turned on and off based on the soil moisture threshold settings. In overall, the research outcomes provided growers an irrigation solution with potential to automatically irrigate farms based on soil moisture conditions. During the project, we also disseminated research outcomes to growers in many different extension events, including regional grower meetings, field days, on-site demonstration, workshops, and extension publications. In total nine growers installed the soil moisture sensor sets in 16 different fields including tree fruit, small fruit, and vegetables. With understanding the importance of precision irrigation presented through the extension activities, we believe there will be many more growers who are interested in adopting this technology in near future.
Forty fruit and vegetable growers with 1,000 acres of crops adopt precision irrigation methods to optimize water usage, ten of these farms report an increase in average crop yield as a result of improved irrigation.
The primary goal of this project was to provide an effective sensor-based irrigation system to fruit and vegetable growers, and enhance the practices for growers to implement the technology in their farms through various educational activities. During the project, some research studies were carried out to investigate the effective irrigation strategies for growers, and an IoT based precision and automatic irrigation system was designed and evaluated. The research results were shared among the professional societies through presentations, conference proceedings, and journal articles. This grant also provided training opportunities to one graduate, two undergraduate students, and a few technicians and extension educators. Extension publications and presentations were provided by project team to various audiences including growers on the outcomes from these studies. A brief survey was sent out for the importance of precision practices in plant and soil water monitoring. A series of on-farm experiment trials were started with some representative growers, and trainings on installation and system management also provided to them. With the awareness and understanding of these technologies through our extension activities, the interest of adopting precision irrigation system among growers has greatly improved.
Cooperators
Research
1) What is the most effective evapotranspiration (ET) and/or soil-moisture sensor-based system for irrigation scheduling? Various treatments will be investigated to identify the irrigation scheduling strategies using ET, and soil moisture sensors.
2) What sensor data is most effective for real-time control of an irrigation system? An automated precision irrigation system will be developed based on the wireless sensor networks, embedded controls, and data analysis.
3) How effective and sustainable are automated precision irrigation systems? Cost, efficacy, impact on water and nutrient productivity, yield and quality of different automated precision irrigation systems will be assessed in fruit and vegetable crops.
1. Identification of irrigation strategies for apple orchards
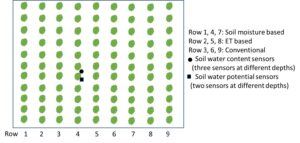
A sensor-based irrigation test was conducted at Fruit Research and Extension Center research orchard at Biglerville, PA. This is a 0.9-acre Fuji block, located at a location with relative high elevation. There are total nine row of apple trees. The emitter space along the tube is 24 inches, the size of the tube is 0.5 inch. Three irrigation strategies were used, including conventional irrigation, soil moisture sensor irrigation, and ET irrigation. There were three rows of trees for each treatment. The layout of the field and experimental setup are shown in Figure 1.
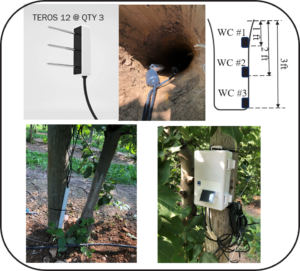
Soil moisture-based irrigation: In the soil moisture based irrigation, three soil water content sensors (TEROS 12, Meters Group, Inc.) were installed at three depths of 1, 2, and 3 ft, and another two soil water potential sensors (TEROS 21, Meters Group, Inc.) were installed at two depths of 1.25 and 2.75 ft, as shown in Figure 2. A wireless communication datalogger (ZL6) was used in the system to record the sensor data. Users could access the soil moisture data with phone or computer through internet. Soil water content and soil water potential values were monitored and recorded through a web based cloud service (Zentra Cloud). In our study, once the soil water content reached to 0.3 m3/m3, the irrigation was applied to the corresponding rows. The values of soil water potential were used as reference and comparation.
Evapotranspiration (ET)-based irrigation: The daily reference ET (ETr) was calculated using the Hargreaves model, which was described in detail in FAO-56 Hargreaves equation. The model must be modified to suit different growing conditions and the disparate plant architectures of tall discontinuous crops like fruit trees. Then the reference ET was adjusted by local crop coefficients Kc. In this study, we used a constant value of Kc=0.9 for apple tree orchard through the season, even the Kc could be slightly different at different crop growing stage. For simplification, the effective rainfall was assumed to be equal to the amount of rainfall from the nearby weather station. The daily water deficit was defined as the input water (rainfall) subtracting the daily evapotranspiration. The water deficit was calculated daily, and it was accumulated through the time. When the water deficit reaches certain value setting to 25.4 mm (1 inch), then the irrigation will need to be scheduled. Our irrigation goal was to reduce the water deficit to zero. In our calculation, if the rainfall/irrigation was greater than the current accumulated water deficit, the value of accumulated water deficit was set to zero at the end of the day (the extra water was regarded as run-off). The water deficit was set to zero at the beginning of the season, with soil water content at field capacity was added to soil prior to the test.
Conventional irrigation: The conventional method for irrigation in the test block was based on experience.
Data analysis: At the end of the season, three irrigation strategies were compared in different ways, such as total water use, crop yield and quality.
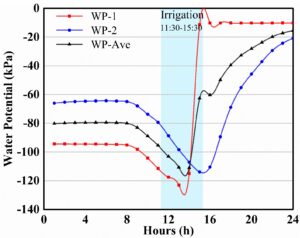
2. Investigation of the internet of things (IoT)-based precision irrigation system
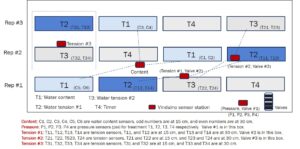
Precision irrigation with sensor-based decision making system has been approved to be effective for water saving in crop production. Internet of things (IoT) system is necessary for monitoring the real-time data from sensors as well as automatically applying water. LoRaWAN, a new low-power wide-range network technology, is low-cost and easy to architect in IoT systems that can be used for precision crop irrigation. In our study, an IoT-based precision irrigation system with LoRaWAN technology was developed and evaluated for a high tunnel vegetable field . Four different irrigation treatments were set for the test field, including timer, soil water content, soil water potential #1, and soil water potential #2. The field was divided into sections (15 ft long for each section), and three replicates were used for each treatment. The field layout and experimental design are shown in Figure 3.
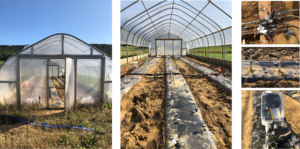
The overview of the experiment site, the solenoid valves for turn on/off the irrigation system, and the sensor/control box is shown in the figure 4. Soil water content sensors (TEROS 10) were installed at two depth (15, 30 cm) at each section using soil water content-based irrigation, the same to the water potential sensor (Watermark 200SS-5). For the timer-based irrigation, there was no sensor installed at these sections. The sensor boxes are Vinduino R3 sensor stations. Program was developed for these boxes to record different types of sensor data, and communicating with Gateway to upload these data to a IoT platform.
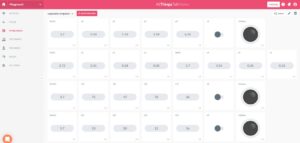
In our study, sensor data was recorded and uploaded to an IoT platform called 'allthingstalk' for monitoring and automated irrigation control. Thresholds were set for each irrigation method to start and stop the irrigation. In the interface from the platform (Figure 5), the sensor data is updating with the designed time interval, for example 10 minutes per data. The status of the solenoid valves are presented in real-time, for example Black-close, and Green-open. The valve control can be done manually from the interface by clicking the buttons, while it could also be set up to run automatically through the program. In this study, we used manual option. We will further develop our system to achieve full automation.
3. IoT based irrigation system for open field tomato production
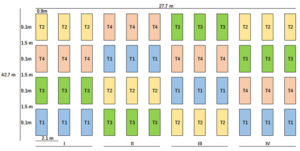
A set of experiments were conducted at the open field of the Penn State Russell E. Larson Agricultural Research Center (Furnace, PA) using tomatoes as a test crop (Figure 6). Four irrigation schedules were designed and tested, including one based on crop evapotranspiration (ETc) (Treatment 1), two based on soil matric potential at different setpoints #1 -60kPa (Treatment 2), #2 -40kPa (Treatment 3) and a decision making system GesCoN (Treatment 4).
Figure 6. Experimental design (with four treatments) and field view of the sensor-based irrigation for open field tomato
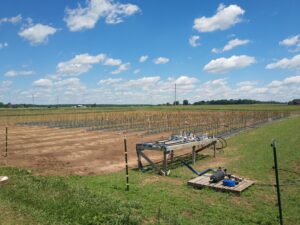
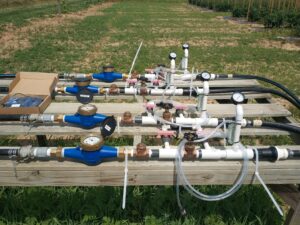
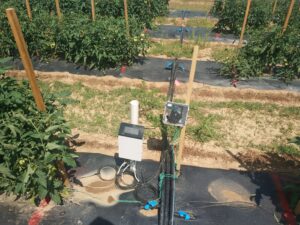
Four main pipelines were set in the field, one for each treatment (Figure 7 left). For each treatment, 4 matric potential sensors (Watermark 200SS-5, Irrometer company, Inc., Riverside, CA) were installed in two bed locations at two depths (20cm, 40cm). The average matric potential of two sensors at 20 cm was used for the irrigation threshold in the treatment 2 and 3. Pressure sensors was installed behind the valves to indicate the status of the irrigation system (on or off). The major components of the data loggers included a base control board (Vinduino LLC, Temecula, CA) and a LoRaWAN wireless communication unit with antenna (LM130-H1, GlobalSat WorldCom Corp., New Taipei City, Taiwan), as shown in Figure 7.
Figure 7. Irrigation system setup, sensors, and data logger for the open field tomato irrigation test
4. Investigation of optimal sensor installation locations in drip irrigation for fruit orchards
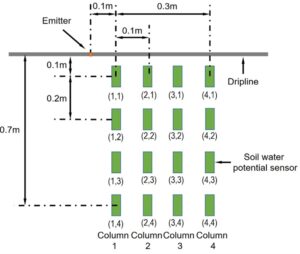
It is important to investigate the water movement underground for soil moisture based irrigation, which can guide soil moisture sensors placement for a well-designed soil moisture based irrigation system. An IoT system was developed to measure the soil moisture during irrigation events. The system included sixteen soil water potential (SWP) sensors, a LoRa communication system, a local gateway, and an IoT cloud server. Four columns of sensors with four sensors at each column at different depths were installed along a dripline close to an emitter. The lateral distances of two neighboring sensors at the same depth were 0.1 m, and the vertical distances between two neighboring sensors in the same column was 0.2 m. The distribution of the sensors is illustrated as figure 8.
Figure 8. Distribution of soil water potential sensors for the water movement test
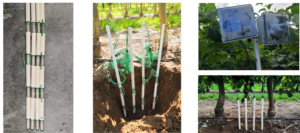
Figure 9 shows the sensor and field setups for the optimal sensor installation test. A pre-installation procedure was applied according to the instruction. The sensors were cemented onto the pipe. A small hole was drilled at the bottom of PVC pipe to align with the slot at the top of the sensor housing. This allows any water that gets trapped in the pipe to drain away. Four SWP sensors were installed as a single assembly to make field installation easier. The wires from the lower sensors were routed out a hole below the upper sensors and then routed back into the pipe through a hole above the sensor to keep all the wires contained inside the pipe sections where possible. The SWP sensors were placed in the pre-selected locations in an orchard. The sensors were connected to a datalogger. Data was recorded and accessed with the 'Allthings Talk' IoT platform (details in the materials and methods #2).
Figure 9. The water potential sensors and field setup for the sensor optimal installation test
5. Study on IoT based automated irrigation system for peach orchard
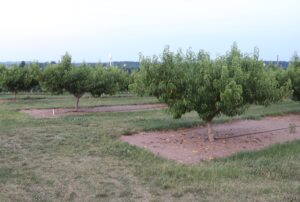
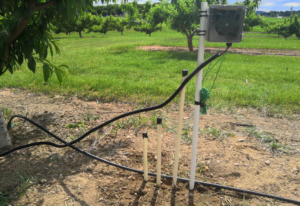
In 2021 spring, we have developed an automated irrigation system with an internet of things (IoT) sensing system. The field test is conducted in a peach orchard at Penn State Fruit Research and Extension Center (FREC) with drip irrigation system (Figure 10). The pressure gauge was regulated at 40 psi pressure for the irrigation system. Three watermark soil water potential sensors were installed at three depths (1, 2, and 3 ft) in the field. A solenoid valve was installed in-line on a PVC pipe to turn on or off water to the test block remotely according to the soil moisture level.
Figure 10. The overview of the peach orchard, and the sensors and datalogger in the field
The experiment system include four major components, including electric water pumping system, watermark soil moisture sensors (three sensors), a solenoid valve, and a pressures sensor (Figure 11). With this system, Penn State Extension is willing to provide assistance should questions arise concerning device installation and operation.
Figure 11. Components used in the developed precision irrigation system. From left to right: pump controller, soil moisture sensors, solenoid valve, and pressure sensor.
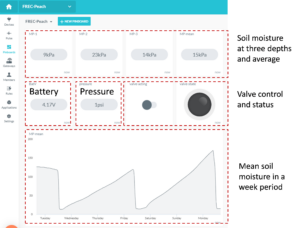
An IoT platform (Allthingstalk) was used for the sensor data display and valve control (Figure 12). The interface includes current soil moisture readings (individual sensor data and mean value), valve control (acting button and status indicator), water pressure sensor reading, battery voltage, and a chart of the mean soil moisture in a week (this can be set at different durations). When the irrigation is off, the valve status indicator shows black. When the irrigation starts, the valve status indicator turns to green, the water pressure jumps to a high positive number, and the readings of soil moisture sensors starts to decrease (smaller number means wetter). When the soil moisture reaches the setting threshold (for example, the mean value of 15 kPa), the valve will be turned off, the valve status indicator turns back to black color, and the pressure drops quickly.
Figure 12. The Illustration of IoT platform interface used developed in the study
6. Development of IoT sensor-based irrigation for soilless basil
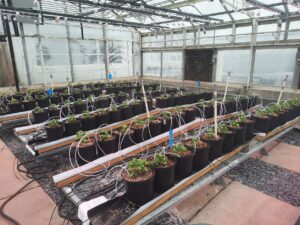
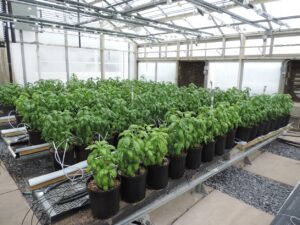
The objective of the study was to develop and test the efficacy of an IoT sensor-based precision irrigation system employing LoRaWAN technology using basil grown in a peat and perlite medium-based soilless system (Figure 13). Soil matric potential sensors and volumetric water content sensors were compared, and different set-point (thresholds) were tested. Three tests were conducted using green Genovese basil. Besides measuring the performance of the IoT sensor-based automated irrigation systems, treatments tested were evaluated assessing the performance of the crop in terms of plant growth, plant physiology, yield, and quality. Moreover, the impact of alternative irrigation scheduling on substrate nutrient content, pH and EC and plant nutrient uptake were assessed.
Figure 13. Sensor-based IoT irrigation test for basils in greenhouse environment
1. Sensor-based irrigation strategies
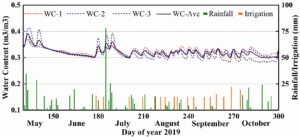
Soil water content: Figure below shows the daily average soil water content through days. Meanwhile, the rainfall and irrigation events were presented as well. In the Figure 14, WC #1 to WC #3 represent three water content sensors from top to bottom in the ground. Water content, rainfall, and irrigation are also illustrated. A threshold was set for the irrigation, in this study, 0.30 m3/m3 was used for the threshold. As shown in Figure 14, the water contents were slightly different at the three depths. The water content values from three sensors increased after a few hours of irrigation, and reached the field capacity at the end of the irrigation event.
Soil water potential: Figure 15 shows the daily average soil water potential through days. In the Figure 15, WP #1, and WP #2 represent two water potential sensors from top to bottom in the ground. Water potential, rainfall, and irrigation are also illustrated. A threshold was set for the irrigation, in this study, -80 kPa was used for the threshold (different soil type has different threshold). After the irrigation event, there is an obvious change of the soil water potential, which went close to -10 kPa. The water content reached the field capacity at the end of the irrigation event.
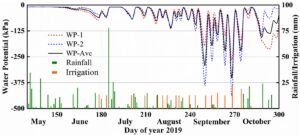
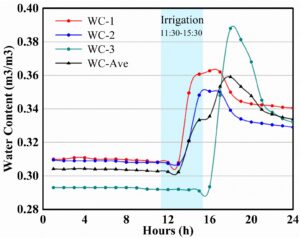
In the late season (September to Middle of October), we reduced the irrigation event to avoid crop cracking. We can see that the water potential is more sensitive than water content sensors. Even the water content readings only slightly lower than 0.3, while the water potential readings could rapidly drop to big numbers. Figure 16 shows the hourly soil water moisture change during an irrigation event. As shown in the figure 16, it took some time for the readings of the sensors to change after the irrigation starting, that because the sensors were at certain depth underground. Therefore, the location of the sensors to the emitters could be critical for how fast the changing of readings.
Figure 16. The soil water content (left) and water potential (right) change during an irrigation event
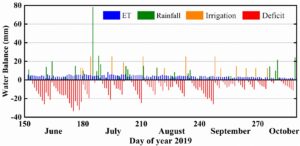
ET-based irrigation: as shown in Figure 17, the daily ET, estimated deficit based on the calculated ET, irrigation and rainfall are presented from early June to the middle of October. In our calculation, if the rainfall/irrigation was larger than the current water deficit, the value of water deficit was set to zero at the end of the day.
Comparison of three irrigation strategies: at the end of the season, three different irrigation strategies were compared in the table 1, including water use, and crop yield and quality. In overall, the water use for three irrigation setups were 8.7, 11 and 9.2 inches. ET-based and conventional irrigation had slightly higher water use than soil moisture sensor based method. The conventional method had least crop yield per tree, and the soil moisture based method achieved highest. The average crop size in soil moisture-based irrigation is smaller than other two methods. The first row of the block, there were more fruits but with smaller size by comparing to other rows, which may be affected by the efficacy of the chemical thinning.
Table 1. The comparison of different irrigation strategies on water usage and crop production
| Irrigation strategies | Overall water use (inch) | Crop yield/tree (kg) | Crop size (g) | Hardness (Kg) | Soluble solids (Brix) |
| Soil moisture-based | 8.7 | 28.2 | 247 | 8.0 | 16.1 |
| ET-based | 11 | 23.1 | 260 | 7.9 | 16.0 |
| Conventional | 9.2 | 18.8 | 265 | 8.2 | 16.0 |
2. IoT based automated irrigation system
The preliminary results indicated that the sensor data was updated in the IoT platform (website) as expected, and the developed IoT system worked properly for the valve control for the irrigation events. We observed that there were some data loss during the time, as well as the battery dead in the soil water content sensor box. These are the issues that we are going to resolve in our future studies. The results on the water use efficiency as well as crop yield on different irrigation strategies were not available for this experiment because the water supply was terminated due to the cold weather condition.
3. IoT based irrigation system for open field tomato production
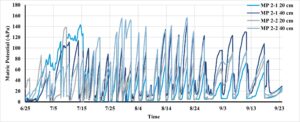
The soil moisture sensors data were recorded through June to later September. When the sensor readings reached the setting thresholds, irrigation was applied. The change of sensor readings throughout the season reflected the irrigation events and rainfalls (Figure 18). 2019 was a dry year, we had applied water to the test field with high frequency.
Figure 18. Soil water potential readings throughout the growing season for the treatment 2
Throughout the harvest window, five harvests were conducted for sampled plants. 10 plants were sampled in each replicates for each treatment, so there were 40 plants selected for harvesting in each treatment. Then crop yield was projected to Mg per hectare based on the density of crop planted. The fruits were categorized into different quality levels. Table 2 shows the detail results of crop production under different treatments.
Table 2. Crop production under different irrigation treatments
| Treatments | Crop yield (Mg ha-1) - Projected from the sampled harvested tomatoes | |||||
| XL | L | M | Cull | TMY | TY | |
| T1 | 46.35 bc | 4.52 b | 3.34 a | 25.73 ab | 54.21 bc | 79.95 a |
| T2 | 52.71 ab | 6.46 a | 3.26 a | 23.66 b | 62.43 ab | 86.09 a |
| T3 | 38.16 c | 5.43 ab | 3.75 a | 27.49 a | 47.34 c | 74.83 a |
| T4 | 56.72 a | 5.95 a | 3.52 a | 20.00 c | 66.19 a | 86.20 a |
| P-value | 0.01 | 0.04 | 0.66 | 0.002 | 0.01 | 0.06 |
XL: Extra Large, L: Large, M: Medium, TMY: Total Marketable yield, TY: Total yield. Treatments sharing the same letter is in the same group.
4. Investigation of optimal sensor installation locations in drip irrigation for fruit orchards
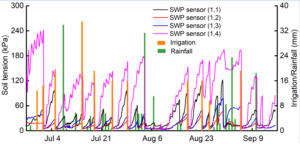
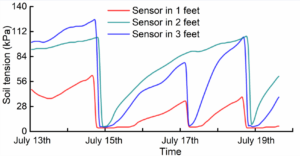
Figure 19 shows the soil tension measured by one column of SWP sensors under irrigation and rainfall. In total of 14 irrigation events were scheduled during June 26th to September 16th. It is clear that the soil tension decreased rapidly then remained stable for several days until next irrigation, which meant the water applied by drip irrigation established a favorable soil moisture condition.
Figure 19. Soil water potential from one column of the sensors throughout the season
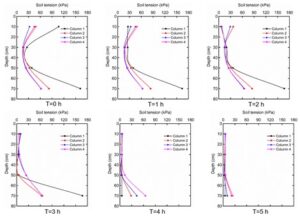
Figure 20 shows the soil moisture profile after an irrigation event. In the start of irrigation (t=0), the value of SWP sensors were different, which means the distribution of soil moisture in profile are inhomogeneous after last irrigation. The soil both in bottom and top was drier than the soil in the middle according to the value of SWP sensors. The SWP value in the middle soil showed the similar soil moisture level. The soil in the bottom has the largest soil tension, which result from water loss from deep percolation. After irrigation, the soil moisture level at all locations were gradually increasing (the readings of soil water potentials getting smaller).
Figure 20. The soil moisture change over the time in an irrigation event from start to 5 hours later
5. Study for the automated irrigation in peach orchard
Figure 21 shows three irrigation events we applied to the peach orchard in 2020. Currently, the irrigation was applied remotely through the IoT platform to turn on/off the solenoid valve. In the future, with the defined threshold, the irrigation can be applied automatically by the IoT platform.
Figure 21. The sensor readings for three irrigation events in a peach orchard (season 2020)
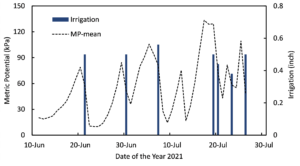
In 2021, the IoT based automatic irrigation system was tested again in a peach orchard. Figure 22 shows the daily average of soil moisture and the irrigation events applied during this period. Normally, four hours of irrigation is sufficient to bring the soil moisture to a sufficient level. While, if we wait too long to irrigate, which means the soil is drier than the set threshold, then four hours is not enough. For example, on July 19th, the average metric potential was over 130 kPa, we had two irrigations at two consequent days (around 4 hours each day) to bring the numbers down. There were also a few rainfall events during the period, which helped reducing irrigation schedules (for example, July 10th to July 18th).
Figure 22. Daily average soil moisture (metric potential) and the irrigation events during the period of June 11th to July 27th in 2021
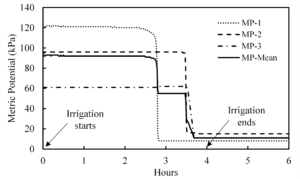
Figure 23 shows an example of an irrigation event. The initial readings for the three sensors were 122, 96, and 61 kPa, which was averaged at 93 kPa. After 4 hours of irrigation, all the readings were brought down to around 10 kPa. This indicates that the water got down to the 3 ft depth, and the monitored root zone got sufficient water. Since the top portion of the soil was pretty dry, it took about 2.5 hours to get response from the first sensor (1 ft depth), followed by the changes of the second and third sensors. Also, we can see that the metric potential changed rapidly when it started to change during an irrigation event.
Figure 23. The soil moisture change (metric potential) at different depths in a four-hour irrigation event
In overall, the developed IoT irrigation system worked functionally during the test period. The soil moisture levels were monitored at different soil depths with the average readings to be used for the irrigation. The irrigation events were applied remotely when the soil was dry. This study provided a guidance on developing a fully automatic irrigation system.
The research for this project focused on: 1) compare different irrigation strategies, 2) compare various soil moisture sensors, 3) develop an automatic irrigation with LoRaWAN technology. Among different irrigation strategies, soil moisture based irrigation is a direct measurement and easy implementation method. Soil moisture based irrigation showed effective results with water saving and crop yield increasing, especially for vegetable crops. Soil moisture sensors normally include water content sensors and water potential sensors, which measure different parameters but both can be used for indicating soil moisture. Soil moisture sensors from Meter Group and Watermark sensor were tested in our experiments, and both were effective for irrigation purpose. An internet of things (IoT) irrigation system was developed with LoRaWAN technology, and it was tested in both peach orchard and vegetable fields. The results showed that using this automatic irrigation system, growers can access the soil moisture data remotely and the irrigation valve can be turned on/off automatically or remotely based on the real-time soil moisture condition and the thresholds for start and stop irrigation.
Education
The primary goal of educational program in this project was to achieve the adoption of the practices identified from the research outcomes by tree fruit and vegetable producers in Pennsylvania. The main approaches to achieve the goal include: 1) cultivate interest among producers through field visits, presentations, workshops, and publications; 2) demonstrate the selection, installation, configuration, and monitoring capability of sensor technologies and automated irrigation systems; and 3) assist growers in implementing precision sensing and irrigation system on their farms.
Educational activities in 2019:
In 2019, the major educational activities: need survey to growers on precision irrigation; in-service training of extension educators on precision irrigation; on-farm trials at commercial orchards (four commercial tree fruit growers in four apple orchards); extension fact sheets and other materials; presentations at academic, professional, and grower meetings. The detail on individual educational activities are in the milestone report.
Educational activities in 2020:
In 2020, the major educational activities: a webinar series (three webinars and a panel discussion) were organized by PIs through Penn State Extension on the topics of automated irrigation and application for PA growers; survey to growers on the status and need of irrigation systems in their farms; on-farm trials at commercial fruit orchards and vegetable fields (four commercial tree fruit growers in four apple orchards and one pear orchard, and one vegetable growers in high tunnel tomato field); presentations at academic, professional, and grower meetings; publications and extension articles. The detail on individual educational activities are in the milestone report.
Educational activities in 2021:
In 2021, we continued our commercial farm trials with the five growers we worked with in the 2020, and also increased another two new collaborators (one tree fruit grower, and one greenhouse vegetable grower). With the new tree fruit grower collaborator, we have trials in a peach orchard and an apple orchard. We also presented our research outcomes in 2021 Mid-Atlantic Fruit and Vegetable Convention: Tree Fruit Session and Vegetable Session and New York State Tree Fruit Conference as invited talk. An extension article was published in Penn State Extension website. Meanwhile, we have presented our research outcomes in professional meetings such as ASABE meeting and ASHS conference. Conference proceeding paper and journal papers have been published to disseminate the project outcomes.
Educational activities in 2022:
In 2022, we continued our commercial farm trials with the growers we worked with in the previous years, and also increased another two new collaborators. One grower installed 12 watermark soil moisture sensors in one peach orchard and three vegetable fields, the other grower installed one set of sensors (four Meter group sensors and datalogger) in an apple orchard, and three watermark sensors in a peach orchard, and three watermark sensors in a cherry orchard, and two watermark sensors in a blueberry field. We also presented our research outcomes in 2022 Penn State Fruit Research and Extension Grower Field Day and 2022 International Fruit Tree Association Tour. Especially, a demonstration of installation, setting, and operation of irrigation sensors for tree orchards was conducted at five different Counties through Penn State Extension Spring Orchard Meetings. In total, we attracted more than 200 growers in these meetings to observe and discuss the sensor based irrigation system. One conference proceeding paper and one journal paper have been published to disseminate the project outcomes in year 2022.
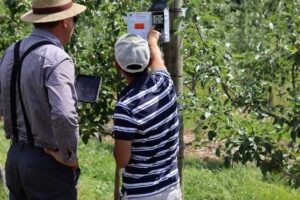
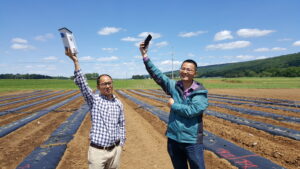
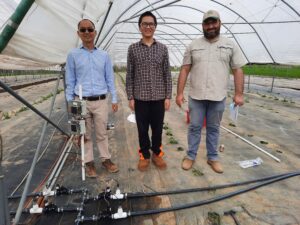
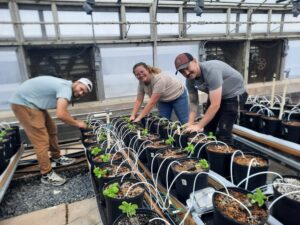
Here are some pictures taken from our educational activities:
Milestones
1. Six growers agree to host irrigation research/demonstration plots on their farms.
6
9
May 31, 2019
Completed
October 30, 2020
In 2019, four tree fruit growers have participated in the project. The sensor systems were installed in their farms in early June. One set of soil moisture sensors (three soil water content sensors and one soil water potential sensor) and datalogger system were installed in an orchard from each participant, including Hollabaugh Bros. Inc. and Mt. Ridge Farm on June 4th, and El Vista Orchards, and Twin Springs Farms on June 12th. The real time soil moisture data can be recorded and monitored. The sensors are working normally, and the data could be accessed with Zentra Cloud using internet. The instruction of how to install the sensor and access the data by the growers are provided. Suggestions have been provided to individuals for their irrigation scheduling during the season. We are preparing a season report to the participating growers now. In the report, the data results will be illustrated, and further discussion and suggestion will be provide to them.
Soil moisture sensor and datalogger installation in an orchard
In 2020, we have conducted our field trials in six different farms, include four apple orchards, one pear orchards, and one high tunnel tomato field. For the four apple orchards, we just continued the same activities as year 2019, including monitoring the soil moisture level, assisting irrigation scheduling with the growers based on the sensor data. We have added one more sensor set in a pear orchard at Hollabaugh Brothers farm (the sensor set was installed in July). Also, we conducted a field trial at a commercial high tunnel tomato field - ReDivined farm (young lead growers), and the growers monitored the soil moisture throughout the growing season for their irrigation decision based on the sensing set we installed.
In 2021, we continued to work with the farms we have been working with in 2020, and also increased another two collaborators to have our trails in another three farms (one greenhouse vegetable farm, a peach orchard, and an apple orchard).
In 2022, we continued to work with five tree fruit growers, and also increased another two collaborator growers to have our trials in seven different farms (one apple orchard, two peach orchards, one cherry orchard, one cucumber field, one pumpkin field, and one blueberry field).
2. 50 farmers attend on-farm workshop(s) and report learning about sensor data collection, device installation and operation.
50
250
20
August 31, 2022
Completed
October 30, 2020
2019 Workshops and on-farm training:
Four commercial orchards has been selected for on-farm training using the sensor based irrigation technology. On each farm, orchard operation manager and other related workers have joined the sensor installation process, and instruction has provided to them for operation the system, and recording and understanding the sensor data. In overall, four individuals has participated this process with individual training. The number of farmer participants in 2019 is much less than the proposed number, which can be attributed to the fact that 2019 is the first year of the project, and we mainly focused on obtaining some preliminary results from commercial orchards, as well as some fresh experience from representative growers.
Besides the farmers, a in-service demonstration has been taken place for the extension educators (20 educators and agricultural service company individuals attended). These educators can deliver the information, obtain the need and answer questions from commercial growers in the future.
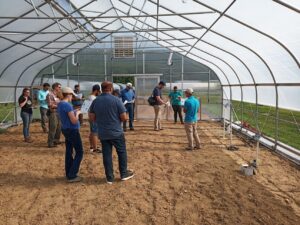
Besides the first four growers we worked with in the year 2019, we also worked with another five fruit and vegetable growers in between 2020-2022. The growers from these farms were involved and trained with sensor installation, data accessing and monitoring, and irrigation scheduling.
3. 200 growers respond to a survey of irrigation practices and water usage.
200
237
December 31, 2019
Completed
January 30, 2020
2019 Survey:
A survey was carried out at different events in 2019 through Penn State Extension. The importance of 'Monitoring plant and soil water with precision agriculture' is among them. In this survey, 64 individuals responded to this question, and mainly indicated moderate importance of adopting precision plant and soil water monitoring.
2020 Survey:
In 2020, a grower survey was conducted after the Mid-Atlantic Fruit and Vegetable Convention, where a few presentations (as class-based workshop) were given to the growers. In total 265 growers participated the survey, and 164 of them answered the questions related to the automated irrigation system. Two major survey results are shown below. One grower may have answered with multiple items.
The major obstacles that affect growers to adopt the automated irrigation
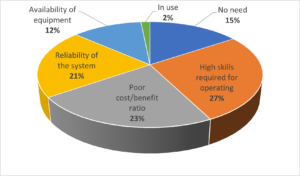
From the results, we can see that large percentage of the growers concerned about the operation of automated irrigation system (27% concerned on the required high skills from sensor installation, to data interpreting, and system control; 21% of them concerned on the reliability of the system, including reliability of the sensor readings and control system). About 23% of growers concerned about the cost of the automated irrigation system, and thought it would not be economically feasibly to adopt it. About 15% of the growers thought they are not interested in the automated irrigation due to either no need for irrigation at all or just prefer to irrigate with experience. In the returned surveys, three growers reported that they are using automated irrigation. They are using timer-based automated irrigation instead of soil moisture sensors.
The preference of extension outreach methods for growers to receive information on irrigation technologies
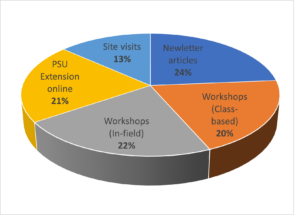
The classroom-based workshops refer to trainings, presentations, and webinars. The in-field workshops typically refer to on-site sensor installation instruction and automated irrigation system operation training. The newsletter articles include extension articles in PA fruit news, Good Fruit Growers, and so on. Penn State Extension online materials include online courses, online fact sheet, and 'LearnNow' tutorial videos. The site visits mainly refer to addressing some concurrent questions during spring or summer orchard meetings. One grower may have voted for more than one methods in the survey. In the survey results, we can find that the proposed five methods were weighted very similarly except the 'site visit' was slightly less. We have been working with growers with all the methods in the past.
4. 50 growers attend a seminar and report learning new information about how to optimize irrigation.
50
100
February 29, 2020
Completed
May 20, 2020
In 2020, a series of webinars were organized by the project PIs through Penn State Extension for fruit and vegetable growers, covering the fundamentals of drip irrigation systems, automated irrigation, and opportunities for growers to implement the irrigation technologies. Growers participated these webinars through Zoom, and there were 60 - 100 grower participants in these webinars. Questions and discussions were well addressed through these webinars. The three webinars are:
- The Basic of Drip Irrigation and its Application to Vegetable and Fruit Crops (Speaker: Dr. Troy Peters)
- Vinduino Irrigation Automation and its Use in Grape, Vegetable, and Fruit Production (Speaker: Mr. Reinier Van De Lee)
- The Successes and Challenges of Sensor-Based Irrigation for Crops in Pennsylvania (Speakers and panelists: Drs. Long He, Francesco Di Gioia, and Nick Flax).
We also have presented our research outcomes in the project to more than 200 growers during Mid-Atlantic Fruit and Vegetable Convention, winter fruit school program, and spring orchard meetings.
5. 50 farmers receive individualized support to adopt precision irrigation technologies through phone calls and site visits.
50
15
August 31, 2020
Completed
November 30, 2022
We had worked with five tree fruit growers, and two vegetable growers on the on-farm trial with precision irrigation system. Meanwhile, we received questions by emails and phone calls about precision irrigation or regular drip irrigation from individual growers and extension educators (about five times). Of course, we answered questions to the growers on the irrigation related issues during of all our workshops and presentations.
6. 100 farmers that completed workshops and/or workbooks complete a survey describing their plans to make changes to their irrigation systems and any adopt precision irrigation technology before the end of the project.
100
150
February 28, 2021
Completed
May 03, 2022
In our workshops (Penn State Spring Orchard Meetings), we have reached out to more than 150 growers. There were many interest in the sensor based irrigation, even though we only worked with 9 growers at the end to install sensors on their farms.
7. 100 farmers access at least one of four on-line video tutorials in support of completing their farm irrigation workbooks.
100
150
October 31, 2021
Completed
January 31, 2023
We have worked on putting the materials together to make two tutorial video, one video is about the introduction of soil moisture sensors (sensors from Meter Group), installation, and data access for guiding precision irrigation, and the other one is with watermark sensors, including sensor installation, data measurement, and automatic irrigation system. Then the videos are posted at Penn State Extension, and our lab website, YouTube Channel as well.
8. 6 farmers that hosted on-farm research/demonstration plots complete a detailed survey to gauge their satisfaction with the technology. Specific topics to be addressed include operational cost and efficiency, total water savings, observed reductions in labor, satisfaction with crop quality and yield, and overall profitability.
6
8
December 31, 2021
Completed
December 31, 2021
We have been working with 9 growers for sensor-based irrigation technologies, including seven tree fruit growers, one vegetable grower, and one mixed fruit and vegetable grower. We have obtained positive feedback from them for using the soil moisture sensor for guiding the irrigation. While, it is very difficult to request them to send a formal report since there is no comparative study in their farm to calculate the improvement of water use efficiency and crop yield.
9. 100 farmers attend one of four Extension workshops, where they complete a workbook guiding them through automated irrigation design and operations.
100
150
February 28, 2022
Completed
November 30, 2022
We organized a series of on-site workshop during 2022 Penn State Extension Spring Orchard Meetings to explain the sensors and systems are used for orchard irrigation. The irrigation workshops during our Spring Orchard Meetings have attracted more than 150 growers to attend at different locations of Pennsylvania. They gained knowledge of sensor selection, sensor installation and data access, system operation and maintenance on sensor-based irrigation system. We also had a few classroom-based workshops/presentations on the sensor-based irrigation systems, which has been included in our products.
Milestone activities and participation summary
Educational activities:
Participation summary:
Learning Outcomes
We have brought the concept of using soil moisture sensors to guide irrigation for fruit and vegetable growers in Pennsylvania and beyond. Growers who attended our presentations, workshops, and demonstrations learned the type of sensors used for irrigation, the installation and data access of these sensors, as well as the guideline information for sensor-based irrigation strategy for different crops and fields.
Performance Target Outcomes
Target #1
40
adopt precision irrigation methods
of the 40, 10 will experience the benefits
increase crop yield with water savings, for example 20% of yield increasing.
9
adopted precision irrigation methods
50 acres
Based on growers feedback, they had better understanding of crop water needs, and applied water with less frequency based on their experience (there is no quantified data to show how much water actually reduced and how much yield increased since no comparison was made). Based on our research results, we found that precision irrigation with soil moisture sensors can save around 20-30% of water usage while increase 5-20% of yield by comparing to conventional method.
In 2020, four tree fruit growers firstly installed four sets of sensors in their orchards (apple orchards), another two sets of sensors in two vegetable grower fields. In 2021, we added one set of sensors in a 2020 grower's peach orchard, installed two sets of sensors in a new grower's peach and apple orchards, and installed four sets of sensors in a high tunnel vegetable grower's tomato and pepper fields (automatic irrigation system). In 2022, we installed four sets of sensor in a new grower's four different fruit and vegetable fields, and four sets in another grower's two peach orchards and two vegetable fields. In overall, there are nine growers actually adopted the sensor based irrigation system, in total about 50 acres of farms. Due to the small size of each farm for the precision irrigation test, the total amount of production acreage is relatively small. Growers reported their irrigation events to us and indicated that sensor system helped them to make decision for when and how much to irrigation. We could not compare the water saving and yield increasing in these farms since there was no side by side farms without using the sensor system. Based on our research results, we found that precision irrigation with soil moisture sensors can save around 20-30% of water usage while increase 5-20% of yield by comparing to conventional method. During our extension events, there were strong interests from many growers on the sensor based precision irrigation, we believe in the future, there will be many more growers who have plan to adopt precision irrigation technology on their farms.
Additional Project Outcomes
Information Products
- Investigation of Sensor-Based Irrigation Systems for Apple Orchards
- Sensor-Based Irrigation Strategies and Wireless Network Systems for Automated Irrigation
- Internet of Things (IoT)-Based Precision Irrigation System for Specialty Crops
- Monitoring Soil Moisture Level for Precision Irrigation in Apple Orchards
- Investigation of Sensor-Based Irrigation Systems for Apple Orchards
- Internet of Things (IoT)-based Precision Irrigation with LoRaWAN Technology Applied to High Tunnel Vegetable Production
- Investigation of Soil Wetting Pattern in Drip Irrigation using LoraWAN Technology
- IoT-based Precision Irrigation with LoRaWAN Technology Applied to Vegetable Production
- Design of Automatic Soil Moisture-Based Irrigation System in Orchard using LoraWANTechnology
- Applying Sensor-Based Irrigation for Tree Fruit Orchards
- Investigation of Soil Wetting Pattern in Drip Irrigation using LoRaWANTechnology
- Precision Irrigation Technologies for Specialty Crops
- Sensor-Based Irrigation System for Apple Orchards and Vegetable Fields
- Updates on Precision Agriculture Program- Intelligent Spraying and Sensor-Based Irrigation
- Sensing, Data, and Robotics in Specialty Crop Production
- Tomato Irrigation Systems
- Internet of Things (IoT)-based Precision Irrigation with LoRaWAN Technology Applied to High Tunnel Vegetable Production
- Developing Sensor-Based Irrigation Systems for Sustainable Vegetable Crops
- Internet of Things (IoT)-based Precision Irrigation with LoRaWAN Technology Applied to Vegetable Production
- Internet of Things (IoT) Sensor‐Based Precision Irrigation and Decision Support Systems for the Optimal Management of Irrigation and Fertigation in Fresh‐Market Tomato
- Application of Sensor‐based Automated Irrigation and a Decision Support System for the Fertigation Management of Fresh‐Market Tomato in Pennsylvania
- Precision Irrigation Systems for Tree Fruit Orchards-2020 Season Updates
- Developing Sensor-Based Smart Irrigation Systems for Vegetable Crops
- Internet of Things (IoT) for Precision Irrigation Management in Tree Fruit Orchards
- Internet of Things (IoT)-Based Precision Irrigation With LoRaWAN Technology Applied to Vegetable Production
- Investigation of Effective Irrigation Strategies for High-Density Apple Orchards in Pennsylvania
- Introduction of Automatic Irrigation Systems for Tree Fruit Orchards
