Final Report for LS08-209
Project Information
Results indicate that cool-season forage mixtures containing oats were superior to rye plus ryegrass for supporting beef cattle production from winter grazing. Summer annuals supported satisfactory ADG of finishing cattle early in the summer grazing phase, but were unable to sustain satisfactory ADG for the remainder of the season because of rapidly advancing maturity. Processing treatment showed a significant effect on the ability of panelists to detect grassy off-flavors. Curing a product significantly decreased the capacity of panelists to detect grassy flavors. Additionally, aging a control roast for 28 d substantially increased the presence of grass flavors compared to 0 d roasts according to panelists.
Objective 1) Improve cattle producer's knowledge of the product quality traits, management and marketing of forage-fed beef. We will utilize university-owned cattle already identified to run through a mock system to evaluate the growth, carcass, meat quality, and nutritional value of grass-fed beef from different production scenarios.
Objective 2) Develop a processing and marketing system to support the production of forage-fed beef products. Partnerships already established will be used to foster support of grass-fed beef products to potential markets and utilizing the consumer, processing plant, and marketing data we have already collected, devise a business plan for producing grass-fed beef. Local cattle producer Randall Hastings, the Alabama Department of Agriculture, and the Baldwin County School system have already begun partnerships to produce and market grass-fed beef.
Objective 3) Develop partnerships between cattle producers and small, local beef processors. The Alabama Cattlemen's Association will assist the researchers in providing public service announcements, outreach publications, and fact papers through distribution channels already established through their monthly magazine.
Objective 4) Provide farmer and cattle background information to consumers and collect consumers' feedback. By using the Auburn University Lambert-Powell Meat Lab, we will be able to collect all carcass, meat quality, and nutritional value data and provide that information to the producers of the cattle.
The purpose of this project is to demonstrate advantages and disadvantages and therefore the feasibility of small cattle farmers to produce, harvest, process, market, and sell their cattle in local markets utilizing a forage-finished production system.
With the increase in the price of fuel and feed grains, recent projections have shown that finishing local cattle on forage would be more profitable than transporting them to the Midwest to be finished in feedlots. With 50% of mature beef cows located in the southeastern U.S. (Little, 1985), a significant opportunity is presenting itself to small cattle farmers in the Southeast. This opportunity is tempered by the fact that very few beef processing plants exist in the state of Alabama or in the southeastern United States. In a survey done in 2005, Prevatt et al. reported that processing plants that harvest beef only slaughter an average of 3 days a week and all plants reporting slaughter 15 head or less per day. Of all processing plants that reported, they also indicated that, on average, they only operate at about 69% of their capacity leaving a promising amount of capacity to add grass-fed beef to their operation.
Production of grass-fed beef
Past research has found a number of problems associated with the use of forage in comparison to concentrate as the primary feed source when finishing cattle. Lower ADG, longer finishing period to reach target endpoint, lower dressing percentage, less acceptable lean and fat scores, and lower quality grade has been found for forage-finished cattle (Bidner et al., 1981, 1986). Researchers have found palatability issues, primarily related to flavor, when comparing animals finished on all forage diet with those finished on a high concentrate diet (Melton, 1990; Bowling et al., 1977, 1978).
Greinbenow et al. (1997) point out that there is conflicting research related to most of the problems associated with forage-finished beef, and Muir et al. (1998) concluded that the feeding system has little or no effect on palatability traits and carcass traits when cattle are finished to similar carcass weight or same degree of fatness. This suggests there may be methods of producing forage-finished beef that results in acceptable consumer satisfaction, animal performance, and/or carcass characteristics.
With the recent publication of the federal regulation on labeling of “Grass-fed” and absolutely no supplementation of grain more information is needed on the impact of feeding stockpiled forage. This includes the use of baled hay and legumes as well as other high-quality forages as defined by the USDA. The effect of these supplements on the quality of meat may be extremely important to the ability to market the product. For instance, if the level of carotenoids is elevated in one type of legume (like alfalfa), the color and texture of the lean and(or) fat may make the product unsuitable for market.
Nutritional and quality traits of grass-fed beef
Numerous live and postmortem factors can affect the quality, color, and dietetic quality of beef, and finishing diet composition is one of the most important live production factors (O'Sullivan et al. 2003; Gatellier et al., 2005). Beef from forage-based finishing systems has been found to possess a higher amount of polyunsaturated fatty acids (PUFA) more specifically n-3 PUFA, compared with concentrate finished beef and the targeted ratio of n-6/n-3 PUFA is commonly attainted in forage finished beef (Enser et al., 1998). Appropriate n-6/n-3 PUFA ratios (below 4) and increased CLA intake have been shown to exhibit human disease prevention properties (Gatellier et al., 2005; Simopoulous, 1991).
Lipids from forage-finished beef contain high levels of PUFA which are more prone to being attacked by free radicals. The oxidation of lipids in meat is one of the most significant aspects of loss in flavor quality and the formation of rancid and lean discolored characteristics. Smith et al. (1996) concluded the quality and color deterioration is mainly due to oxidation of lipid and muscle pigments. The bright, cherry-red color of fresh beef is used by consumers as an indicator of meat quality and wholesomeness (Cassens et al., 1988) and any deviation from this may create a degree of unacceptability (Kropf, 1980). However our own data suggests that the higher levels of vitamin E found in grass-fed beef helps sustain the bright cherry-red color longer than grass-fed beef. Modern product marination and packaging technologies should be investigated to determine their effectiveness in retarding the fatty acid rancidity often found in grass-fed beef.
Consumer interest in grass-fed beef
Consumer interest in the benefits of forage-finished beef has shown that a portion of the population demands this type of product enough to warrant further development of the production system. Additionally, environmental concerns, food safety recalls, health concerns and a changing domestic demographic have encouraged beef producers to look for alternative methods of production that may keep the industry viable.
Several negative meat quality attributes have been observed in forage-finished beef that may decrease the price point for forage-finished beef. Forage-finished beef has often been noted to have a “grassy” or “gamey” flavor, or characterized as having an “off-flavor” (Davis et al., 1981; Bowling et al., 1977; Hedrick et al., 1983). In addition, forage-finished beef is often thought to be tougher, contrary to existing research (Montgomery et al., 1982; Abdullah et al., 1979; and Mills et al., 1992). Furthermore, the color of beef steaks from forage-finished animals tends to be darker (Strachan et al., 1993; Bennett et al., 1995; and Cranwell et al., 1996) and the fat has a more yellow color than grain-finished beef (French et al., 2000; Seideman et al., 1982; and McMillin et al., 1982).
Umberger et al. (2002) reported that about 20% of consumers surveyed preferred Argentine forage-fed beef to traditional American grain-fed beef. However, Cox et al. (2006) reported that as many as one-third of consumers surveyed in supermarkets preferred the tasted of grass-fed beef. Furthermore, when consumers took the same steaks home and prepared them how they liked, 50% of the consumers preferred the taste of grass-fed beef. So more than sufficient evidence exists that a significant market exists for American grass-fed beef.
Cooperators
Research
Research site
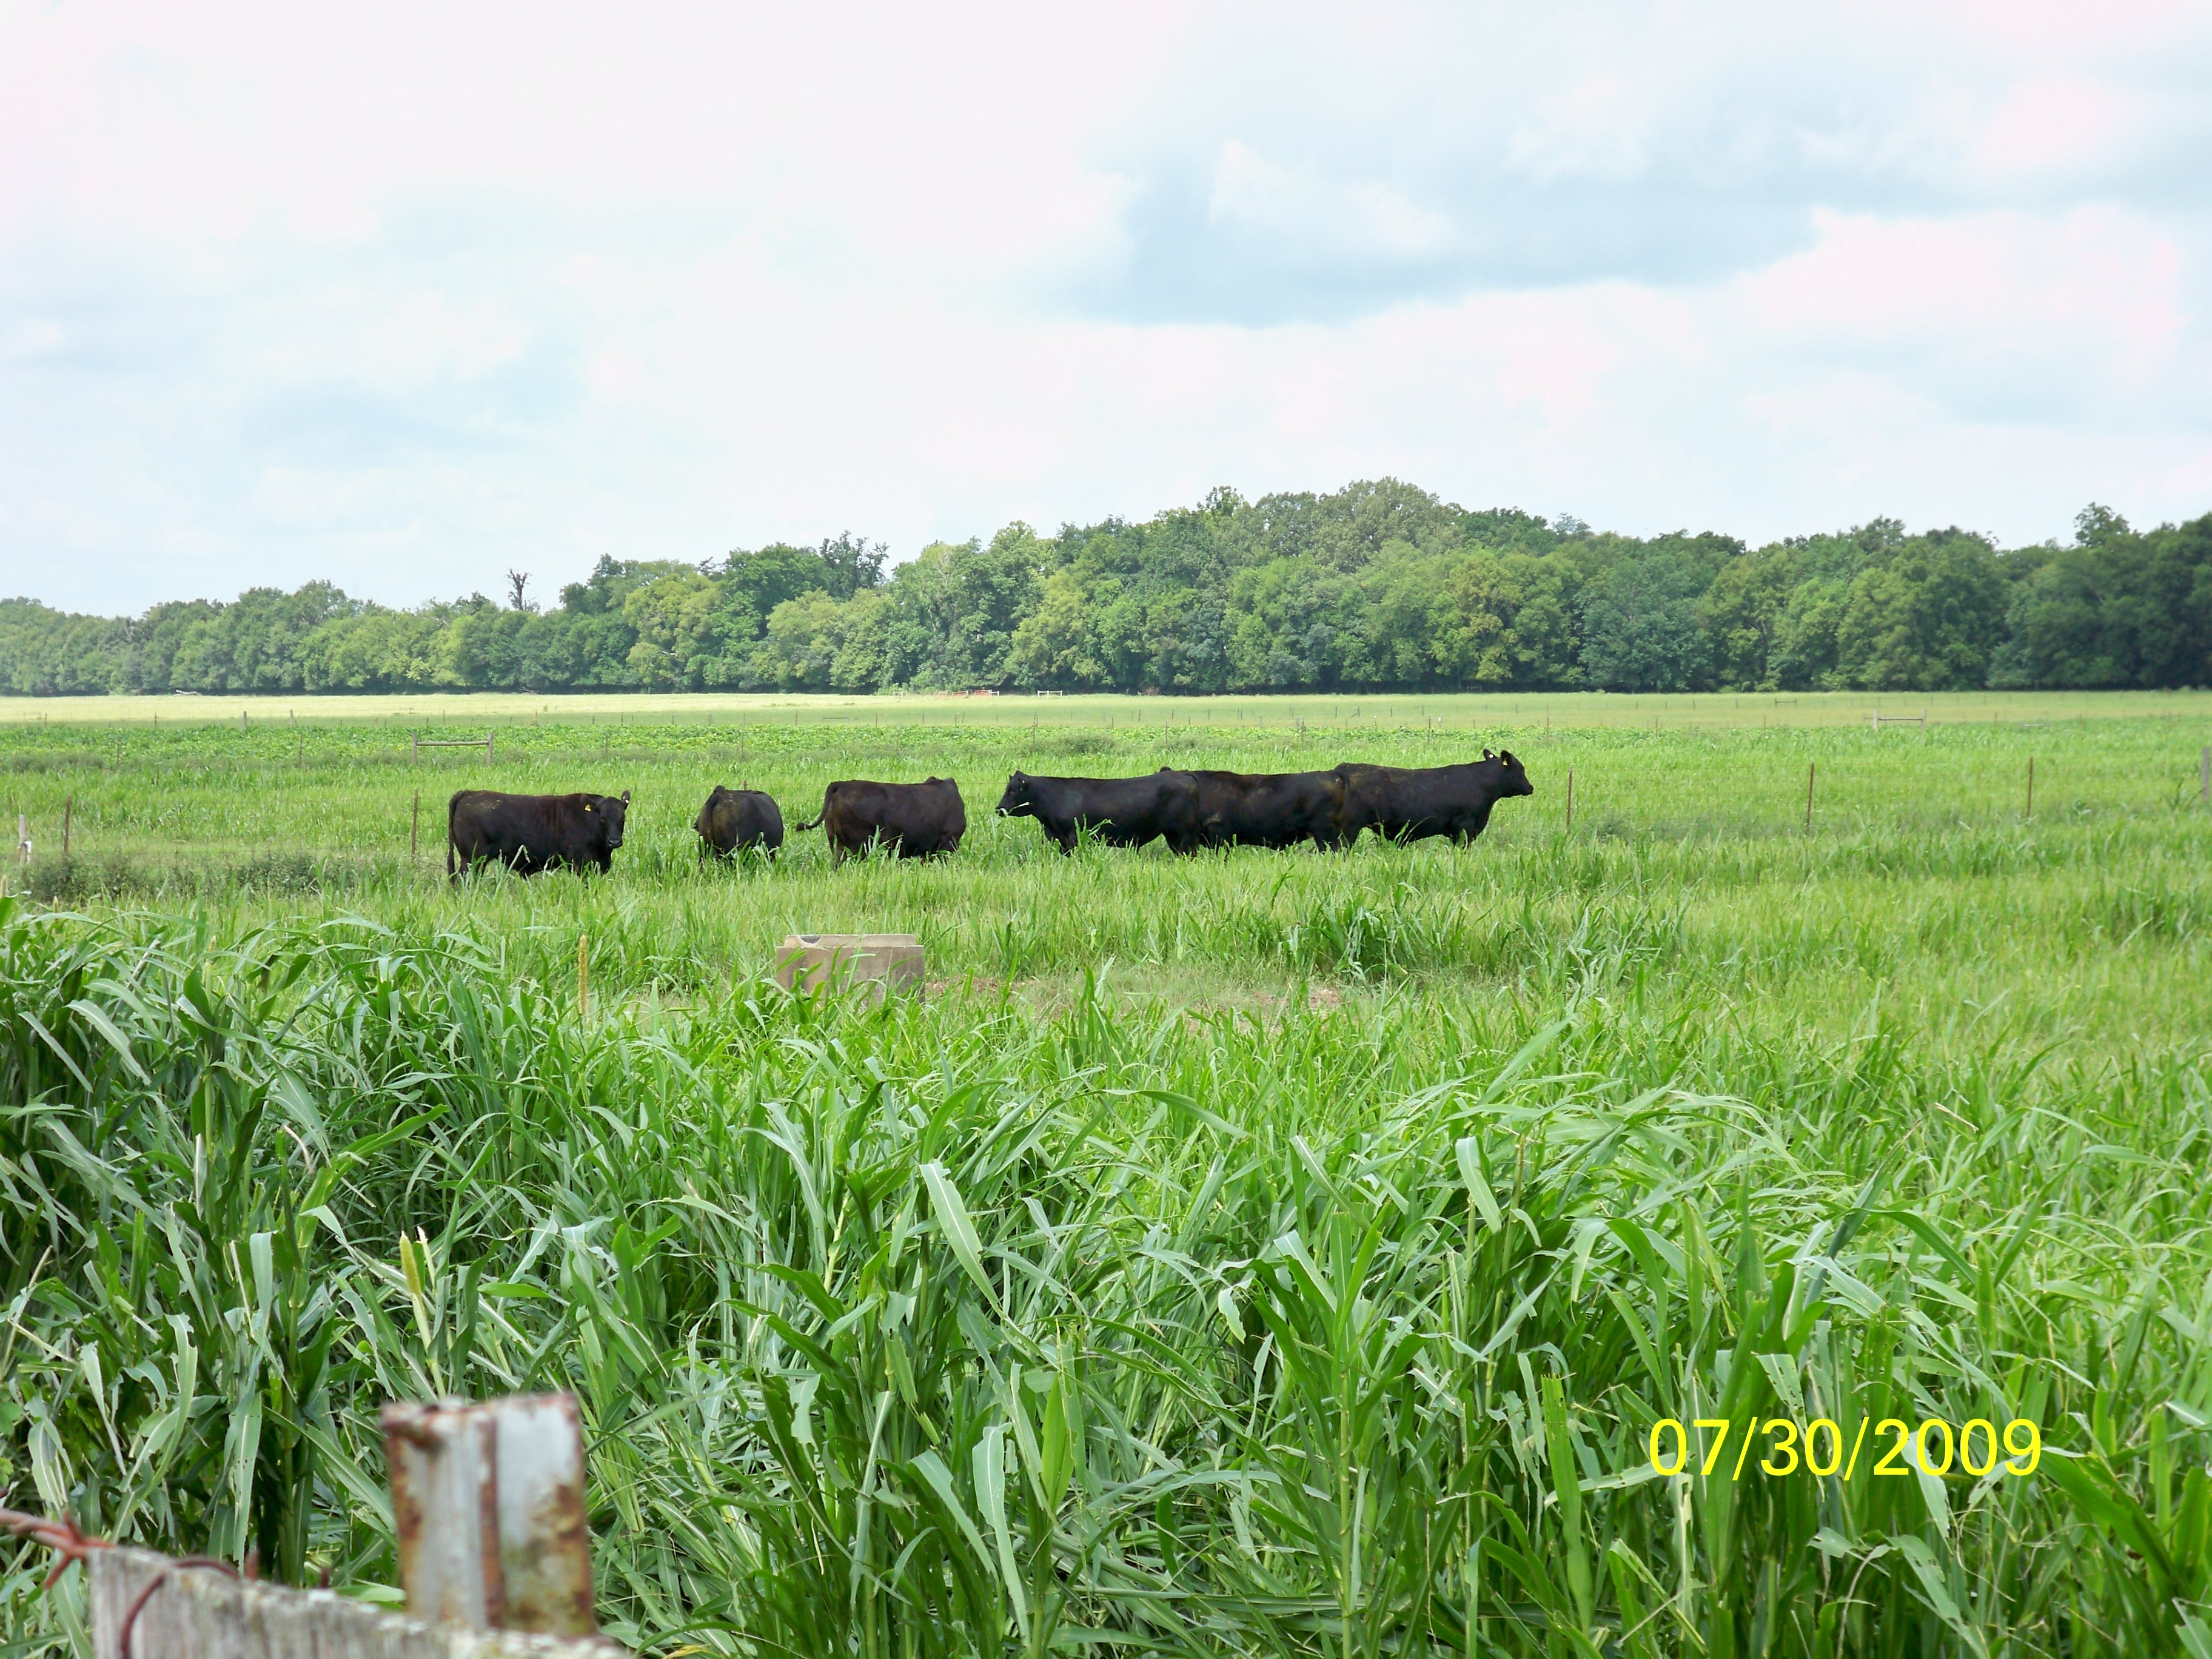
A winter-grazing trial was conducted at the Wiregrass Research and Extension Center in Headland, AL (31.35° lat, 85.34° long). Mean annual precipitation is 114 to 140 cm, and mean annual temperature is 16 to 19 C°. Six paddocks (1.42-ha each) consisting of a Dothan fine sandy loam were demarcated for the experiment. Oats (Avena sativa) and rye (Secale cereale) were established with ryegrass (Lolium perenne) in either binary or ternary mixtures as winter pasture for grazing beef cattle (Figure 1). Pastures had previously been in a winter-annual grazing/summer row-crop rotation and were planted in annual peanut (Arachis hypogea) during the late spring until harvest in early fall. Paddocks were tilled on November 4, and forage seed was drilled into the prepared seedbeds on November 5, 2008. Seeding rates were 103 kg/ha of Wren?s Abruzzi rye or Harrison oats and 11 kg/ha Marshall ryegrass for binary mixtures, and 52 kg/ha of both rye and oats and 11 kg/ha ryegrass for the ternary mixture. Plots initially received 45 kg N/ha, 67 kg P/ha and 67 kg K/ha as NH4NO3, P2O5 and K2O , respectively, on Nov 4, 2008 according to soil test recommendations of the Auburn University Soil Testing Laboratory. 31 Nitrogen fertilizer in the form of NH4NO3 and sulfur fertilizer in the form of (NH4)2SO4 were applied on Dec 19, 2008 and Mar 5, 2009 at a rate of 67 kg N/ha and 11 kg S/ha, respectively.
Treatments
Replicate 1.42-ha pastures of mixtures of oats and ryegrass, rye and ryegrass, and oats and rye and ryegrass were established and initially stocked with 3 yearling Angus × Simmental steers per paddock (initial BW 392 ± 31 kg). Steers were born in the fall of 2007, and were placed on a bermudagrass (Cynodon dactylon) pasture after weaning until the beginning of the trial. When forage became limiting during the late fall prior to the experiment, steers were given free access to bermudagrass hay. Steers were treated with Cydectin pour-on dewormer at the beginning of the grazing trial. All steers had free-choice access to salt-mineral mix and water.
Grazing was initiated on January 8, 2009 when forage DM availability had achieved approximately 2,000 kg/ha. Animals were weighed at the end of successive intervals of 28, 28, 32, 29 and 23 d, and grazing was terminated after 140 d on May 28, 2009. Stocking rates were adjusted using put-and-take steers to maintain forages in a vegetative state, and grazing was discontinued when forage availability and quality could no longer support satisfactory animal performance. The study was conducted according to a protocol approved by the Institutional Animal Care and Use Committee of Auburn University.
Forage management, sampling and laboratory analyses
Forages were continuously grazed and aggressively managed throughout the study to maintain a target forage DM availability of 2,000 kg DM/ha. Stocking rate adjustments were made based on calculation of forage availability and animal utilization at the time of sampling (Appendix A). Net change in available forage DM (less trampling, lodging and consumption) was determined for each paddock every 2 wk as the difference in aboveground forage mass between the previous sampling date and the current sampling date. Animal utilization since the 33 previous sampling date was estimated using an assumed DMI of 3% of mean BW. The difference in available forage mass between sampling periods was then added to the amount consumed by cattle within a paddock to derive an estimate of forage DM accumulation during the most recent 2-wk period. Forage accumulation was then added to available forage DM at the time of sampling to determine a projected amount of available forage DM during the next 2-wk period. Amount of projected available forage over 2,000 kg DM/ha was regarded as that requiring management using put-and-take steers. Cattle were predicted to utilize 60% of the total amount of projected available forage growth over 2,000 kg DM/ha to account for waste and trampling. Stocking rate adjustments were determined based on amount of predicted consumption by cattle within a paddock over a 2-wk period.
Forage mass and nutritive quality were determined by clipping 0.25-m2 quadrats (8 per paddock) prior to the beginning of grazing and every 2 wk during the trial. Forage within quadrats was clipped to leave an aboveground stubble height of approximately 2 cm. Fresh-cut forage was then placed into plastic, zip-closure storage bags and stored on ice for transportation back to the Auburn University Ruminant Nutrition Laboratory. Samples from each paddock were placed in a tared paper bag, oven-dried at 60°C for 72 hr, air-equilibrated and weighed. DM availability was calculated for each paddock based on dry-weight data multiplied by the area of the paddock.
Dried, air-equilibrated forage samples were ground in a Wiley mill to pass a 1-mm screen. Concentration of DM was determined by drying samples to constant weight at 100°C according to procedures of AOAC (1995). Concentrations of NDF, ADF and ADL were determined according to the procedures of Van Soest et al. (1991). Forage concentration of N was determined according to the Kjeldhal procedure (AOAC, 1995), and CP was calculated as N 34 × 6.25. Samples were prepared for total non-structural carbohydrate (TNC) analysis according to a modification of the Weinmann (1947) procedure for fructosan accumulators. Samples weighing 0.20 to 0.25 g were boiled in 0.05 N H2SO4 for 1 h, placed in a shallow ice bath, and 1.0 N NaOH (2.5 to 3.9 mL) was added to adjust the pH of the sample to 4.5. One mL of diluted amyloglucosidase (Aspergillus niger, Lot No. A 9913, Sigma-Aldrich, Inc., St. Louis, MO) solution was added to samples, which were then covered and incubated at 60°C for 1 hr. Samples were filtered and brought to volume in a 250-mL volumetric flask with 2 mL of 0.1 N NaOH and deionized H2O. Ten mL of Sheffer-Somogyi reagent (AOAC, 1995) were combined with a 10-mL aliquot of sample in a 25 × 200 mm capped test tube and boiled for 15 min. Test tubes were then cooled in an ice bath and 2 mL of potassium iodide-potassium oxalate solution were added to each sample. Next, 10 mL of 1.0 N H2SO4 and 1 mL of gelatinized starch solution were added to each tube prior to titration. Samples were titrated with 0.02 N sodium thiosulfate until the solution turned sky blue. Concentration of TNC in samples was calculated as the amount of reducing sugar in the sample, multiplied by the dilution factor × 100, divided by the sample weight.
Forage in vitro dry matter digestibility (IVDMD) was determined according to the Van Soest (1991) modification of the Tilley and Terry procedure (1963) using the DaisyII incubator system (Ankom TechnologyTM). Ruminal fluid was collected from a fistulated, dry Holstein cow at the Auburn University College of Veterinary Medicine. The cow was fed a corn silage-based diet containing cottonseed meal and MegalacTM supplement, and given free access to bermudagrass pasture and alfalfa (Medicago sativa) hay. Fluid was stored in pre-warmed thermos containers to maintain a temperature supportive of the microbial population and 35 transported to the Auburn University Ruminant Nutrition laboratory where it was then prepared for the batch-culture IVDMD procedure.
Research site
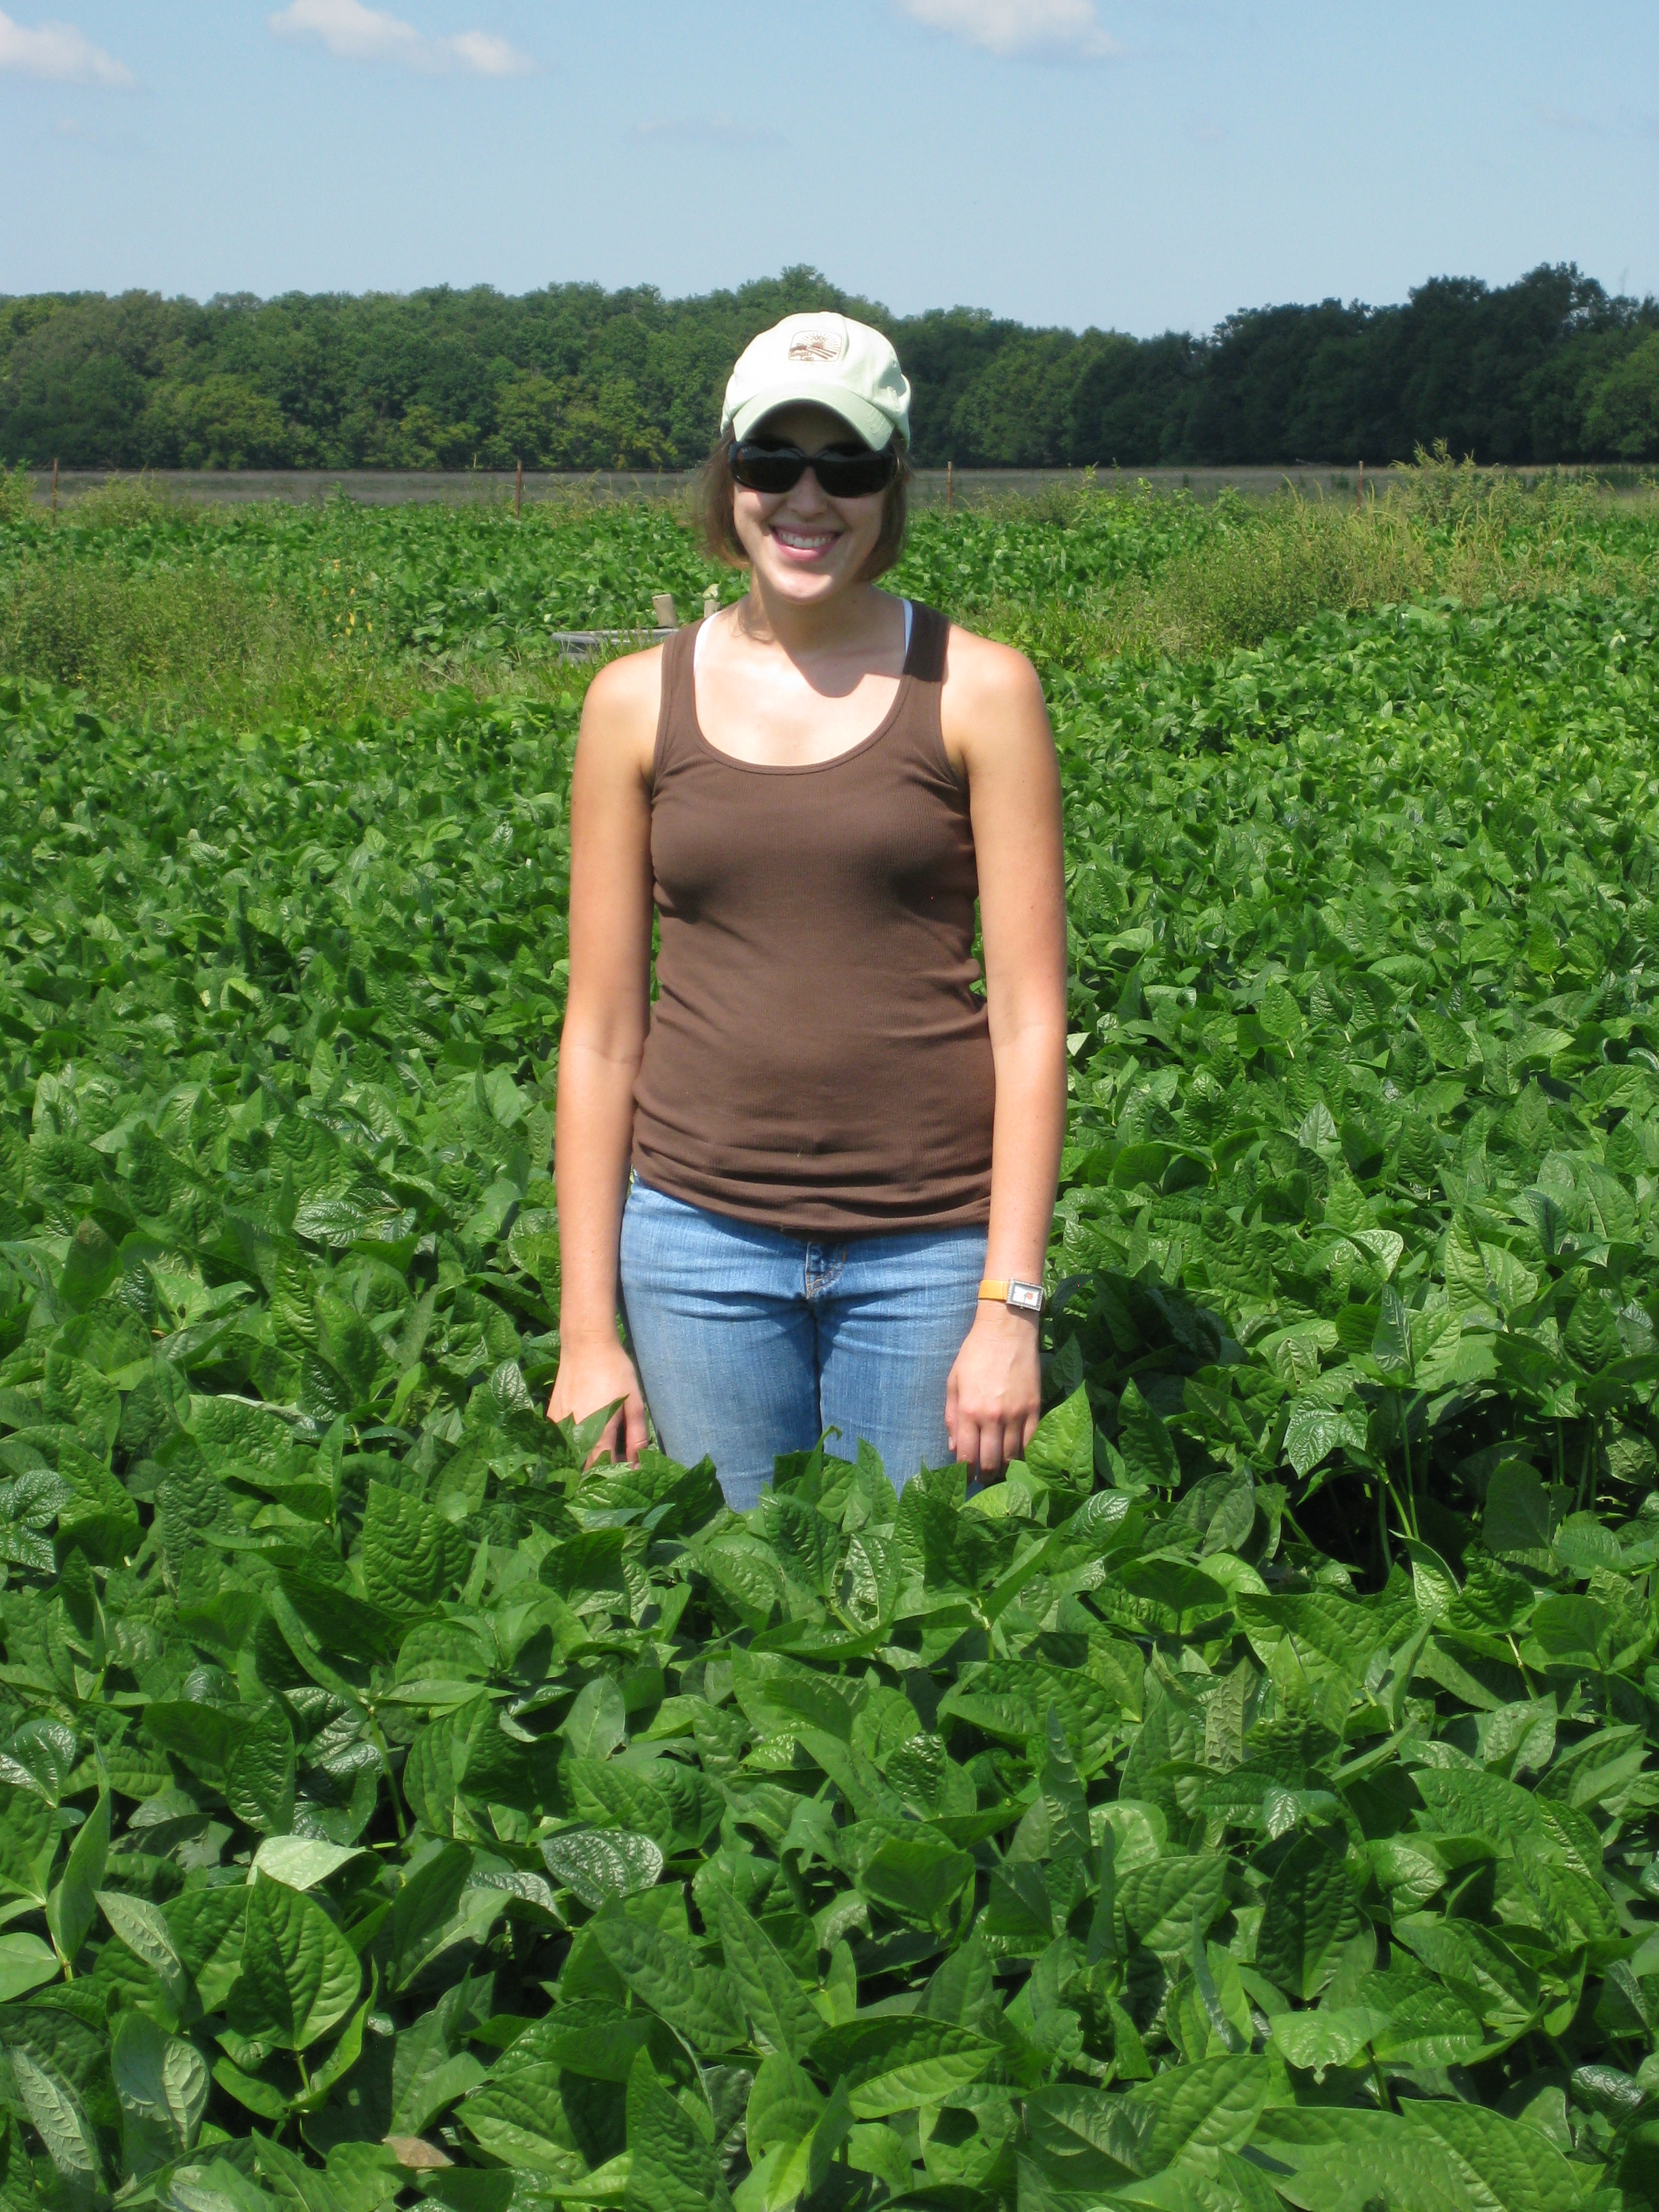
A summer grazing trial was conducted at the E.V. Smith Research Center in Shorter, AL (32o 26' lat, 85o 53' long). Mean annual precipitation is 127 cm, and mean annual temperature is 18° C. Six paddocks (2.02-ha each) consisting of a Riverview silt loam and a Toccoa fine sandy loam were demarcated for the experiment. Cowpea (Vigna unguiculata), pearl millet (Pennisetum glaucum) and lablab (Lablab purpureus) were established as summer pasture for a beef cattle forage-finishing system. Pastures had previously been planted in annual ryegrass 55 (Lolium perenne) for grazing beef cattle. Paddocks were tilled on June 3, and cowpea and pearl millet were planted in prepared seedbeds on June 4, 2009. Lablab planting date was delayed due to excessive rainfall and was planted in prepared seedbeds on June 11, 2009. Legumes were inoculated prior to planting in order to promote root nodulation and N-fixation. Seeding rates were 57 kg/ha for Iron-Clay cowpea, 45 kg/ha for Rio Verde lablab and 23 kg/ha for Tifleaf 3 pearl millet. Pearl millet plots initially received 67 kg/ha of N fertilizer in the form of NH4NO3 at the time of planting and again in mid-August based on Alabama Cooperative Extension fertilization recommendations.
Treatments
Following establishment, replicate 2.02-ha pastures of cowpea, pearl millet, and lablab were stocked with 6 yearling Angus × Simmental steers per paddock (initial BW 531 ± 94 kg). Steers were born in the fall of 2007 and used previously in the cool-season annual growing phase of this experiment. After the completion of the winter grazing trial, steers were transported from the Wiregrass Research and Extension Center in Headland, AL to the E. V. Smith Research Center in Shorter, AL for the finishing phase of the experiment. Steers were placed on a tall fescue-bermudagrass mixed pasture until the initiation of the summer-annuals grazing trial.
Grazing was initiated on July 14 for cowpea and pearl millet, and on July 21, 2009 for lablab when forage dry matter (DM) availability had achieved approximately 2,000 kg DM/ha. Animals were weighed every 28 d, and grazing was terminated on September 29, 2009 when forage availability and quality could no longer support satisfactory animal performance. The study was conducted according to a protocol approved by the Institutional Animal Care and Use Committee of Auburn University.
Forage management, sampling, and laboratory analyses
Paddocks within forage treatments were rotationally grazed every 2 wk followed by 2 wk of rest to allow adequate regrowth throughout the study and to maintain a forage DM availability of at least 2,000 kg DM/ha. In order to keep forage in a vegetative state and maintain nutritive quality, pearl millet pastures were clipped once in mid-August to prevent forage maturation from occurring too rapidly.
Forage mass and nutritive quality were determined by clipping 0.25-m2 quadrats (12 per paddock) prior to the beginning of grazing and once a month during the trial. Forage within quadrats was clipped to leave an aboveground stubble height of approximately 2 cm. Fresh-cut forage was then placed into plastic, zip-closure storage bags and stored on ice for transportation back to the Auburn University Ruminant Nutrition Laboratory. Samples from each paddock were placed in a tared paper bag, oven-dried at 60°C for 72 hr, air-equilibrated and weighed. Forage DM availability was calculated for each paddock based on dry-weight data multiplied by the area of the paddock.
Dried, air-equilibrated forage samples were ground in a Wiley mill to pass a 1-mm screen. Concentration of DM was determined by drying samples to constant weight at 100°C according to the procedures of AOAC (1995). Concentrations of NDF, ADF and ADL were determined according to the procedures of Van Soest et al. (1991). Forage concentration of N was determined according to the Kjeldhal procedure (AOAC, 1995), and CP was calculated as N × 6.25. Forage in vitro dry matter digestibility (IVDMD) was determined according to the Van Soest (1991) modification of the Tilley and Terry procedure (1963) using the DaisyII incubator system (Ankom TechnologyTM). Ruminal fluid was collected from a fistulated, lactating Holstein cow at the Auburn University College of Veterinary Medicine. The cow was fed a corn silage-based diet containing cottonseed meal and MegalacTM supplement and had free access to bermudagrass pasture and alfalfa (Medicago sativa) hay. Ruminal fluid was placed into pre-warmed thermos containers to maintain a temperature supportive of the microbial population, and then transported to the Auburn University Ruminant Nutrition laboratory where it was further processed for the batch-culture fermentation procedure.
Beef inside round roasts (n = 144) were cut from rounds obtained from both forage-finished cattle (n = 72) and grain-finished cattle (n = 72). Forage-fed cattle were finished on a combination of ryegrass and oats. Roasts were portioned to weigh approximately 0.45-0.68 kg. Each roast was then randomly assigned one of the following treatments: control, pumped-no cure and pumped-cured. Additionally, roasts were assigned a serving temperature (hot and cold) and aging treatments (0- and 28-d post cooking).
Separate brines were mixed for each lot (n = 3) and two roasts per treatment, serving temperature, and aging period combination were pumped. Prior to treatment, each roast was weighed in order to obtain an exact green weight. Control roasts were passed through a multi-needle injector (model PI 9-52 Pickle Injector; Gunther Maschinenbau GmbH, Dieburg, Germany) three times with no brine injected in order to maintain a consistent treatment for all products. Roasts that were pumped were injected to approximately 30% of green weight with the appropriate brine solution (Table 1).
After roasts were pumped, each sample was reweighed and pumped weights were recorded. Next, each lot of roasts were tagged and placed into small-batch vacuum tumblers (model Ideal (LU25) Vacuum Tumbler; Lumar Ideal II Inc., Montreal, QC Canada) for 30 minutes with like treatments. After tumbling, roasts were vacuum packaged in cook-in bags (model CNR 530; Cryovac Food Packaging Systems, Greenville, SC) and cooked in a smokehouse (model Grand Prize™ 3 Smokehouse; KOCH, Kansas City, MO) on a steam cycle (Appendix A). After roasts were cooked to an internal temperature of 65°C, they were placed into a chill cooler and cooled to 2°C. The 0-d roasts were immediately frozen at -20°C after cooling while 28-d roasts remained in the cooler another 4 wk and were then frozen at -20°C until evaluation.
Color Evaluation
Commission International de l’Eclairage (CIE) lean L* (muscle lightness), a* (muscle redness) and b* (muscle yellowness) values were evaluated using a Hunter Miniscan XE Plus (model MSXP-4500C; Hunter Laboratories, Reston, VA). Illuminant setting D65 at 10° and a 3.5-cm aperture were utilized. Roasts were randomly selected and thawed for 24 h at 3 ± 1°C prior to color measurement. Color scores were taken immediately before sensory evaluation. Samples served warm had color scores taken after heating. Two readings each were taken from the external surface and the internal, sliced surface area. Each set of measurements were then averaged to obtain a representative measure of color for both the external and internal area of the sample. Hue angle (wavelength of light radiation of red, yellow, green, blue and purple) was calculated by using an equation as described by Hunt (1980) and Clydesdale (1991).
Sensory Evaluation
Prior to sensory evaluation, panelists conducted round-table evaluations on test roasts in order to establish flavor profiles. After potential off-flavors were identified, various compounds were used in order to train panelists on these specific flavors. Roasts were randomly selected and thawed for 24 h at 3 ± 1°C. Prior to serving, roasts that were to be served hot were heated for 6 minutes in their bags on HIGH using a microwave (model MW8999RD; Emerson Radio Corporation, Parsippany, NJ); cold samples were sliced immediately after thawing. The roasts were then sliced to approximately 0.4 cm in thickness on a 130 watt meat slicer with a 19 cm circular blade (model FS03; LEM Products, Harrison, OH). Hot roasts were wrapped in aluminum foil and placed into warming ovens at approximately 65°C until served to panelists. Cold roasts were wrapped in aluminum foil and stored in the refrigerator until served.
Panelists were seated in individual, partitioned booths with 250 Lx of red incandescent light. Prior to each session, a warm-up sample was served, scored and discussed. Next, panelists were served three to six samples at each sensory session. Each panelist was given two samples from each roast. Samples were evaluated for beefy, salty, warmed-over, soy, sweet, grassy and other off flavors including livery, bloody, sour, metallic, nutty and weedy. Additionally, panelists were asked to score overall tenderness, texture and juiciness.
Panelists were asked to mark their score on an anchored line with the left side representing extremely bland flavor, extremely tough, extremely cohesive and extremely dry, and the right side representing intense flavor, extremely tender, extremely mealy and extremely juicy respectively (Appendix C). Panelists were instructed to expectorate the sample and cleanse their palate by taking a bite of an un-salted saltine cracker and drinking water after each sample was evaluated, and scores recorded. After sensory preparation, remaining portions of each sample were vacuum packaged, immediately refrozen and stored at -20°C for both shear-force and lipid oxidation analysis.
Shear Evaluation
Tenderness was evaluated by using the Warner-Bratzler shear force method according to AMSA (1995) guidelines. Frozen roasts were removed from the freezer and allowed to thaw for 24 h at 3 ± 1°C. All roasts were sampled immediately after thawing. No samples were reheated prior to evaluation. Roasts were removed from the vacuum package and cored. Six cores, 1.3 cm in diameter, were taken from each sample parallel to the muscle fiber. Each core was then individually sheared across the middle using a Dynamometer Scale (model 1955; G. R. Electric Manufacturing, Manhattan, KS). The peak forces from the six cores were averaged for statistical analysis purposes.
Lipid Oxidation Evaluation
Lipid oxidation was assessed using a thiobarbituric acid (TBA) reactive substance assay as modified from Wang and others
Temperature and precipitation
Monthly mean air temperatures were slightly higher than 30-yr averages for Headland, AL (Table 1). For January and February, monthly total precipitation (Table 2) was 69 and 60% lower, respectively, than the 30-yr average. Precipitation was 16, 50 and 118% greater than the 30-yr average in March, April and May, respectively.
Dry matter availability
Differences were observed in DM availability among forage treatments within each period of the experiment. From Jan 8 to Feb 5, R-RG had 494 and 437 kg DM/ha greater available forage DM than O-RG (P = 0.0456) and O-R-RG (P = 0.0242), respectively. The opposite pattern was observed in the second period, in which R-RG had lower DM availability than O-RG (P = 0.0421) and O-R-RG (P = 0.0098). However, beginning in the third period, mixed pastures containing rye had decreased DM availability compared with O-RG. Differences among treatments were most evident in the fourth period, in which O-RG had 129% and 157% greater available DM than O-R-RG (P = 0.0001) and R-RG (P = 0.0001), respectively. In the final period, DM availability decreased dramatically for all forage mixtures, although O-RG available DM was still 78% and 134% greater, respectively, than that in the O-R-RG (P = 0.0012) and R-RG (P = 0.0001) mixed-pasture systems.
Average daily gain
Cattle ADG from Apr 6 to May 5 (Table 4) was lower for R-RG than the O-RG (P = 0.0075) and O-R-RG (P = 0.0275) treatments. No differences were observed in ADG among treatments from Jan 8 to Feb 5 (P = 0.3902), Feb 5 to Mar 5 (P = 0.7444), Mar 5 to Apr 6 (P = 0.1495) or May 5 to May 28 (P = 0.2943). Average daily gain over the 140-d grazing period was greater for O-RG than R-RG (P = 0.03), but was not different from that of O-R-RG (P = 0.16).
Grazing days
No differences were observed among treatments for steer-grazing-days over the 140-d grazing trial (Table 5). From Apr 6 to May 5, steer-grazing-days were greater for O-RG than R-RG (P = 0.0290) and O-R-RG (P = 0.0391) treatments. No differences among treatments were observed in the other periods.
Crude protein
Forage concentration of CP (Table 6) was lower for O-RG than O-R-RG (P = 0.0658) and R-RG (P = 0.0308) from Feb 5 to Mar 5. From Mar 5 to Apr 6, CP concentration was lower for O-R-RG than the O-RG (P =0.0513) and R-RG (P = 0.0067) treatments, but not different (P = 0.2399) between O-RG and R-RG. No differences were observed among treatments in forage concentration of CP in any other periods throughout the grazing trial.
Cell wall constituents
No differences were observed among treatments in forage NDF concentration (Table 7) from Jan 8 to Feb 5 (P = 0.4848), Apr 6 to May 5 (P = 0.7402) and May 5 to May 28 (P = 0.5359). However, O-RG forage had lower NDF concentration than O-R-RG (P = 0.0654) and R-RG (P = 0.0009) treatments, respectively, and O-R-RG contained less NDF (P = 0.0229) than R-RG from Feb 5 to Mar 5. Concentration of NDF was also lower for O-RG forage than O-R-RG (P = 0.0037) and R-RG (P = 0.0081) treatments from Mar 5 to Apr 6. Forage concentration of ADF (Table 8) followed a similar pattern. From Feb 5 to Mar 5, O-RG contained less ADF than O-R-RG (P = 0.0231) and R-RG (P = 0.0014), and O-R-RG contained less (P = 0.1065) ADF than R-RG. From Mar 5 to Apr 6, O-RG forage had 3.3 and 2.3 percentage units lower ADF concentration than O-R-RG (P = 0.0253) and R-RG (P = 0.0932) treatments, respectively. During the first period of the experiment, concentration of ADL (Table 9) was higher for R-RG
than O-RG (P = 0.0251) and O-R-RG (P = 0.0321) treatments. No differences were observed among treatments in forage concentration of ADL throughout the remainder of the trial.
Non-structural carbohydrates
Concentration of total non-structural carbohydrates (Table 10) from Feb 5 to Mar 5 was greater for O-RG than O-R-RG (P = 0.0040) and R-RG (P = 0.0003) forages, and O-R-RG was greater (P = 0.0784) than R-RG. Concentration of TNC in all treatments decreased from Mar 5 to Apr 6, with R-RG containing lower TNC concentration than both O-RG (P = 0.0001) and O-R-RG (P = 0.0213), and O-RG containing greater (P = 0.0008) TNC concentration than O-R-RG in the third period. No differences among treatments were observed in concentration of TNC from Jan 8 to Feb 5, Apr 6 to May 5, and May 5 to May 28.
In vitro dry matter digestibility
Percentage IVDMD (Table 11) was not different between O-RG and O-R-RG (P = 0.7211), but was greater for O-RG (P = 0.0825) and O-R-RG (P = 0.0.0389) than R-RG from Jan 8 to Feb 5. Digestibility of O-RG was greater than that of O-R-RG (P = 0.0235) and R-RG (P = 0.0011) treatments, and digestibility of O-R-RG and R-RG were not different (P = 0.1912) within the second period. Mixed pastures of O-RG had greater digestibility than R-RG (P = 0.0445) and O-R-RG (P = 0.0009), and R-RG had greater (P = 0.1004) digestibility than O-R-RG from Mar 5 to Apr 6. No differences were observed among forage treatments for digestibility in all other periods during the experiment.
Discussion
Except for April, mean temperatures between January and May exceeded 30-yr averages for Headland, AL but were still within the optimum temperature range for growth of small grains and ryegrass (USDA, 2009b,e,g). Average precipitation during January and February was considerably below 30-yr averages, but was adequate to support satisfactory forage growth during the experiment (USDA, 2009b,e,g). Beginning in March, average precipitation was considerably greater than the 30-yr average, which may have impacted overall forage productivity. Beck et al. (2005) reported that climatic conditions may have a large impact on the growth of winter annual grasses, and may affect individual species differently. In January, initial DM availability of forage mixtures was greatest for R-RG, with an average of 2,604 kg DM/ha. Bruckner and Raymer (1990) reported that seasonal distribution of small-grain forages was most evident in January and February when rye produced greater forage yields than triticale, oats and wheat. Moreover, because rye is more cold-tolerant than the other common small-grain species, it is often available and ready for grazing earlier in the growing season (Ball et al., 2007). Although mean temperature was similar in January and February, visual frost damage was evident in pastures containing oats during mid-January. Because oats is more cold-sensitive than rye, low temperatures may have temporarily stunted oats production until consistently higher daily temperatures were achieved. Yield distribution favored the production of oats during the second 28-d period when DM availability of O-RG and O-R-RG were greater than R-RG. Differences in seasonal growth distribution of the small grains was evident during this period, with slightly increasing productivity of oats observed following that of rye (Ball et al., 2007). Forage DM availability in mixtures containing rye steadily decreased throughout the remainder of the experiment under intensive management conditions. Vendramini et al. (2006) observed
similar results with rotationally grazed R-RG pastures in which herbage mass decreased from 2,100 to 1,600 kg DM/ha from February to April in the second yr of a 2-yr grazing trial. However, forage availability in O-RG mixed pasture continued to exceed 2,000 kg DM/ha until the final period. Differences in forage DM availability were most apparent during the fourth period when DM availability of O-RG was twice that of pastures containing rye. Yield was most likely highest during this time due to oats reaching maximum productivity and maturity, along with peak productivity of ryegrass. Redfearn et al. (2005) noted that the greatest forage production of ryegrass occurs from March onward, although yield is dependent on variety selection. Although Jennings (2005) reported that oats may be slightly lower yielding than the other small-grain species, when planted in a mixture with ryegrass, O-RG proved to be the most productive forage mixture in the present study.
Average daily gain differed among forage treatments during the fourth period of the trial and across the entire grazing season in which mixtures containing oats were superior to R-RG for supporting animal gain. In the present study, increased ADG observed for mixtures containing oats contrasts with values reported by Beck et al. (2005). Results from a 3-yr grazing trial in Arkansas revealed that spring ADG of stocker calves on R-RG was 19% greater than that of cattle grazing oats, rye, wheat + rye, and wheat + rye + ryegrass (Beck et al., 2005). However, when small-grain/ryegrass mixtures were interseeded into bermudagrass sod, Beck et al. (2007) reported ADG from O-RG was intermediate to that of other mixed-pasture systems and not different among treatments during yr 1 of the grazing trial. In yr 2, no significant differences were observed among treatments in spring ADG of mixed pastures, and ADG for cattle grazing O-RG pasture was 1.33 kg/d, which compares favorably with values observed for O-RG pasture in the present study. Cattle ADG from O-R-RG was slightly higher than that (0.98 kg/d) observed by Myer et al. (2008) in a grazing trial in Florida. Although R-RG pasture produced the lowest ADG in the present study, these results agree with those from a study reported by Cleere et al. (2004) in which steers grazing a combination of R-RG gained between 1.01 and 1.28 kg/d from December to May across two stocking rates and grazing systems in Overton, TX.
The number of steer-grazing-days for each pasture treatment is a meaningful indicator of its animal carrying capacity and productivity. Animal carrying capacity is defined as the maximum stocking rate that will achieve a target level of animal performance and forage utilization from a specified grazing method (i.e., intensive grazing management), that can be applied over a defined time period without deterioration of the ecosystem (Forage and Grazing Terminology Committee, 1991). Therefore, as the amount of forage DM availability in a pasture increases, the potential exists to increase the stocking rate, subsequently increasing the number of steer-grazing-days per pasture. Number of steer-grazing-days was greatest for O-RG during the fourth period due to increased forage DM availability, and capacity to support increased stocking rate as indicated by increased necessity for forage management using put-and-take steers. Across the entire grazing season, forage treatments containing oats had 625 steer-grazing-days. Comparable results were observed for O-RG overseeded into bermudagrass sod for which Beck et al. (2007) observed 595 grazing-days/ha (yr 1) and 697 grazing-days/ha (yr 2) over a 2-yr grazing trial in Arkansas. Myer et al. (2008) observed slightly fewer grazing-days/ha for O-R-RG (421 d/ha) and O-RG (403 d/ha) in a grazing trial in Florida.
Concentration of CP is an important measure of forage quality. While annual forage grasses may be lower yielding and less responsive to applied nutrients, they generally have greater nutrient concentrations than perennial grasses (Robinson, 1996). Concentration of CP was greatest for all treatments ( ? 21%) during the first 28 d of the trial, which is expected for cool-season annual forages in the vegetative state. An increase in CP was observed between the second and third period, which may be attributed in part to application of NH4NO3 fertilizer at the beginning of March. Forage concentration of CP decreased from roughly 22 to 12% across the entire grazing season. Redfearn et al. (2002) observed a similar pattern for concentration of CP in ryegrass from December to May (26 to 12%) in Oklahoma. Ball et al. (2007) reported a decline in concentration of CP in rye of 28, 24 and 13% at the vegetative, flower/boot and fruit/head stages of maturity, respectively. Moreover, forage quality of small grains declined with the onset of maturity at the May harvest date in Ohio forage variety trials (Samples and Sulc, 2000). Concentration of CP varied considerably within treatments after the first harvest, illustrating changes in forage quality with increasing plant maturity.
Total cell-wall constituents (i.e., fiber) are key determinants of forage DMI and digestibility. Forage concentration of NDF, which consists of hemicellulose, cellulose and lignin, is inversely related to voluntary forage DMI in ruminants, whereas concentration of ADF, which consists of cellulose and lignin, is inversely related to forage DM digestibility (Van Soest, 1994). During the second period, mixed pastures containing oats contained less NDF than R-RG pastures. Concentration of NDF during the third period was lower for O-RG than the other treatments, which may be partially attributed to the seasonality of the forage mixture. The combination of increased productivity from oats and peaking productivity of the ryegrass component may have provided a greater flush of vegetative plant growth of higher quality than in pastures containing rye. Spring productivity of ryegrass was illustrated over a 2-yr trial at four locations in Oklahoma (Redfearn et al., 2002) in which 40% of the total forage production of different ryegrass cultivars occurred early in the growing season (December through February), and 60% occurred as late-season growth (March through May) . Across the entire grazing season, forage NDF concentration ranged from 37 to 69% for all treatments. These results are consistent with those of Redfearn et al. (2002), who reported that concentration of NDF in ryegrass increased (39 to 58%) across the growing season. Moreover, Juskiw et al. (2000) observed NDF concentration of >50% for barley, oats and triticale in the dough stage of development prior to harvest.
Concentration of ADF decreased between the first and second period, with mixtures containing oats having less ADF than R-RG. The observed decrease in ADF contrasts with the increasing pattern of NDF observed during the same time period. In the third period, O-RG contained less ADF than forage treatments containing rye. Mean concentration of ADF increased within each forage treatment throughout the remainder of the experiment, which is expected with advancing plant maturity. Juskiw et al. (2000) reported 32% ADF for oats in the dough stage of development, and similar values for other small grains. Concentration of ADF in the final period was slightly higher than those reported by Juskiw et al. (2000), which may reflect that forages were slightly more mature than dough stage of development.
Lignin is a polyphenolic compound that confers rigidity to plant cell walls and provides resistance to biodegradation (Van Soest, 1994). Lignin evolved as part of the defense system that plants use to protect themselves against herbivory, and it is considered the most significant factor limiting the availability of plant cell wall material for digestion by herbivores (Van Soest, 1994). Concentration of ADL was lowest during the first period during which forages in all treatments contained less than 1% lignin. Lignin concentration increased with increasing plant maturity as expected, although ADL never exceeded 3.2% throughout the grazing trial. Observed concentrations of ADL for forage species in the present study are relatively low, but are comparable to values reported by Muir and Bow (2009) for cool-season annual forages grown under nutrient-rich conditions. During the first year of the trial, mean concentration of ADL was less than 3% for barley, oats, triticale, rye and ryegrass from September to April in Stephenville, TX (Muir and Bow, 2009). Mean concentration of ADL was greater than 5% for the small grains and ryegrass in yr 2 and yr 3 because of increased yield compared with yr 1, as well as varying environmental conditions.
Carbohydrates are the most abundant class of compounds found in plants, accounting for 50 to 80% of the dry biomass of forage species, and may be structural or non-structural in nature (Moore and Hatfield, 1994). The majority of non-structural carbohydrates are rapidly and completely degraded within the rumen, while degradability of structural carbohydrates varies considerably (Nocek and Tamminga, 1991). Simple sugars and polysaccharides are degraded and rapidly fermented to VFA in the rumen, and can represent a substantial portion of the digestible energy obtained by ruminants consuming forages (Moore and Hatfield, 1994). Concentration of TNC was greater for O-RG than O-R-RG and R-RG forages in the second period of the grazing trial. Van Soest (1994) reported cool-season grasses contain 30 to 60 g/kg DM soluble sugars, 0 to 20 g/kg DM starch and 30 to100 g/kg DM fructans, which additively is comparable to the total concentration of TNC observed in the present study for pastures containing oats. Chatterton et al. (1989) reported higher values for cool-season forages grown at 10°/5°C (light/dark) compared with 25°/15° C. Cool-season forages grown at 10°/5°C contained 312 mg/kg TNC, which is comparable with growing conditions in the present study. Forage concentrations of TNC decreased between the second and third period; however, concentration of TNC in O-RG was still greater than that of mixtures containing rye. Concentration of TNC in forages is highly variable and is dependent upon planting date, diurnal variation, environmental conditions and stage of maturity. Concentration of TNC in two cultivars of perennial ryegrass averaged 19% over four different growth stages in Pennsylvania (Jung et al., 1976). Chatterton et al. (2006) noted that sugar concentration was generally highest when oat forage plants were young (tiller and joint growth stages) and concentration of fiber was relatively low. Glucose, fructose and sucrose averaged 15% of DM in hay in the boot stage, and declined to 1 to 2% of DM with increasing plant maturity. Starch was present in low concentrations in vegetative plants (3 to 4%) and increased with plant maturity (10 to 15%).
Forage in vitro dry matter digestibility (IVDMD) is a reliable predictor of its in vivo digestibility by the ruminant animal. Jensen (2003) reported ? 893 g/kg in vitro true digestibility of perennial ryegrass grown under five water-status regimes and multiple harvests across multiple years. Comparable results were observed during the first period of the present study when IVDMD was ? 92.7% for all treatments. In the second period, digestibility was greatest for O-RG compared with mixtures containing rye, and IVDMD values were ? 88.3% for all treatments. Values observed for IVDMD of mixed small grain/ryegrass pasture in the first and second period of the present study were higher than those observed in other studies with cool-season annual pastures. Moyer and Coffey (2000) reported average IVDMD for rye cultivars was 74.5%, 69.8% for wheat cultivars, and 72.1% for barley in an evaluation of forage quality of small grains grown in monoculture. Redfearn (2002) observed a decrease in IVDMD of annual ryegrass from 84 to 70% with increasing plant maturity. The relatively high values observed for digestibility during the first two months of the present study may be attributed to the extremely low concentrations of cell wall constituents, notably lignin, observed during the beginning of the grazing trial. Forages in the young, vegetative state are very high in quality (i.e., low concentration of NDF and ADF) and, if not extensively lignified, structural components of the cell wall are more readily available for digestion. Chesson (1982) recognized that the degradation of cell wall polysaccharides is affected as much or more by interactions among cell wall polymers as by the individual properties of the polymers themselves, which regulates the extent to which they are utilized by ruminal microorganisms. Forage IVDMD decreased across the grazing trial for all treatments, which is expected with increasing plant maturity.
Approximately three-fourths of the variation in ADG across treatments was accounted for by forage concentration of ADF as determined by stepwise multiple regression analysis. Forage concentration of NDF also entered the model, but only accounted for an additional 9% of the variation in ADG. Cattle ADG was greatest during the second period for mixtures containing oats, in which a decrease in forage concentration of ADF was observed between the first and second period. Moreover, ADF was lower for O-RG pasture than other forage mixtures during the third period, which presumably translated into greater digestibility of O-RG pasture than other treatments. Environmental factors may have also played a key role in changes in forage quality. Beck et al. (2005) reported that warm, wet conditions may cause increasing forage maturity in the rye component of mixed pastures, causing a reduction in animal performance. Moreover, Ball et al. (2007) noted that, although rye is generally available earlier, it matures and loses quality earlier and faster than oats.
In conclusion, mixed pastures containing oats were superior to R + RG for supporting beef cattle production from winter grazing, primarily as a result of less rapid changes in forage quality across the grazing trial. When DM yield and availability are managed aggressively as in the present study compared with more extensively managed, continuously grazed systems, forage quality becomes the primary factor involved in the support of adequate ADG for finishing beef cattle grazing cool-season annuals.
Temperature and precipitation
Monthly mean air temperatures in July, August and September were comparable to 30-yr averages for Shorter, AL (Table 13). Total precipitation was lower during July than the 30-yr average, but was 128% and 50% greater than 30-yr averages in August and September (Table 14).
Dry matter availability
No differences were observed in forage DM availability (Table 15) among treatments from Jul 14 to Aug 11 (P = 0.9180) and Sep 8 to Sep 29 (P = 0.2084). During the second period, DM availability was greater for pearl millet than cowpea (P = 0.0171) and lablab (P = 0.0093); however, no differences were observed in DM availability between cowpea and lablab (P = 0.3248) throughout the trial.
No differences were observed in ADG (Table 16) from Jul 14 to Aug 11 (P = 0.1685) and Sep 8 to Sep 29 (P = 0.4186) during the summer grazing season. Cattle ADG decreased dramatically from the first to second period of the experiment. Negative ADG was observed for cattle grazing pearl millet during the second period, which was lower than ADG observed for cowpea (P = 0.0025) and lablab (P = 0.0279). No differences (P = 0.7847) were observed in ADG among treatments across the entire 77-d grazing trial.
Crude protein
No differences were observed among treatments in forage concentration of CP (Table 17) from Jul 14 to Aug 11 (P = 0.4707). Concentration of CP was lower for pearl millet than cowpea (P = 0.0394) and lablab (P = 0.0165) in the second period of the trial. From Sep 8 to Sep 29, CP concentration was greater for cowpea than pearl millet (P = 0.0080), but was not different from lablab (P = 0.2490).
Cell-wall constituents
Concentration of NDF (Table 18) was lower for cowpea (P = 0.0047) and lablab (P = 0.0053) than pearl millet from Jul 14 to Aug 11. From Aug 11 to Sep 8, NDF concentration was greater for pearl millet than cowpea (P = 0.0206) and lablab (P = 0.0101), but did not differ between cowpea and lablab (P = 0.2045). During the last period, concentration of NDF was lower for cowpea (P = 0.0064) and lablab (P = 0.0081) than pearl millet.
No differences were observed among treatments in forage concentration of ADF (Table 19) from Jul 14 to Aug 11(P = 0.4191) and Aug 11 to Sep 8 (P = 0.4321). However, during the third period, ADF concentration was greater for cowpea (P = 0.0370) and lablab (P = 0.0402) than pearl millet.
Concentration of ADL (Table 20) was lower for pearl millet than cowpea (P = 0.0013) and lablab (P = 0.0019) from Jul 14 to Aug 11 of the trial. From Aug 11 to Sep 8, ADL concentration was lower for pearl millet than cowpea (P = 0.0036) and lablab (P = 0.0103), and lablab forage contained less (P = 0.0817) ADL than cowpea during the second period. During the third period, pearl millet had 5.9 and 4.6 percentage units lower ADL than cowpea (P = 0.0370) and lablab (P = 0.0402) treatments, respectively.
Discussion
Average temperatures for July, August and September were comparable to 30-yr averages for Shorter, AL and were within the optimum temperature range for growth of summer-annual forage crops (USDA, 2009d,f,i). Monthly precipitation was lower during July than the 30-yr average; however, beginning in August, monthly precipitation was considerably greater than the 30-yr average. Cowpea, lablab and pearl millet are relatively drought-tolerant species, so above-average rainfall may have favored increased forage productivity in the latter portion of the trial. Summer annuals are typically lower yielding than warm-season perennials, but they provided sufficient forage DM availability for grazing livestock throughout the present study. During the first period, DM availability was ? 2,000 kg DM/ha for all three forage species. Muir et al. (2002) reported that, in years with sufficient rainfall, lablab grown in Texas provided an average of 2,000 kg DM/ha/yr in the leaf portion alone, which would be sufficient to support livestock production. Moreover, cowpea produced between 2,000 and 4,000 kg DM/ha in years with adequate rainfall in Florida (Foster et al., 2009). From Aug 11 to Sep 8, DM availability was greater for pearl millet than cowpea and lablab. Pearl millet is known to be highly productive over a short season, with a typical DM yield between 1,800 to 4,000 kg DM/ha (Teutsch, 2002). Cowpea and lablab paddocks maintained roughly 2,000 kg DM/ha during the second period of the trial, and availability of cowpea decreased by nearly half during the final period. Lablab paddocks continued to maintain around 2,000 kg DM/ha, which is consistent with autumn-harvested lablab (1,891 kg DM/ha) reported by Muir et al. (2001). Availability of pearl millet decreased to by one-third between the second and third period, which may be attributed to a combination of limited regrowth following clipping in mid-August and subsequent grazing.
No differences were observed in ADG among treatments across the summer grazing season. Overall ADG for all treatments was between 0.52 and 0.59 kg over the relatively short grazing season. These values are lower than ADG of 1.23 and 1.17 kg from heavily grazed cowpea (all leaves and some stem removed) and lightly grazed cowpea (2 to 3 expanded leaves remaining per plant and little stem removed), respectively, over a 50-d grazing season reported by Holzknecht et al. (2000). However, Fribourg et al. (1984) reported that cattle grazing lablab continuously from Jul 28 to Sep 9 in Tennessee gained 0.37 kg/d, which is lower than values observed in the present study. Steer ADG was ? 0.97 kg/d for all treatments during the first period of the trial, which is highly satisfactory for the summer months. McCartor and Rouquette (1977) reported 0.96 kg/d for pearl millet grazed at a low grazing pressure (7.12 head•ha-1•d-1) in yr 1 of a 2-yr trial, and similar values were observed for yr 2. Lower ADG for pearl millet observed in subsequent periods of the present study may have resulted in part from lower grazing pressure and less intensive forage management than that used by McCartor and Rouquette (1977).
Satisfactory ADG was not sustained into the second period, and ADG decreased dramatically for all treatments; cattle grazing pearl millet lost weight (-0.50 kg ADG) during the this period. Low gains during the second period of the grazing trial may have resulted in part from declining forage quality between the first and second period. Forage concentration of CP was 10% for pearl millet during the second period, which in conjunction with high concentration of fibrous constituents (63.8% NDF and 36.6% ADF) may have been limiting to performance of finishing steers. Environmental effects may have also played a role in decreased ADG observed during the second period. Although mean temperature was similar between July and August, seasonally hot temperatures in August may have contributed to decreased grazing activity that in turn may have led to decreased forage DMI and ADG. Finally, at the end of the winter grazing season, steers had been moved temporarily from cool-season annual pasture to a mixed fescue/bermudagrass pasture until the initiation of the summer grazing trial. Cattle allotted to the cowpea and pearl millet treatments grazed the perennial system for 47 d and gained 0.15 and 0.02 kg/d, respectively. Lablab cattle grazed mixed fescue/bermudagrass for 54 d and gained 0.05 kg/d. Low ADG for cattle from the temporary perennial forage system followed by increased gains once on the summer-annual grazing trial may be attributed in part to compensatory growth. Because annual forages tend to be higher in nutrient concentration than perennials (Robinson, 1996), it is conceivable that the increased energy needs of finishing cattle were not met by the perennial system, and so compensatory growth occurred when animals began the summer-annual grazing trial. An increase in ADG was observed between the second and third period, although an increase was observed in forage concentration of total cell-wall constituents and a decrease was observed in forage IVDMD. These changes in forage quality are not consistent with the observed increase in ADG between the second and third period. Subsequently, increased ADG in the third period may be associated with increased grazing activity compared with the second period.
Young, leafy grasses and legumes are normally high in concentration of CP and typically are able to meet protein requirements of grazing animals (Ball et al., 2007). During the first period, forages within all treatments contained > 18% CP, which is typical of summer annual forages in the young, vegetative state. Cowpea and lablab contained the greatest concentration of CP during this time (21 to 23%), in agreement with values reported for legumes in the vegetative state in other studies (Muir et al., 2001). Decreased CP concentration was observed for legume treatments during the second and third period of the trial. Because stem protein concentration is usually less than that of leaves and petioles (Murphy and Colucci, 1999), observed changes in CP concentration may reflect decreasing leaf-to-stem ratio, which is expected with increasing plant maturity. Concentration of CP in pearl millet decreased by 8 percentage units between the first and second period. A rapid increase in DM availability of pearl millet, in conjunction with advancing plant maturity, may be associated with decreased concentration of CP in pearl millet during August and September. While percentage CP was low in pearl millet (10 to 11%) during the second and third period of the grazing trial, a large decrease in CP concentration is expected as forage matures from the vegetative to flower/boot stage. These values are slightly higher than the 6 to 8% CP reported by Ball et al. (2007) for pearl millet in the boot to fruit stage of development. Although concentration of CP was low for pearl millet forage, CP alone was likely not the major limiting factor in meeting nutrient requirements. Beef cattle finished to an endpoint of 636 kg require roughly 8.0% CP in feeds containing 60% TDN (NRC, 1996), which is comparable to the nutritive quality of pearl millet pasture in the present study. Across the entire grazing season, CP concentrations of cowpea and lablab were greater than pearl millet, consistent with the agronomic generalization that N-fixing legumes contain more CP than grasses.
Concentration of total cell-wall constituents differed between legumes and pearl millet throughout the grazing season. During the first period of the trial, concentration of NDF was lower for cowpea and lablab than pearl millet forage. Pearl millet contained 57.7% NDF during the first part of the trial, which is slightly higher than values reported by Hill et al. (1999) for hand-harvested Tifleaf 1 and Tifleaf 2 pearl millet leaves that contained an average of 53.5% NDF. Concentration of NDF in cowpea and lablab increased by 12.1 and 7.5 percentage units, respectively, between the first and second period. A slight increase in NDF concentration was also observed for cowpea and lablab during the third period, which may be associated with advancing plant maturity. Foster et al. (2009) reported NDF concentration of cowpea increased with maturity because of concomitant increases in leaf and stem NDF concentrations and decreasing leaf-to-stem ratios. Ugherughe (1986) reported that decline of forage quality with maturation results primarily from a decrease in leaf-to-stem ratio and decline in quality of the stem component. Fribourg et al. (1984) also observed increasing NDF concentration with advancing stage of development in lablab. Concentration of NDF in pearl millet increased by 10 percentage units between the first and second period, and only slightly increased between the second and third period. Increasing NDF concentration in pearl millet may be associated with the rapid increase in DM availability and advancing maturity observed after clipping during the second period. Concentration of NDF in pearl millet was higher than those of cowpea and lablab in all periods of the trial.
Forage concentration of ADF is negatively correlated with its digestibility in vivo (Van Soest, 1994). No differences were observed in ADF among forage treatments during the first and second period of the grazing trial; however, legume treatments contained greater concentration of ADF during the third period than pearl millet. Increased ADF observed for cowpea and lablab from Sep 8 to Sep 29 may be attributed to changes in leaf-to-stem ratio and advancing maturity of individual plant parts. Fribourg et al. (1984) reported similar values (35 to 37.4% ADF) for lablab plants in full bloom, which is comparable to the stage of development during the third period of the present study. Concentration of ADF was lower for pearl millet than cowpea and lablab by an average of 4.2 percentage units during the last period. Concentration of ADF of pearl millet ranged from 31.6 to 36.5% across the grazing season, in agreement with Ball et al. (2007) who reported a mean ADF concentration of 35 to 40% for pearl millet and sorghum species.
Acid-detergent lignin is the single cell-wall constituent that most limits digestibility of forage crops. During the beginning of the trial, lablab and cowpea contained small vines and stems, and were in the young, leafy stage of development. Concentration of ADL was 4.21 and 4.38% for cowpea and lablab, respectively, during the first period of the trial. Comparable values have been observed in other studies for lablab and cowpea harvested at a similar stage of development. In yr 1 of a 2-yr study, Muir et al. (2001) reported 4.78 and 5.88% ADL for „Combine? cowpea and „Tecomate? lablab, respectively. In yr 2 of the study, Iron-Clay cowpea was evaluated and contained 4.27% ADL. Percentage of ADL increased with each period and ranged from 4.21 to 9.21% across the entire grazing season for legume treatments. Legumes consistently contained more ADL than pearl millet in each period of the trial. Concentration of lignin is generally greater in legumes than in grasses at comparable stages of development; however, for a given lignin concentration, legumes are more digestible than grasses because they contain less NDF (Moore and Hatfield, 1994). Pearl millet contained 1.35, 2.64 and 3.35% ADL across the first, second and third period of the trial, respectively. Lower lignin concentration and higher quality of pearl millet in the first period may be attributed to immaturity of grass stems, which is expected for grasses in the vegetative state. Stems decrease in quality faster than leaves in most plants, especially as plants approach maturity and become increasingly more lignified (Nelson and Moser, 1994).
Forage IVDMD is a meaningful index of forage quality, which is important in the selection of forage species for use in pasture-based finishing systems. From Jul 14 to Aug 11, IVDMD was highest for all treatments. Cowpea and lablab contained ? 85.5 % IVDMD and were higher in percentage IVDMD than pearl millet during the first period. These results agree with in vitro true digestibility reported for Iron-Clay cowpea sampled across the summer growing season in Florida (Foster et al., 2009). Few studies have evaluated the IVDMD of lablab, and the present study is the first to report IVDMD data for Rio Verde lablab. Murphy (1998) reported 60.9 to 67.5% IVDMD for Rongai lablab harvested across the summer growing season, which is lower than values observed for mean IVDMD of lablab in the present study. Percentage of IVDMD of pearl millet was 78.7% during the first period, which is typical for pearl millet and sorghum/sorghum-sudangrass in the vegetative state (Ball et al., 2007). Similar values have been reported by Hill et al. (1999), who observed 75.3 and 76.9% IVDMD for Tifleaf 1 and Tifleaf 2 leaf samples, respectively, harvested near the end of the grazing trial. Forage IVDMD decreased for legumes and pearl millet in subsequent periods of the grazing trial, although no significant differences were observed among treatments. Increasing concentrations of NDF, ADF and ADL across the grazing season negatively impacted IVDMD of forage treatments, and may be associated with a decline in IVDMD in the second and third periods.
As steers approach harvest age, it is important to consider the changing nutrient needs of animals when implementing forage-based finishing systems. Warm-season annuals are initially high in forage quality, but quality rapidly declines with increasing maturity because of a short production season. Although gains were high for cattle grazing during the first period, negative changes in forage quality combined with environmental factors may have contributed to decreased ADG throughout the summer grazing trial. Overall ADG was not different among forage treatments, and summer annuals were unable to sustain satisfactory gains throughout the latter summer months.
The least squares means for both surface and interior color, as affected by diet and serving temperature is shown in Table 2. Both surface and interior L* values were higher (P < 0.05) for animals fed grain-based diets compared to forage-based diets as well as roasts that were served cold compared to those served hot. While there were no influences (P > 0.05) on surface a* from either feed or serving temperature, interior a* scores were lower (P < 0.05) for both grain-finished roasts compared to forage-fed roasts as well as roasts served hot compared to those served cold. Surface b* values were lower (P < 0.05) for roasts from forage-fed roasts that were served hot; however, roasts from grain-fed animals served hot had lower (P < 0.05) surface b* values when compared to forage-fed roasts served cold. Forage-fed roasts served cold had surface b* values similar (P > 0.05) to grain-fed roasts at both serving temperatures. Similarly, interior b* values were lower (P < 0.05) for roasts served hot than roasts served cold while diet had no effects (P > 0.05).
When comparing least squares means for color values as influenced by both feed and processing treatment (Table 3), surface L* values were higher (P < 0.05) for cured roasts when compared to both the controls and roasts with no cure. Surface a* values for cured roasts were higher (P < 0.05) in both feed groups; however, while the forage and grain control roasts had similar (P > 0.05) surface a* values, the forage control roast was higher (P < 0.05) than both the uncured forage and grain roasts. Grain control roasts surface a* values were similar (P > 0.05) to uncured forage roasts. However, uncured forage roasts had higher (P < 0.05) surface a* values when compared to uncured grain roasts, which had the lowest (P < 0.05) surface a* values. Control roasts had higher (P < 0.05) surface b* values when compared to uncured roasts which had higher (P < 0.05) surface b* values than cured roasts. Interior L* scores were higher (P < 0.05) for roasts from grain-fed animals as well as roasts that were either cured or pumped with no cure. Interior a* values were highest (P < 0.05) for cured roasts; uncured roasts exhibited the lowest (P < 0.05) interior a* scores. Processing treatment did alter b* values as control had the highest numbers (P < 0.05), followed by uncured and cured, respectively.
Least squares means for color values as affected by both aging period and processing treatment are evaluated in Table 4. Interior L* values were affected by aging treatment as 28 d roasts had higher scores (P < 0.05) than 0 day roasts. Sliced a* values were highest (P < 0.05) for 0 d cured roasts. The 28 d a* values were greater (P < 0.05) for cured roasts than 0 d control which were higher (P < 0.05) than both 28 d control and 28 d uncured. Uncured roasts that underwent a 0 d aging period had the lowest (P < 0.05) interior a* values.
While surface L* and interior a* values had no interaction, serving temperature affected them similarly as both scores were lower (P < 0.05, Table 5) for roasts served hot. Surface and interior a* values were higher (P < 0.05) for cured roasts served both hot and cold than control roasts served cold. However, control roasts served cold had higher (P < 0.05) surface and interior a* values than controls served hot as well as uncured roasts of both serving temperatures.
Tenderness differences among roasts exposed to different aging periods as well as different serving temperatures are evaluated in Table 6. Results show that roasts aged 28 d and served hot had higher (P < 0.05) shear force scores than 0 d roasts served hot as well as both 0 and 28 d roasts served cold. Additionally, Table 7 shows tenderness differences among roasts that underwent different diets as well as different processing treatments. Animals fed a forage-based diet yielded roasts with higher (P < 0.05) shear force values. Control roasts had higher (P < 0.05) shear force values than both roasts that were cured and pumped with no cure.
Lipid oxidation of roasts according to the thiobarbituric acid reactive substance assay as it is affected by both serving temperature and processing treatment is shown in Table 8. Control roasts served hot had similar (P > 0.05) values when compared to uncured roasts served either hot or cold. Uncured roasts from both serving temperatures were comparable (P > 0.05) to cured roasts at both serving temperatures. Additionally, uncured hot roasts were similar (P > 0.05) to both serving temperatures of cured roasts as well as control roasts served cold.
The differences in pumped weight, tumbled weight and cook-loss percentages among forage- and grain-finished roasts subjected to each type of processing treatment is shown in Table 9. Pumped percentage was highest (P < 0.05) for both uncured and cured forage-finished roasts. Additionally, pumped and uncured grain roasts had higher (P < 0.05) pump percentages than cured grain roasts. Similarly, both cured and uncured forage roasts had highest (P < 0.05) values for tumbled percentages; however there were no differences (P > 0.05) between the cured and uncured grain roasts. As expected both pumped weight and tumbled weight percentages were lowest (P < 0.05) in both forage and grain controls as they were not injected with brine solutions. Diet and processing treatment had no effect (P > 0.05) on cook-loss percentages.
While there were no differences (P > 0.05, Table 10) in pumped or tumbled percentages, cook loss percentage was highest (P < 0.05) for roasts aged 0 d and served hot followed by roasts aged 28 d and served hot. There was no difference (P > 0.05) between 0 and 28 d roasts served cold.
The comparison of least square means for all sensory attributes as affected by diet, serving temperature and aging period is shown in Table 11. When comparing differences in diet, forage-fed beef had higher scores (P < 0.05) for salt, soy and forage flavor intensities. Additionally, forage-fed beef had higher juiciness scores (P < 0.05) than grain-finished beef. Serving temperature affected tenderness as roasts served cold were more tender (P < 0.05) than roasts served hot. Additionally, cold roasts had higher intensity scores (P < 0.05) for “other” off flavors as opposed to roasts served hot. Aging period affected tenderness as roasts stored 28 d had more desirable tenderness rankings (P < 0.05) compared to 0 d roasts. An interaction of temperature and age altered juiciness as both 0 and 28 d roasts served cold had the highest (P < 0.05) scores. Juiciness scores in 28 d roasts served hot were higher (P < 0.05) than scores for 0 d roasts served hot. Beefy flavor in grain-fed roasts were not affected (P > 0.05) by serving temperature or aging time, but within forage-fed roasts, 0 d roasts served hot had lower (P < 0.05) scores than all others.
Sensory evaluation scores as affected by feed, processing treatment and serving temperature are shown in Table 12. Treatment alone affected soy, salty, grassy and sweet flavor intensity as cured and uncured products understandably had higher scores (P < 0.05) for both flavors. Additionally, tenderness values were higher (P < 0.05) for both cured and uncured roasts as compared to control roasts from both groups. A treatment by temperature interaction affected beef flavor as control roasts served hot had lower (P < 0.05) beef intensity flavor scores compared to all other treatments served both hot and cold. Uncured roasts served cold were rated less cohesive (P < 0.05) than control roasts served hot which were more mealy (P < 0.05) than control roasts served cold. Cured roasts served hot and cold as well as uncured roasts served hot were all similar (P > 0.05) in texture scores. Uncured roasts served cold were similar (P > 0.05) in texture scores to uncured roasts served hot as well as cured roasts served cold, but less cohesive than cured roasts served hot (P < 0.05). A treatment and temperature interaction affected juiciness as well, as cured roasts served cold and uncured roasts served cold had higher (P < 0.05) juiciness scores than cured and uncured roasts served hot. Additionally, cured and uncured roasts served hot as well as control roasts served cold had higher (P < 0.05) juiciness scores than control roasts served hot. Cured roasts had the lowest warmed over flavor scores (P < 0.05) regardless of serving temperature or diet. Additionally, grain-fed controls served hot and uncured were equally as low as all cured (P > 0.05). While forage-fed controls served cold had lower (P < 0.05) WOF scores than forage-fed controls served hot, grain-fed served cold had higher (P < 0.05) WOF scores than grain-fed served hot.
Grassy off flavor scores were affected by feed, processing treatment and aging period (Figure 1). Results show that the highest intensity (P < 0.05) of grassy flavor is found in forage control roasts aged 28 d. Forage control roasts aged 0 d as well as uncured forage roasts, both 0 and 28 d aged, had similar scores (P > 0.05). Forage roasts that were cured had the lowest (P < 0.05) grassy flavor scores for both 0 and 28 d aging periods.
Cured roasts served cold had lowest (P <0.05, Figure 2) grassy flavor compared to all control treatments. Control roasts aged 28 d and served hot had higher (P < 0.05) grassy scores than any cured or uncured roasts.
Discussion
Starting in the 1970’s, researchers began predicting that the beef industry would reduce grain usage in response to increased foreign demands for grains as well as steadily rising fuel prices. In response to this decrease, research on the proper utilization of all readily available energy sources, specifically forages became necessary (Hodgson, 1977).
The aforementioned issues have led researchers to evaluate the sensory and nutrient differences in forage- and grain-fed beef over the last thirty years. However, there has been no published research on the comparison of forage- and grain-finished beef subjected to further processing treatments. Due to this information, this study proves extremely useful as the sensory attributes of both forage- and grain-fed roasts are evaluated after further processing.
Color evaluations for this study were difficult to compare as color values were only obtained in cooked products and the research on cooked forage-fed beef color is nonexistent. However, results agreed with Vestergaard et al. (2000) in finding forage-finished beef had substantially darker muscle coloring when compared to grain-fed cattle. Additionally, as expected, all cured products had higher surface and interior a* values when compared to both the control and uncured roasts.
Tenderness was found to be significantly less desirable according to Warner Bratzler shear force values in forage-fed beef as opposed to grain-fed beef which agrees with Reverte et al. (2003), Kerth et al. (2006), Brewer and Calkins (2003) and Mitchell et al. (1991). However, roasts that underwent a 28 d aging period and were served warm had significantly lower shear force values as compared to all other treatments; injecting products with either a curing solution or a brine solution with no cure improved tenderness across all feeds, aging periods and serving temperatures. This research shows that by injecting forage-fed roasts with brine solutions and allowing longer aging periods, tenderness in forage-fed beef may be improved. However, in contradiction to Kerth et al. (2006) and Mitchell et al. (1991) sensory panelists found no differences in tenderness based on feed treatment.
Lipid oxidation, evaluated using the thiobarbituric acid reactive substance (TBARS) assay, showed no differences in oxidation due to feed treatment. However, serving roasts cold and the addition of either a cured or uncured brine reduced oxidation significantly for both forage- and grain-fed roasts aged both 0 and 28 d.
Contradictory to Sapp et al. (1999), results of this study found that sensory panelists found forage-fed roasts to be juicier when compared to grain-finished roasts. In addition to higher sensory panel scores for juiciness, pumped weight and tumbled weight percentages were higher for forage-fed beef than grain-fed beef. Higher sensory panel scores for juiciness and more pump absorption are likely due to the higher pH in forage-fed beef (Bruce et al., 2004).
When evaluating sensory panel scores for forage-finished beef, results for beef flavor intensity agreed with Melton et al. (1983) as beef flavor was significantly higher for grain-finished cattle as opposed to forage-fed cattle. While panelists were still able to identify grass flavors in all forage-fed roasts, regardless of the treatment, scores for saltiness and soy were higher for forage-fed beef. These higher values could possibly be attributed to the higher pumped and tumbled weight percentages for forage-fed beef.
Processing treatment showed a significant effect on the ability of panelists to detect grassy off-flavors. Curing a product significantly decreased the capacity of panelists to detect grassy flavors. Additionally, aging a control roast for 28 d substantially increased the presence of grass flavors compared to 0 d roasts according to panelists.
In conclusion, while research in forage-fed beef is expanding, the sector of further processed forage-fed beef has remained untouched and still encompasses many unknowns. Further research is needed to evaluate the significant effects further processing has on sensory traits of forage-fed beef as compared to typical grain-finished beef.
Educational & Outreach Activities
Participation summary:
In July, we hosted the "Locally-grown, locally-produced beef field day and conference". This field day involved first meeting at the EVSmith research center beef unit to evaluate the cattle on test for the summer grazing research portion of the study. Producers evaluated the forages and cattle from each of the treatments and a short summary was given on results to that point. The producers then traveled back to the Auburn University campus where they heard speakers from the USDA-FSIS, USDA-AMS, John R. White (a meat processing ingredient company), the AL Cattlemen,and MarketMaker. The objective of the conferences was to give the producers the tools and information they needed to formulate their own brand, develop new products, market those products, and reach their customers.
M.S. Thesis
Beef Cattle Performance, Forage Productivity and Quality from a Mixed Small-Grain/Ryegrass and Warm-Season Annuals Grazing System
by Mary Kimberly Cline
Full text: http://hdl.handle.net/10415/2071
?
M.S. Thesis
Marinating effects on the sensory characteristics of grain- and forage-finished beef
By Katie Elizabeth McMurtrie
Full text: http://hdl.handle.net/10415/2164
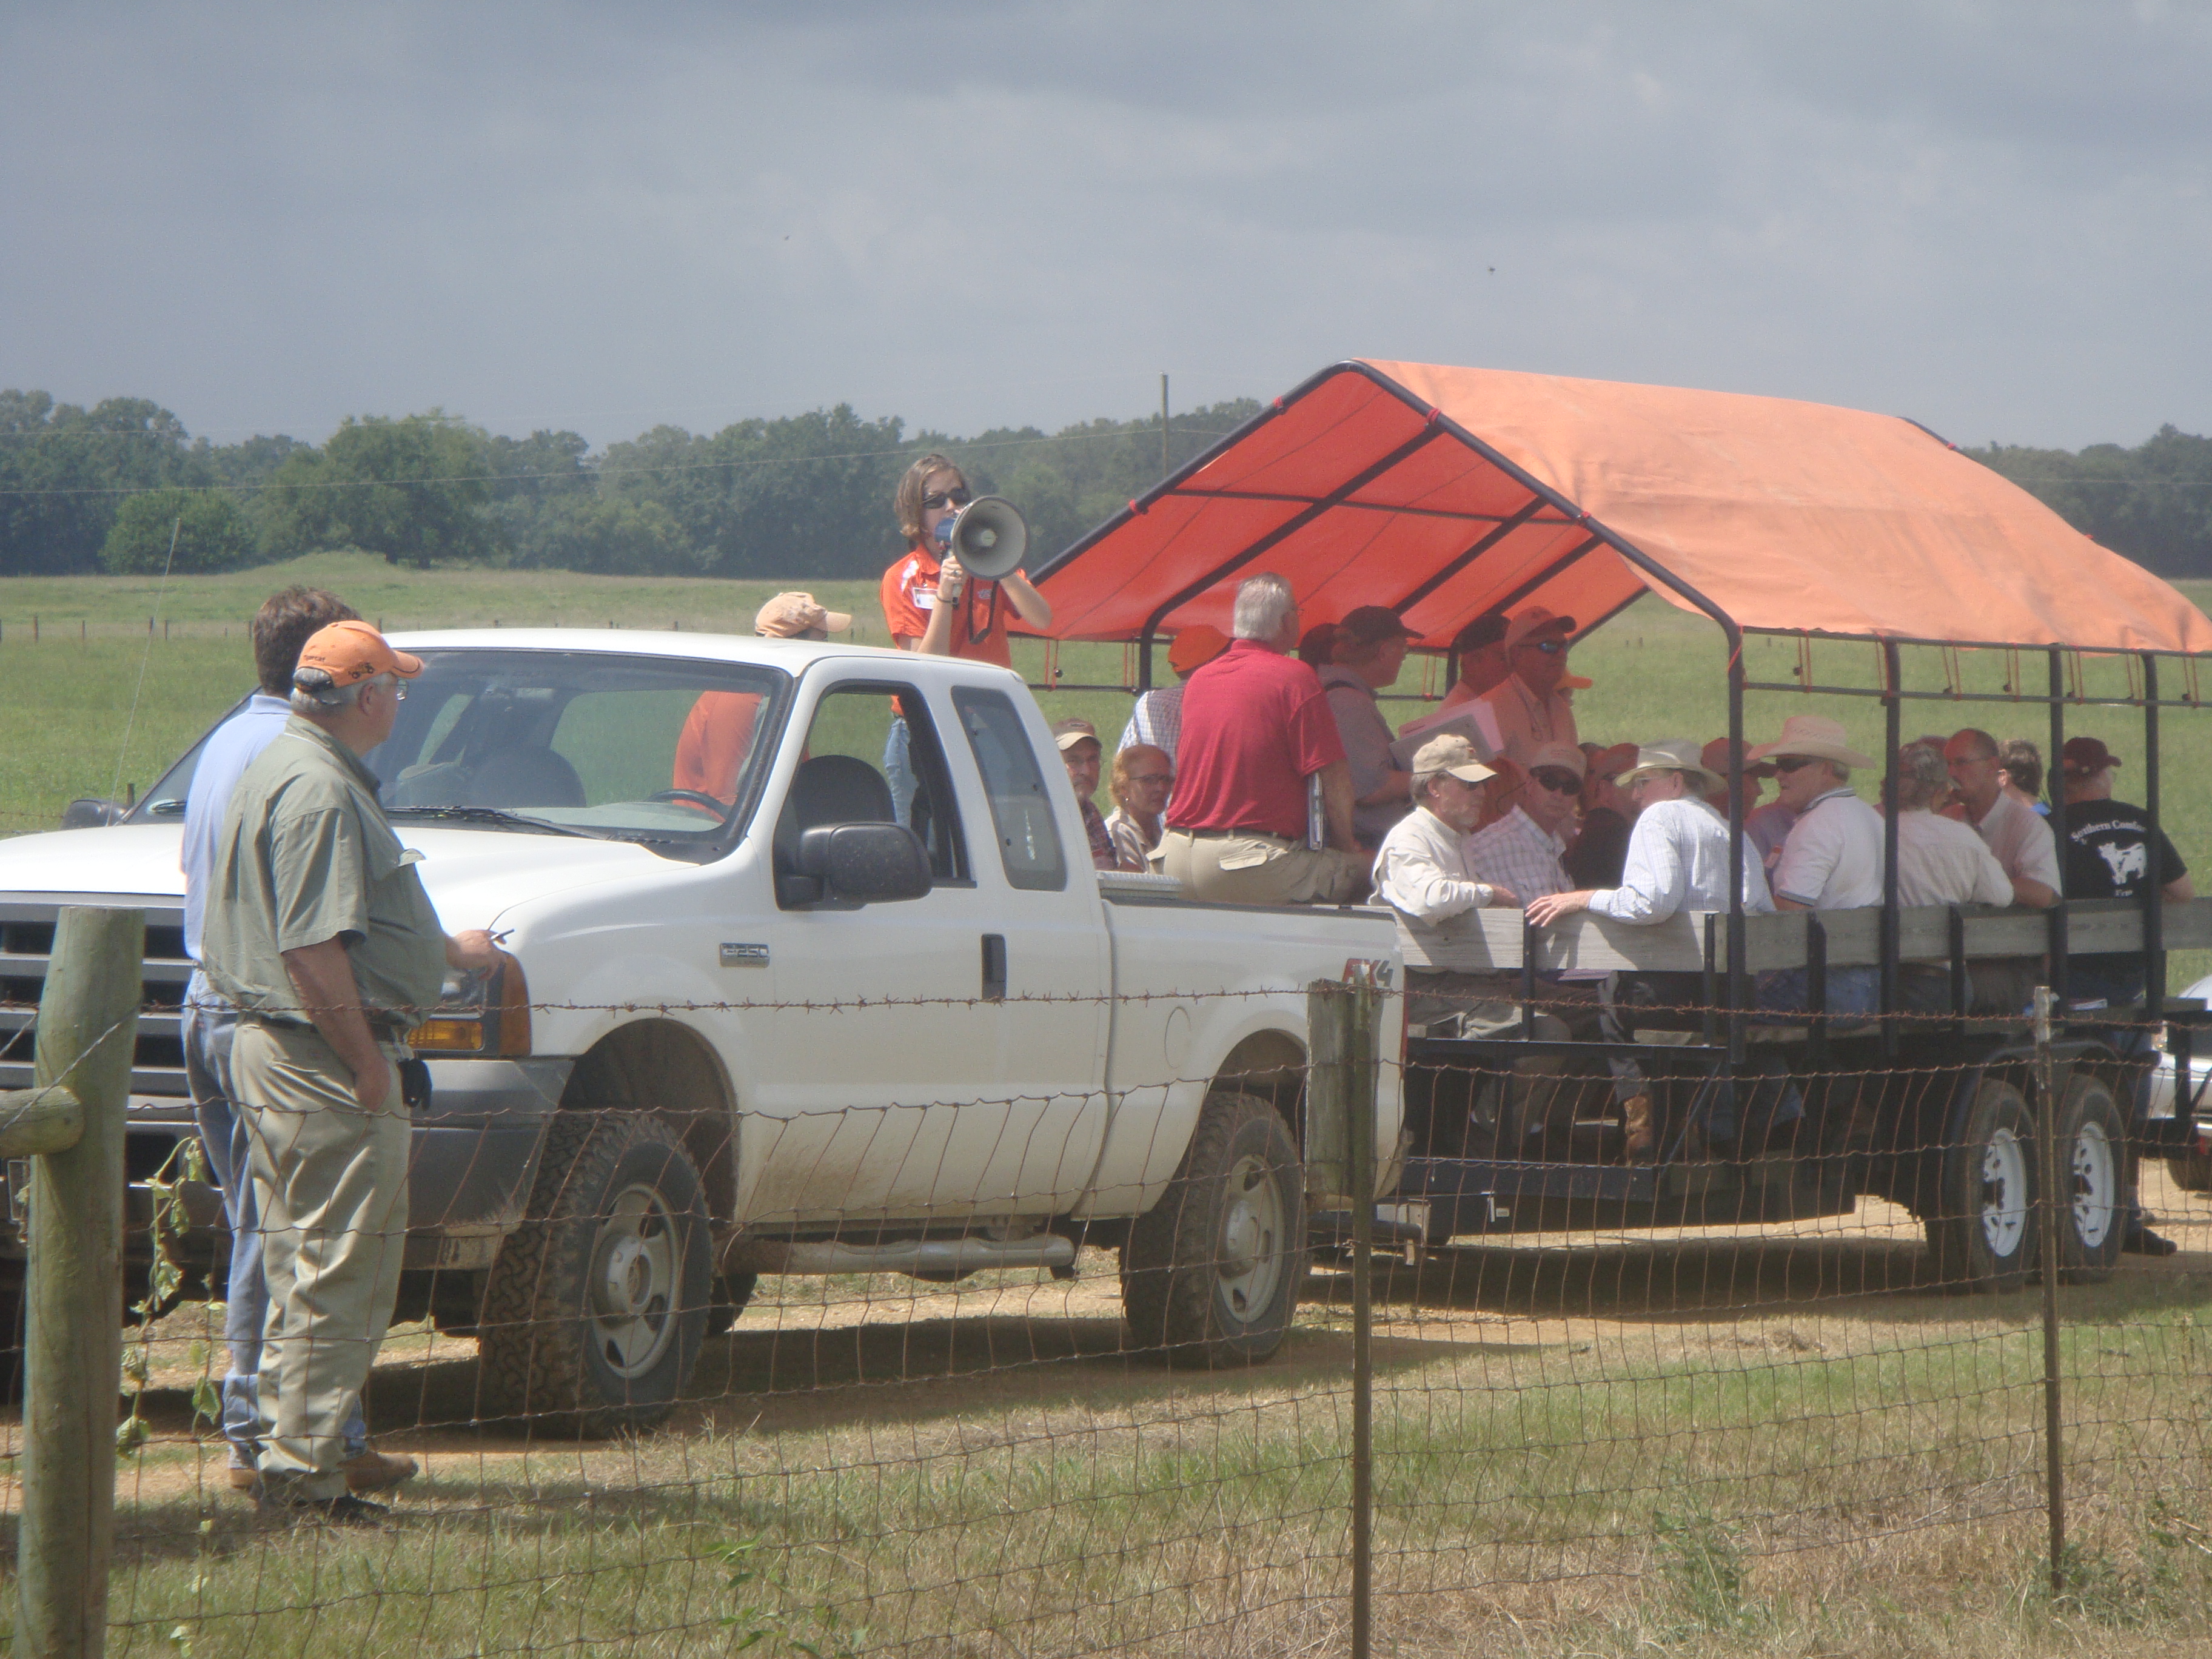
Project Outcomes
SWOT Analysis of a Potential Alabama-Grown, Forage-Finished Beef Industry
A SWOT (Strengths, Weaknesses, Opportunities, and Threats) analysis provides more understanding of
a new business venture. Correctly identifying the strengths, weaknesses, opportunities, and threats will improve management decisions and the chances of business success. The following includes a list of factors believed to be pertinent to an Alabama forage-finished beef business venture.
Strengths
• Domestically produced
• Improved use of local resources (land, labor, capital, and management)
• Increased economic activity within the state of Alabama
• Traceable back to the farm
• Health benefi ts
– Lower levels of E. coli
– Less calories
– Higher levels of omega-3 fatty acids
– Higher levels of vitamin E
– Higher levels of conjugated linoleic acid (CLA)
• Humane production system
• Environmentally friendly production system
• No antibiotics
• No added hormones
Weaknesses
• Lack of an established market
• Lack of consumer knowledge about cooking forage-fed beef
• Lack of meat processor knowledge about processing forage-finished beef
• Longer production time than traditional beef finishing (feedlot)
• Lighter carcass weights than traditional beef finishing (feedlot)
• Slightly higher breakeven price per pound than traditional beef finishing (feedlot)
• Limited quantity and quality of forage during summer and fall
• Taste and tenderness of meat effected by forage-finishing on some grasses
• Limited state-wide facilities with appropriate inspection status to harvest finished cattle for shipping the product
out-of-state
• Forages lack the nutritional energy and protein of grain feedstuffs
• Forages cannot be as economically stored and transported for later use as compared to concentrate feedstuffs
(corn, soybean meal, etc.)
• Forage quality varies widely with growing conditions (vagaries of the weather) and among forage species
• Lower quantity of meat consumed by an aging population
Opportunities
• A growing segment of the beef market is interested in healthier beef (natural beef, grass-fed beef, organic beef)
• Consumers express more interest in and are willing to pay for safe food
• Consumers have higher levels of disposable incomes to spend
• Forage-fed beef is well positioned to be marketed to youth due to the health attributes associated with it
• Target markets may include restaurants, grocery stores, health stores, school-lunch programs, individuals, etc.
Threats
• Imported forage-fed beef
• The adoption of adverse governmental policies and regulations affecting forage-fed beef
• Inconsistent quality of forage-fed beef
• Inadequate quality control of forage-fed beef products (grading)
• Decline in consumer demand for forage-fed beef
• Competition among beef sources (grain-fed, organic beef, natural beef, etc.)
• Competition of alternative meats (pork, poultry, lamb, etc.)
Economic Analysis
The future development of a forage-finished beef industry is a real possibility. Current research surveys have documented that a segment of U.S. consumers prefer forage-finished beef for its taste, healthiness, and traceability and are willing to pay a premium price. Thus, the future growth and development of a forage-finished industry depends on whether sufficient numbers of consumers are willing to vote with sufficient premiums for forage-finished beef products. Under current economic conditions, those premiums appear to be about $1 to $2 per pound of merchantable forage-finished beef. However, successful marketing involves getting products from producers to domestic and international consumers, which is a complex chain of activities that is critical to the economic survival of farms and agribusinesses.
Some of the limitations facing the forage-finished beef industry include the high cost of beef production per pound (land, labor, capital, & management), achieving adequate animal rates of gain for marbling, availability of adequate quality and quantity of forage production for animal weight gains, maintaining a consistent high-quality product for the consumer, maintaining a reasonable level of edible meat yield, imports of forage-finished beef, handling and distribution costs, exchange rates, and educating consumers about the attributes of forage-finished beef. Additionally, any weakness or decline of consumer demand for forage-finished beef would have a serious negative impact on the forage-finished beef industry.
Lastly, the definition and label requirements of forage-finished or grass-fed beef as set forth by USDA could also have a major impact on the future development and growth of the forage-fed beef industry. The forage-finished definition address the types of feedstuffs permitted to be fed, certifi cation process and procedures, management practices, label requirements, and possibly other subject areas. The type of feedstuffs permitted to be fed appears to be the most critical element of the forage-finished definition. It is expected that any adjustments forage-fed definition that requires strictly grass consumption will likely constrain the supply and development of the forage-fed beef industry, while a less restrictive feedstuff requirement that allows some level of supplementation would encourage the development of a forage-fed beef industry.
The future of the forage-finished beef industry hinges on the attributes of forage-finished beef and how consumers perceive them, chaning production input costs, the costs handling and distribution, grading standards, and any adjustments in the USDA definition of forage-finished beef, and the level of consumer demand for forage-finished beef. A watchful eye on these items will provide beef consumers and producers with an indication of whether the forage-finished beef industry will become a reality.
Farmer Adoption
The field day event in July saw the involvement of more than 100 producers and processors from Alabama, Georgia, Tennessee, Mississippi, and Florida. Producers from the field day have made contact with many of the speakers at the field day to develop labeling, get USDA approval for branding, and develop the "MarketMaker" system in Alabama. It was vitally important for the producers to have this opportunity as many said they were not aware that these resources existed for them to market their product.
Areas needing additional study
Additional knowledge of both winter and summer forages is needed to evaluate the production traits of the forage and the animals grazing them. Further knowledge of animal biological type is necessary to properly balance the gain and production characteristics with carcass traits and palatability and to be able to best match the forage with the animal type. As shown in this report, a great deal of potential lies in the development of value-added beef products from cattle finished in a forage system. Emphasis should be placed on the acceptability and marketing of these products in a manner that adds value to the system and does not just produce a commodity.