Final report for ENE15-136
Project Information
The dairy business is a system and should not be compartmentalized. Producers and their advisors need to examine the whole farm system. Decisions made in one area can have significant impacts in other production management areas. Extension educators and consultants are positioned to examine the whole farm system by capturing the agronomics, nutritional and financial components. Income over feed cost per cow is a simple monitoring tool to evaluate costs associated with purchased and home-raised feeds along with the current milk income. Based on previous results working with dairy producers it was determined that corn silage quality and feeding management influence farm profitability. Producers can benefit from advisors that understand cropping, feeding and economics to help implement smarter decisions.
A total of 26 dairy farms from across Pennsylvania and 44 consultants including nutritionists, extension educators and industry representatives signed a MOU committing to involvement in this project, which included forage and feed sampling and analysis, financial record keeping, production monitoring and participation in educational workshops and meetings. The original project scope involved sampling and detailed analysis work with consultant-farmer pairs for one year, and $12,000 in additional funds were leveraged to extend this work for a second year.
Twenty-four and twenty-six dairy farms participated in 2016 and 2017, respectively, with 23 farms participating in both years. Consultants and farmers received training through 4 webinars, 4 workshops and multiple brunch meetings about: financial record keeping; corn silage analyses and interpretation of results; factors that influence variability in corn silage feed value such as processing score and particle size; and the importance of routinely monitoring silage quality and income over feed costs (IOFC). Participants also received protocols and checklists to assist in data collection for the cropping, feeding and financial sections, and had follow-up consultations with the project team by email and phone. Development of cash flow plans was included in the project so farmers’ breakeven income over feed cost could be used for monthly monitoring.
Project consultants and producers were surveyed in 2016 and 2017 about changes made as a result of their learning. In 2016, 10 farmers and 9 consultants responded; in 2017, 14 farmers and 10 consultants responded. Fourteen of the 19 respondents (73%) in 2016 implemented changes after the first harvest year, including changes in evaluating corn silage quality for fiber, starch, particle size and kernel processing score. Thirteen (68%) reported they regularly checked their TMR (formulated versus actual) and adjusted as needed; 11 (58%) performed a TMR audit and 14 (73%) included cost of production in routine management decisions and monitored IOFC monthly.
In 2017, 5 of 14 producers (36%) responding to the survey shared project results with their employees and family members and 4 (28%) discussed them with other consultants. Of the 10 consultants responding, 4 (40%) sharing results with their advisory teams and 4 (40%) with other business employees. Including the participating dairy producers and the client base of consultants responding to the survey, 350 dairy farms totaling 32,050 cows and 31,000 acres of corn silage were potentially impacted by the project’s results.
Over the course of this project, extension educators reported their educational efforts in an Excel spreadsheet capturing date, location, number of producers and number of total attendees. Power point presentations were developed incorporating results of the on-farm project related to corn silage quality, the TMR analysis, and financials. Nine dairy educators reported presenting at 121 events, advisory team meetings, or farm assessments between November 2017 and September 2018. Thirty-five presentations (Extension programs or invited talks) reached 1,494 participants, of which 600 were dairy producers.
A formal evaluation was done at the 2017 and 2018 Penn State Dairy Cattle Nutrition Workshop. Participants attended at least one of three breakout sessions that contained results from this project. Average breakout survey respondents (n=18) identified a change from minimal (2.64) to moderate (3.35) understanding of whole farm system interactions as a result of the sessions. Average breakout survey respondents (n=18) identified a change from somewhat likely (2.33) to moderately likely (3.05) in intention to apply the whole farm system interaction skills learned at the sessions.
The project leader shared results in the monthly newsletter Dairy $ense and in Penn State Extension’s Dairy Digest. An article in the October 2018 edition of Hoard’s Dairyman contained the financial summary of the participants related to IOFC. Guest speaking invitations continue into 2019.
Over the course of this project, consultants and producers repeatedly inquired about the benchmarks or metrics that should be used for setting goals. Producers and consultants voiced their confusion on financial ratios and what they mean. They wanted a one-stop publication that included both financial and production related parameters. As a result, members of this project along with other educators developed a fifty-six-page publication titled “Business and Production Guide for Dairy Cattle Operations” that contains benchmarks and explanations related to finances, cropping, feeding, and several other management practices.
Consulting in pairs, 24 crop and dairy educators and industry partners will work with 24 producers to improve corn silage management and feed management of forages. 6 educators will present results in workshop settings reaching 300 consultants and 200 producers. 100 producers managing 10,000 corn silage acres will implement at least one recommended corn silage or forage feed management decision tool.
According to the U.S. dairy 2018 statistics (USDA National Agricultural Statistics Service), Pennsylvania has 6200 licensed dairy operations. Based on USDA’s NASS report for 2018, 390,000 acres were planted for corn silage producing 7.4 million tons compared to haylage grown on 410,000 acres producing 2.68 million tons. Assuming these farms are on limited land base, producing and feeding forage of consistent quality and quantity is paramount. Through needs assessments and working interactions with dairy producers over the past 10 years, the Penn State Extension dairy team has found that producers and their consultants need continued learning and support to understand and improve the quality and consistency of forage to better manage animal nutrition.
In 2008-2009 Pennsylvania’s Center for Dairy Excellence conducted a dairy farm survey that resulted in a 22% response rate. Of the total, 65.9% of the respondents reported milking less than 80 cows and nutrition was one of their top priority areas. In 2010-2011 the Extension dairy team conducted focus group discussions across all regions in Pennsylvania with large farms (>200 milk cows) and small farms (<200) to evaluate the issues most important to them. The major themes identified for education were business management, nutrient management and managing forages/crops. These data indicated the need for improved nutrition management is present on farms of all sizes.
The Extension dairy team worked with several hundred herds for five years doing cash flow plans or income over feed cost analyses, and many herds are feeding a high corn silage-based ration. The assumption made by consultants and producers is that corn silage quality is very consistent compared to other crops like alfalfa and grass, which can change in quality throughout the growing season. The dairy team worked extensively with 44 dairy farms from 2013-2014 on cash flow planning and analyzing corn silage quality and evaluating its impact on herd performance. It was found that a huge variability exists in silage quality between and within farms. The neutral detergent fiber digestibility (% of NDF, 30 hr.) ranged from 44 to 63% among the participating farms. The 7-hour starch digestibility was measured in the fall and spring and the typical or expected response would be to observe an increase in this measure over time. On these farms, 33% remained the same, 40% increased and 26% decreased. Given these results, the approach to ration balancing would be very different.
In August 2014, 140 people attended a twilight meeting in the second largest dairy county in Pennsylvania and were surveyed on the topics of greatest interest. Double cropping, forage and feed-based education and business management ranked the highest, and similar themes still rank at the top for additional education among farmers.
Crop and dairy educators work with producers at multiple decision points in the educational process. Limited communication has resulted in insufficient understanding of how silage quality and quantity impact farm profitability. In April 2014, the Penn State crop and dairy educators met at the annual in-service training to discuss collaborative efforts related to forage management and feeding. The dairy team presented results from the advanced cash flow project where corn silage quality was variable. The crops team shared the differences in yield and quality of corn silage in their numerous trials. Economic impacts are not well understood and are not considered in hybrid selection or corn management. Decisions based solely on optimizing the dairy ration or profitability could have negative long-term agronomic consequences. A consolidated and integrated approach was needed to better assist the dairy farming clientele and illustrate how decisions made throughout corn silage production and feeding processes affect the whole farm system.
This project was designed to help educators, crop consultants and nutritionists more fully understand the dairy farming system from the crops to the cow. The educational program addressed how cropping decisions affect forage quality and quantity, and the impact this has on profitability. The advisors learned how to utilize this knowledge and associated tools developed through the project when working in train-the-trainer workshops as well as when they are advising their producer clientele. In Pennsylvania several hundred farms have profit teams, where the farm’s consultants meet routinely to discuss challenges and bottle necks to profitability. Extension educators and consultants are facilitators on many of these profit teams. By being better informed about the whole farm system, they can incorporate what they have learned from the agronomics, feeding and financial component of the operation to help solve problems.
Cooperators
- (Educator)
- (Educator)
- (Educator)
- (Educator)
- (Educator)
- (Educator)
- (Educator)
Educational approach
The educational approach for this project has been a combination of individual farm visits, hands-on workshops for the financials, presentation style to a large group, webinars, popular press, and emails.
Twenty-four dairy operations were selected for an intensive assessment on cropping, feeding and financial management practices. The producers along with their advisors signed an MOU regarding their participation in this project. They filled out checklists on their cropping practices and feeding management, and supplied the data needed to do a complete financial assessment. Two sampling periods were used to access corn silage quality and precision feeding. During this project, the project team communicated routinely by producer-advisor partners by email, webinars and face to face meetings regarding the individual farm’s results. Meetings were held with the participants to review a summary of the results as well as how their farm was doing compared to the other producers. Data from this project was conveyed in numerous invited talks as well in the popular press.
In workshops conducted solely for the project participants that involved summarizing the financial data including expenses related to home raised feeds and purchased feed costs, consultants were able to visualize the issues being discussed and how they impact the financial standing of the operation. The producers, knowing their cost of production, were more informed about the amount of additional income was needed to pay down bills or consider any loans for capital improvements.
Milestones
1. 60 educators and appropriate industry partners receive invitations via an on-line survey regarding the project proposal, objectives, preliminary data, and willingness to work with both a partner and 2 producers for one year October 2015
60
24
67
October 31, 2015
Completed
September 30, 2017
Our team held face to face meetings across the state to review this project. The majority of the audience was producers. We did have a few nutritionists and crop consultants meet with us, however, that was more on an individual basis. We are communicating with 69 people on this project. Emailing folks seems to be the preferred method of communication. We have one producer who does not have email and the educators are making regular visits to collect the information.
- Several tools have been developed to assist our producers in recording their information. In addition we have developed the financial balance sheets and cash flow forms to track income and expenses.
crop-enterprise-costs-blank-form
crop-and-feed-inventory-form-blank
cost-of-production-blank-data-input-form
30 respondents complete an on-line survey about current level of knowledge and learning needs related to crops, feed and financials. December 2015 - January 2016
24
30
28
70
January 31, 2016
Completed
September 30, 2017
Currently collecting signatures for the project via the MOU and doing a face to face assessment versus an on-line survey. Producers feel more comfortable with this approach.
Signatures have been collected and include the producer, nutritionist and crop advisor. Our team members have met face to face with crop consultants and their number one challenge working with nutritionists relates to the various corn silage hybrids.The nutritionists are not examining starch and/or starch digestibility on a regular basis and this has implications to the ration formulated. The focus is on yield and not considering the other attributes. In the face to face meetings with nutritionists, there is a lack of understanding related to the whole farm financial analysis. Our Crops to Cow to Cash program was developed for nutritionists as the key audience to evaluate the whole farm system. The team is currently in discussion with the crop consultants to conduct an educational program for their sales force on determining the cost to produce home raised feeds and the impact of corn silage quality on dairy cattle nutrition.
Based on our crops to cow to cash workshop for consultants (12), there is a major gap in knowledge related to the financials. The challenge is obtaining the required information from the producer and determining if the information is complete and accurate. The time commitment has been significant taking at a minimum 2 days and 5 hours each day to collect all the needed information. This has been a frustration for the consultants.
For presentations to consultants regarding financials, they are struggling with accessing the big picture and tend to focus on minutiae. They also want to fixate on one single metric regarding forage quality or the ration and our data is supporting the fact that this does not guarantee high level of animal performance or profitability.
3. 25 of the 30 respondents commit to the requirements of this project and will attend a face to face workshop located appropriately geographically to learn the curriculum and tools available to work with producers. March – April 2016
24
25
24
33
April 30, 2016
Completed
September 30, 2017
On April 23, the core crop and dairy team members met to develop the curriculum for workshop presentations. The team developed the MOU for producers, crop consultants and nutritionists. A representative from Pioneer seed attended to provide his input.
The first workshop was held on August 26 with 22 crop and dairy educators and 3 NRCS folks attending.
A second workshop was held on November 11 with 54 crop consultants and nutritionists attending.
Met with Bill Sutliff from Mycogen Seeds on May 14 to describe our project and sent him a copy of the MOU. He is currently soliciting farms for the project.
I met with Tammy Weaver and Gene Schurman on Aug 4 to describe our project and sent them a copy of the MOU.
On September 8 I had a conference call with Amy Hoy from Hubner Seed about our Crops to Cow project. She has committed 10 farms to the project on top of the 24 farms budgeted in the grant. I sent her the MOU, the checklist and the cost of sampling so she can budget accordingly.
Corresponded with Dave Kehr with Mycogen Seeds on Oct 2 about our project and has submitted the MOU on 3 farms and have their commitment.
Met with Dale Miller from Agri-Basics on October 14 to discuss the project crops to cow. He was sent a copy of the MOU.
I corresponded with 2 dairy producers who have filled out the MOU and have and will complete the checklist on cropping and feeding management.
Other team members are meeting with producers and their advisors to explain the project, collect information, get signatures on the MOU and take a corn silage and TMR sample. This is occurring on 19 farms from September- December.
On December 8 presented to 40 producers on our project hosted by Farm Credit.
On December 15 presented to 62 producers on the project in Lancaster, which was hosted by Hubner seed.
On December 16 presented to 43 producers and 7 nutritionists about the preliminary data we have collected so far and the new project being started.
30 service providers have been committed to this project. Some have been more engaged than others. Email has been the preferred way of receiving information. The more engaged consultants have attended the brunch meetings to hear about the results. The main seed company representatives, especially Pioneer, Hubner, Mycogen, and Channel have been the more engaged participants and have invited myself and other team members to present to their sales folks. In contrast, the nutritionists working individually with the producers have been very engaged.
There is no doubt that the producers have been very excited about this project. As a result, we have five additional producers participating in year 2. Only 1 farm was removed from the original 24 because their nutritionist was not very cooperative and it was difficult getting the required data.
4. A minimum of 12 educators and industry partners will participate in 4 follow-up webinars to review resource materials, criteria for soliciting farms and collecting information from producers. May 2016 - July 2016
12
33
July 31, 2016
Completed
September 30, 2017
We had four webinars scheduled. March 18 – Financials; April 8 – BMPS for crops and feeding; August 5 – CS harvest; and Dec 2 – Feeding management. There have been approximately 10 people on the live presentation but others have reviewed the recorded sessions. Emails are sent out reviewing key points from the webinars.
The majority of the attendees on the webinars have been the dairy producers. Consultants like the face to face type meetings. Many of the farms have profit teams so the consultants are getting the information on data collection and results at the profit team meetings, or via phone conversation, or by emails.
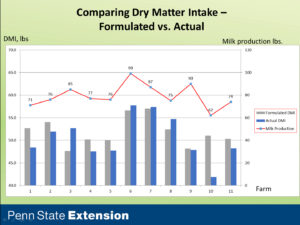
During the financial webinar filling out a balance sheet, income statement and income over feed cost were covered. BMPS for crops and feeding reviewed the checklists that were developed for this project to capture details related to planting, tasseling, and harvest. The corn silage harvest webinar discussed the drought conditions in Pennsylvania and the extreme variation in corn silage quality that might occur. We asked if producers would take pictures of their corn silage at time of harvest so we can compare to the corn silage analysis. Details about the corn silage and total mixed ration sampling was reviewed. The feeding management webinar reviewed the data collected to date related to the change in fiber and starch digestibility from fall to spring, the variability in dry matter intake on farms with similar milk production and compared to the formulated ration.
We have had tremendous support from our educators with 7 of them being actively engaged in our project. We have had 8 service providers actively engaged, as some are servicing more than one producer on this project.
Webinars are not popular with this group and they have been attending the face to face meetings and are providing feedback to me and other team members with questions about the results and wanting more follow-up with our data. This has been either face to face discussions or email.
5. 24 farms start the project and the appropriate data collected. August 2016
24
60
26
60
August 31, 2016
Completed
September 30, 2017
25 farms have started the project which actually started back in March 2016 (collecting some financials and cropping info).
Each farm has a nutritionist (25) and some farms are their own crop advisor so there are 19 independent consultants. However, interaction on training is more with the leaders of the seed companies, Mycogen, Pioneer, Hubner, King Agri-seed. The leaders are interacting with the project more so than the field staff. They all are included in the exchange of information but the seed company leaders are the ones requesting us to train their folks or to talk with their producers. This has the ripple effect of reaching more than the folks tied directly to this project.
Twenty-four farms (one farm is going out of business) have completed appropriate data for the project including:
- cash flow plan
- income over feed cost
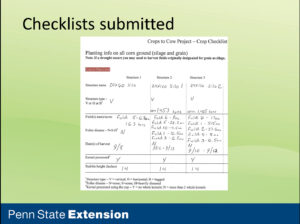
- all the crop checklists provided by project
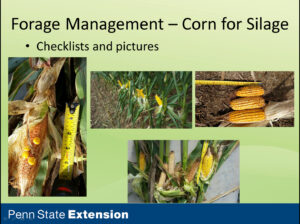
- pictures of their various corn hybrids and fields
They are also currently sending in their corn silage samples for nutrient analysis, processing score, particle size, total mixed ration analysis, particle size, pounds of milk shipped, information for calculating dry matter intake and the details of the ration being fed to the lactating cows.
They will also submit a copy of their milk check to assess milk price, components and quality premiums.
At the end of September 2017 all twenty four farms have a completed FinPack analysis, completed IOFC to date, all corn silage and TMR analyses have been sampled and collected. All rations have been submitted.
2. Example pictures that producers took during harvest
3. Example checklist filled out
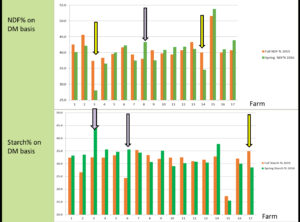
4. Results from the transition year. Corn silage NDF and Starch can vary substantially from fall and spring on some farms.
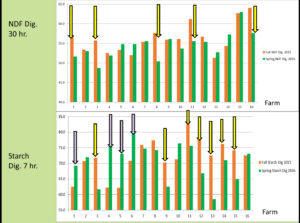
5. There are wide swings in fiber and starch digestibility. Our data shows that starch digestibility is not trending like refereed research shows. In fact, we are seeing the trend being the complete opposite, where starch digestibility is substantially lower in the spring vs. fall. Capturing cropping details on these 25 farms should help explain why this is occurring.
6. TMR intakes matching formulated rations and how they compare across farms with similar production. Some farms have very good agreement with the formulated diet, others are way off. In the official start of the project we will be comparing the nutrient specifications of the formulated diet and the actual analysis. We will also be comparing particle size of the TMR.
Twenty-four farms have completed the first year of sampling, which occurred from November 2016 through September 2017. The data set is completed for these twenty-four farms. Another farm was removed from the project as the nutritionist was not forthcoming on providing the ration information.
Second Year Added
Originally, the sampling portion of the project was to end spring 2017. However, producers and consultants were very engaged in this project and inquired about doing it for another year. Additional funding was obtained so a second year could be done on the corn silage and TMR sampling (November 2017 - February 2018 and May 2018 – August 2018). Producers also requested another complete financial year using FINPACK®. This provided the opportunity for educators and consultants to use the tools developed for this project, i.e. cash flow spreadsheet. For the second year three farms were added by request, bringing the total to 26 participating farms.
6. A minimum of 12 educators and industry partners will participate in 4 webinars to review farm data and share successes and challenges in the three curriculum areas. September 2016 – August 2017
12
28
70
August 31, 2017
Completed
November 17, 2017
Our participants seem to prefer emails and face to face. Several producers have profit teams so the producer, nutritionist and crop consultant meet routinely with our educator as the facilitator/specialist. Others visit the farms routinely to review results, others communicate via email. We have been sharing the results through emails and attachments. Several of the consultants have attended our workshops to learn more about the tools we have to offer. Results have included pictures of the corn silage across the state and how variable it is. Farms are doing their monthly income over feed cost, which they are sharing during their profit team meetings.
Because of word of mouth and writing about the results in monthly newsletters, our team members are being invited to talk to companies and events about this project. This has occurred earlier in the scope of this project versus what was predicted in the milestones. In addition to the participants directly involved in the project, it has also had a much broader reach and we have been working with producers and service providers not directly involved in this project.
Several of the consultants attended our earlier workshops to learn more about the tools we have to offer. We held an additional workshop at the Penn State Dairy Cattle Nutrition conference to conduct a hands-on workshop to determine the costs to produce home raised feeds and how this provides the true income over feed cost for the producer. Twenty-five consultants attended and utilized the newly developed pdf fillable forms.
Throughout the summer of 2016 we have been sharing information from the project as we go along. We have 2017 dates reserved for the face to face meetings: Feb 14, 15, 21, 22; April 4, 5, 11, 12. We have also developed a curriculum specifically for consultants – Crops to Cow to Cash. The dates are January 24, April 26, September 12 and January 2018.
7. The project team leaders will develop a Power Point presentation including data from the participating farms and a supporting fact sheet summarizing the results. September – October 2017
1990
1140
October 31, 2017
Completed
October 31, 2018
Several power points have been developed over the past year that include the results to date on this project. Currently the data is being formatted and getting ready to analyze. A 56-page publication has been developed in lieu of a fact sheet sharing the results on cropping, feeding and financials.
Dairy $ense is a monthly article written by Virginia Ishler and includes data from this project to highlight the big picture approach to the whole farm system.
Tim Beck and Virginia Ishler wrote an article for Hoard's Dairyman that was accepted. It was published in the October 2018 edition.Oct.-25-2018-Margins
Dairy Outlook is being released every month to 1200 Ag professionals. Much of the data incorporated is a result of this project. https://extension.psu.edu/dairy-outlook-october-2017
Channel Seed used our data for their pamphlet.2019CS-Forage-Guide-Northeast_Final
Below is the financial data from the project that is being presented. Each farm received their data and all farms and consultants received the summary of all farms.
8. At least 6 extension educators present results from this project at 8 established conferences, workshops, and field days for a minimum 300 consultants and 200 producers. November 2017 – June 2018
6
9
June 30, 2018
Completed
September 30, 2018
9 Extension dairy educators presented at a total of 121 events including industry and advisory team meetings, and farm assessments from November 2017 thru September 2018.
More information about these activities is described in the Performance Target section.
9. A follow-up survey to the 24 crop and dairy educators and 24 dairy producers evaluating what they learned, what practices they implemented, and what future areas should be explored. January 2018 – April 2018
24
24
24
36
April 30, 2018
Completed
August 31, 2018
Survey monkey was used to gain feedback from service providers and farmers on this project in 2016 and 2017. Information from surveys is presented in the Learning Outcomes and Performance Target sections, as appropriate.
Additionally, in February 2017 our group met with the producers to complete their 2016 cash flows and do a projection of 2017. Follow-up meetings occurred to complete the FinPack analysis of the 24 farms. In April 2017, both consultants and producers were invited for a brunch meeting to share the results of the financials (producers received their individual results) and the rest got the group analysis as well as the results to date on corn silage quality, agreement with the actual TMR and the formulated diet as well as dry matter intake agreement. Directly from this project, 20 consultants and 34 producers attended. Of the producers the wife and/or sons attended. Seventeen farms were represented.
During the various sampling periods (December 2016 - April 2017) and (April 2017 - September 2017) producers and/or the nutritionist responded to problems in feeding management (poor agreement). Several of the producers had their mixers checked and found problems with the scales or mixing apparatus. The grant paid to re-sample the TMR and there was improved agreement as well as an increase in animal performance.
10. Summarize results from this project and write a fact sheet. May – September 2018
January 31, 2019
Completed
February 25, 2019
A publication has been developed titled "Business and Production Guide for Dairy Cattle Operations".
It is 56 pages covering assessment of Finances, Crop Production, Production and Feeding Management, Reproduction, Milk Quality, Replacements and Herd Turnover, Animal Health, and Water Quality Management.
This is a result from feedback from producers and consultants wanting benchmark information, with many of the financial and production metrics taken from the data compiled from this project.
Data has been summarized and reported.
Milestone activities and participation summary
Educational activities and events conducted by the project team:
Participants in the project’s educational activities:
Learning Outcomes
Survey monkey was used to gain feedback from service providers and farmers on this project in 2016 and 2017. An Excel spreadsheet was used by extension educators to record all educational events where results of this project were presented.
Consultants and producers were surveyed over the two harvest years (2016 and 2017). They rated how well results for silage quality or changes in quality agreed with their expectations (1= no agreement to 5= completely agreed), and both groups responded similarly. For results related to the corn silage analysis, TMR analysis and the financials – producers in 2016: 3.9 and in 2017: 4.2; consultants in 2016: 3.75 and in 2017: 4.0.
Both groups were also asked how valuable the silage results were (1=no value to 5=high value), and it is interesting to note that both groups increased their rating on how valuable the results were on the second survey – producers in 2016: 3.95 and in 2017: 4.34; consultants in 2016: 3.95 and in 2017: 4.17. This relates to the feedback they received from the researchers about their results and the changes that were made in management practices because of the results.
Description of Key Elements of Learning
During the first-year corn silage processing (kernel processing and particle size) was identified as a concern by the producers (n=22) during the April brunch meetings. Properly processing corn silage allows the starch to be more readily available to the cow. Special equipment is required to process corn silage and usually adds expense for the producer. With the kernel processing results communicated to the producer and nutritionist, they had discussions with their harvesters (home or custom). Improvements were documented in the second year. Corn silage processing score is defined by the percent of starch passing a 4.75 mm screen, with greater than 70 percent deemed optimal, 50-70 percent adequate, and 50 percent inadequately processed. Results from the first sample period [Fall 2016 (n=22)] showed 26 percent as optimal, 65 percent as adequate, and 9 percent inadequately processed. By contrast, the last sample period [Spring 2018 (n=26)] showed 50 percent as optimal, 46 percent adequate, and 4 percent inadequate. Sixty-eight percent of farms with complete sampling data experienced a positive increase in average corn silage kernel processing score from first (66 ± 13 percent) to second (77 ± 8 percent) sampling year. Thirty-two percent of farms (n=22) saw a corn silage kernel processing score improvement of at least 10 percent. These farms averaged 59 ± 12 percent kernel processing score for the first sampling period and averaged 76 ± 7 percent kernel processing score for the second sampling period.
The particle size of the TMR was relevant. TMRs testing outside the recommended ranges can lead to sorting by the cows and potentially result in low milk components and production. During year one producers and their nutritionists were given feedback on the results. In year two, 78 percent (n=51) of TMR particle size samples had at least three of four screens within recommended ranges, compared to 46 percent (n=46) in year one. The critical screens for particle size distribution are the top and bottom, especially related to sorting. In year two, 53 percent (n=51) of TMR particle size samples had both top and bottom screens within recommended ranges, compared to 33 percent (n=46) in year one.
Another learning aspect of this project was starch digestibility of the corn silage. Based on our previous work the typical increase in starch digestibility does not always occur. The relevance of this pertains to ration adjustments to account for this difference so animal performance is not compromised. Evaluating all the farm samples, 28 percent (n=50) had an average of 13 ± 6 percent decrease in starch digestibility between first and second samples within the sampling year (Fall vs. Spring). The highest decrease was 26 percent and the lowest decrease was 6 percent. When starch digestibility from sampling was not increasing over time as theorized, participating nutritionists evaluated the ration formulation and silage quality to improve cow performance. Based on receiving this information the following changes were documented:
o 64% (n=9) increased an average of 1.2 pounds dry matter purchased concentrate fed.
o 43% (n=6) increased an average of 2.8 pounds dry matter corn silage fed.
o 29% (n=4) increased an average of 1.2 pounds dry matter corn grain fed.
The critical component that is often overlooked is the impact on cost. Eight farms with a decreased corn silage starch digestibility between first year samples experienced an average $0.11/milk cow/day increase in quarterly feed costs while the cohort farms only had an average of $0.01/milk cow/day increase in feed cost for the same quarters. In sample year two, only five farms had a decrease in corn silage starch digestibility between samples. They experienced an average $0.23/milk cow/day increase in quarterly feed cost while cohort farms had an average decrease of $0.02/milk cow/day in quarterly feed costs. Nutritionists were making changes when starch digestibility decreased.
Over the course of this project, between the April brunch meetings and face to face interactions with producers, discussions took place about opportunities to improve profit. This included strategies to improve milk income and/or reduce expenses. Thirteen percent (n=23) of farms with both year-end analyses saw an improvement in their net return ranking in the second year. However, 17 percent (n=23) saw a decline in their net return group ranking. This could be related to another consecutive year of low milk prices along with increased costs because of low forage inventories from the 2016 drought.
Due to the current status of the dairy industry, the conservation district professionals are requesting meetings to discuss the results from this project. The financial, feeding and cropping costs are of particular interest. A workshop was conducted on December 7, 2018 in Lancaster to NRCS and conservation district folks. As a result, and word of mouth, two more workshops have been requested for March 2019 and one for April 2019. The results from this project have provided a wealth of data to help producers and Ag professionals better understand the financial situation being dealt to the industry and how this information can also apply to conservation practices. Our program name is now Crops to Cow to Cash to Conservation - The 4Cs.
Performance Target Outcomes
Performance Target Outcomes - Service Providers
Target #1
24
Consulting in pairs, 24 crop and dairy educators and industry partners will work with 24 producers to improve corn silage management and feed management of forages.
24
Nothing was listed for the target as we did not know what the farms would look like until we received their MOU.
21
26
Project Farm Demographics.
23 farmers included in the demographic data below participated in both years.
Metric 2016
Number of Farms 24
Total # cows: 7,974
Total Milk sold (lbs): 195,801,178
# acres farmed: 12,879
# acres double cropped: 5,781
# acres corn silage: 5,675
# acres small grain silage: 4,731
Metric 2017
Number of Farms 26
Total # cows: 8,385
Total Milk sold (lbs): 206,722,139
# acres farmed: 14,323
# acres double cropped: 5,995
# acres corn silage: 5,553
# acres small grain silage: 4,736
Target #2
6
6 educators will present results in workshop settings reaching 300 consultants and 200 producers.
200
Nothing was listed for the target as we did not know what the farms would look like ahead of time.
21
726
Based on the results on the second survey sent out to participating consultants in 2017, 350 dairy farms were influenced in some way by information learned through this project for a total of 32,050 cows and 31,000 corn silage acres.
- 7 Curricula, factsheets and other educational tools
- 286 Consultations
- 24 Published press articles/newsletters
- 4 Tours
- 155 Webinars/talks/presentations
- 22 Workshops/field days
Farmers and consultants working together in the project on silage quality monitoring and financial record keeping received surveys in 2016 and 2017 reporting on their learning and follow-up actions. Extension educator participants filled in an Excel spreadsheet about their additional educational activities, listing their name, date, location, task, activity, total direct attendees and number of producers. Consultants received survey monkey surveys.
Responses to the survey sent to farmers and consultants in 2016 and 2017 were: 2016, 10 farmers and 9 consultants responded; 2017, 14 farmers and 10 consultants responded. In addition to reporting on their learning (described earlier), the respondents also reported on changes they had implemented as a result of their participation in the project.
In 2016, fourteen of the 19 respondents (73%) implemented changes after the first harvest year, including changes in evaluating corn silage quality for fiber, starch, particle size and kernel processing score. Thirteen (68%) reported they regularly checked their TMR (formulated versus actual) and adjusted as needed; 11 (58%) performed a TMR audit and 14 (73%) included cost of production in routine management decisions and monitored IOFC monthly.
In 2017, 5 of 14 producers (36%) responding to the survey shared project results with their employees and family members and 4 (28%) discussed them with other consultants. Of the 10 consultants responding, 4 (40%) sharing results with their advisory teams and 4 (40%) with other business employees.
The 9 extension dairy educators who filled out the Excel spreadsheet, reported they presented at a total of 121 events including workshops, face-to-face farm visits, industry and advisory team meetings, farm assessments, presentations or publications that reached. Details below.
- Activities with project participating farms
-
- 54 farm assessment meetings with 171 participants (multiple assessments per farm)
- 16 advisory team meetings with 128 participants (multiple advisory team meetings per farm)
- 5 project result meetings with 49 participants (producer and consultants) that interact with a minimum of 129 farms managing 5,144 cows
- Additional Extension programs
-
- 21 extension programs reaching 440 participants and a minimum of 328 farms
- 7 undergraduate lectures to 89 undergraduate and veterinarian students.
- 2 extension twilight producer meetings with 485 participants, reaching 251 farms managing 10,907 cows.
- 1 extension in-service to 12 extension professionals
- Industry meetings
-
- 14 industry producer meetings reaching 1,026 participants and 826 producers
- 1 international industry meeting reaching 28 producers
The reason for 21 service providers instead of 24 is that several worked with multiple farms on the project. The crop consultant many times was the producer or the main representative for the seed company was the contact. That limited the crop consultants to four main entities, Pioneer, Mycogen, Hubner and Channel.
2017 Survey Monkey Response Comments from farmer-consultant participants regarding corn silage and TMR analysis:
- The starch percent and digestibility between cs samples may due to hybrid differences which may be why we see something different from our expectations.
- Our corn silage samples came from 2 different varieties and the initial sample was Pioneer 2088 which I was told has particularly bad starch values after harvest. I was not aware of that prior to this project.
What changes did you or do you plan to implement as a result of the project?
1 Increasing corn silage in diet
2 We have intensified the management of corn silage harvest including packing, particle length, and processing. We have also worked on increasing the silage inventory.
3 Already adjusted the ration based on TMR results Discussing the KP scores was also helpful
4 The biggest change was investigating the discrepancy between TMR analysis and calculated levels. Processing score was important to prepare for this year's harvest. The analyses were useful immediately in ration formulation.
Besides milk price, what do you see as the biggest challenge to achieving reasonable cost of production in the next year?
- Milk Basis being enforced
- Herd health. Commodities stabilization
- Maximizing feed inputs.
- Making sure we have enough Forage of high quality to lower purchased feed costs
- Feed Prices Land/Rent Prices
- Ration cost and labor continue to be the two biggest challenges to keep under control.
Please provide any comments or suggestions on the program content or delivery below:
1 I get concerned when the client questions my program bc of extension questioning the He diet and they don’t understand the parameters of constraints we are under
2 Well organized, informative results
3 My answers on this survey are based on my role as veterinarian and nutritional consultant for this dairy, so my rankings emphasize the herd end of the survey.
Additional Note
We were not able to engage the crop educators into this project. Two of the participating crop educators changed jobs and retired. The other crop educator was in a territory not representative of the geographic location for the majority of farms. However, the engagement of the seed companies with this project more than made up for the lack of participation by the crop educators.
Performance Target Outcomes - Farmers
Target #1
100
100 producers managing 10,000 corn silage acres will implement at least one recommended corn silage or forage feed management decision tool.
10,000 corn silage acres
1
In 2017, for the project farms, ten producers out of 24 responded to survey monkey. The other producers participated in a cash flow workshop where we obtained all their financial and production information to determine their breakeven cost of production. Results from this project were presented to the producers.
2017 Responses from Survey Monkey
Comments from participants on corn silage and TMR analysis:
1. Discovering that the TMR analysis did not match the calculated levels was very beneficial to the operation.
2. Our farm needs to improve in almost every category. First, I go over our kernel processor every year. I just rebuilt it 2 years ago (total rebuild) and we still cannot achieve highest standards for kernel processing. Therefore we cannot implement a change. More immediately we are making changes to the ration and feed storage. A higher corn silage diet is our goal and we are already achieving this, increasing from 18 to 22.5 dry mAtter pounds of corn silage. We are also working on our fermented feed base, not only on corn silage but high moisture shelled corn as well. I don't feel that we will be make any changes to our hybrid selections however. We feed mostly bmr and are satisfied with the results from that.
3.The biggest change will be in product selection. If there is a variety that has poor feed values soon after harvest, we will either not use that variety or put it in the silo first so it has time to ferment before it is fed, in order to get the most out of it.
4. We were in a severe drought last year and therefore results were off.
What changes did you or do you plan to implement as a result of the project?
1 marked in the upright silo variety changes and resampled whenever we got to the change
2 changed nitogen application, tightened the proseser roles on the harvester, custom hire larger packing tractor
3 Higher corn silage in the dairy ration, increased from 18 to 22.5 dry matter pounds. Increased fermented feed base
4 We plant less varieties. Focus on kernel processing. Understand better what practical expectations are for forage evaluations
5 We have not made any wide sweeping changes at this point. The biggest change is just making sure we plant varieties that should not be fed right away, first so that they can be chopped and put on the bottom of the silo.
6 Monitoring more closely the relationship between paper ration and cow side ration. Monitoring particle size of ration on a more regular basis.
7 Use cost of production and cost of homegrown feeds to determine what to grow.
8 Keep a closer eye on the forage harvester.
9 None
Besides milk price, what do you see as the biggest challenge to achieving reasonable cost of production in the next year?
1 management feed cost.
2 production
3 production increase
4 labor, old facilities
5 Related to milk price, but the oversupply issues we are dealing with right now. Land O Lakes is trying to keep production in check, but if they are the only ones who try to limit production, it will not help everyone anyway and the price will continue to be poor.
6 Labor
7 Feed cost and employee costs
8 Expected crop results not beinget due to wild weather patterns.
Please provide any comments or suggestions on the program content or delivery below:
1 This was a great program. I'm the next generation on our farm, and it help me to understand how decisions impact our profitability.
2 It would be good if there were an online check off list. So we could see what information was due and when.
3 good program for both large or small dairy. Small group gives you a lot more one on one time
Eighty-four to 104 dairy operations completed a cash flow plan, determined their breakeven cost of production, IOFC, and the costs to produce their corn silage. All farms had discussions about how to use their numbers in making decisions involving cropping strategies, feeding management and to improve their profitability.
Additional Project Outcomes
I was able to obtain additional funding to pay for another year of corn silage and TMR testing. Twenty-three of the twenty four farms are continuing on the project and we were able to get five additional farms to participate in this project. This will help get another year of data along with a complete financial analysis of 2017. This will add more validity to the one year of data that we have obtained.
Our team is currently working on examining the data and conducting a DEA analysis so that this can be published in a refereed journal and/or in ARPAS (American Registry of Professional Animal Scientists).
We are also updating the Channel Seed Guide with updated financial numbers from this project that will be revised for 2019.
Our abstract to ADSA annual meeting was accepted. That is June 23-26, 2019. It is an oral presentation
An abstract was submitted to the 2019 National Farm Business Management Conference. Should know April 1st if it’s accepted. That meeting if accepted would be an oral presentation on June 9 to the 13 in Sheboygan, WI.
An abstract was submitted to the National Association of County Agricultural Agents for their Annual Meeting and Professional Improvement conference. It was for another oral presentation. If accepted, it would be presented on Sept. 8-12 in Ft. Wayne, Indiana .
Submitted the program for a Search for Excellence award with the Ag Agents Association, as well as communications award for the publication for the Ag agents association.
A handful of consultants that were part of this project were also on profit teams with participating extension educators. They relayed information from this project when discussing challenges or bottlenecks to the profit team farm.
After each sampling period on a farm, results and an assessment were sent to the producer and nutritionist. Any problem found with the TMR analysis not matching the formulated diet was quickly addressed by the nutritionist or producer. They provided me feedback that they found the problem and that cows responded to the change.
Producers valued the annual financial information more than the IOFC. There were 9 out of the 24 producers who religiously supplied their monthly information for IOFC. It was challenging for the others to provide that information, however, they were very willing to supply the annual financial information. At the brunch meetings, both producers and consultants were very engaged in wanting to understand what their numbers meant and what the financial ratios imply. At all brunch meetings a lot of discussion ensued on how their production practices influence their financials.
Five extension educators who did not have a strong financial background are now working with their clientele on doing cash flow plans with the tools developed by our team. They are also more aware of the data from this project related to cropping practices and feeding management that have helped them work better with their clientele.
Face to face is still the preferred method of working with producers and consultants. Webinars were not successful for this project. Email and text was the preferred method of providing information and communicating results.
Understanding financials and knowing how to keep good charts of accounts is an area that still needs a lot of help. Once producers collect the information and get things sorted properly, they are much more eager to work on financials compared to producers who have not taken this first step. However, it needs to be done with the assistance of "someone". They also value discussion related to what others are observing and how they compare. They need assistance in tying the pieces together on the whole farm approach. There is still too much of a piece meal approach when evaluating production areas and not taking into account the ripple effect that may occur and what that means to the big picture. Consultants get frustrated very quickly on the financial side especially when working with a producer who does not have good records. Extension educators have more flexibility in working with producers to get this information organized, but their numbers are limited and consultants already have a full plate with sales. The financial institutions provide a lot of information to the point of overwhelming the producer. The missing part is the production aspect and where producers need to look to make improvements.
When producers do their cash flow plans, they are extremely good at getting expenses in line. The problem area is generating adequate income through milk sales. This is the most common problem area observed. Producers either do not know the total milk pounds they need to ship to cash flow or they do not maintain the number of milk cows needed to cash flow. Many of the issues come down to basic management practices that are still not being implemented on farms. This can include both forage quality and quantity, feeding management, and other production practices.
The biggest challenge of this project was not engaging the crop educators. We did get assistance from one of them housed at University Park and based on the information we collected wants to use some of it for the class he teaches. Based on several conversations with educators the focus of their work is just on crops and nutrient management, anything beyond that is outside of their comfort zone. We were not successful in engaging them. However, from the crop consultant perspective, they valued the animal side of the equation and were extremely supportive of this project. This was demonstrated by invitations to talk to their producers at meetings and to include our data in their seed catalog.