Final report for GNE16-138
Project Information
Soybean (Glycine max L.) production has grown throughout the Northeast US during the past decade propelled by the increasing demand for and price of soybeans worldwide, and the need for a locally produced protein source for the Northeast livestock industry. To maintain a sustainable local supply of soybeans, there is a need for crop producers to understand management tactics to improve crop profitability and productivity, especially during times of lower grain prices such as exist today. The purpose of this project was to deploy and evaluate our approach of integrating field measurements with crop modeling to understand soybean yield variation across a set of farms in Pennsylvania with divergent soil management practices. Field data was collected in two counties of Pennsylvania (Centre and Lebanon) during the 2016 and 2017 growing seasons. In 2016, due to a greater variability of planting dates and precipitation regimes, soybean yields varied from 20 to 75 bu/ac. In 2017, water stress was not a problem in most fields. Nonetheless, soybean yields varied considerably, from 21 to 129 bushels/acre. As expected, highest yields occurred in Lebanon county. The average yields in Lebanon and Centre county were 96 and 59 bu/ac, respectively. The best soybean yield predictor for the regions and years studied was planting date (Soybean Yield = -0.75*(day of planting) + 179, R2 = 0.7). Using Principal Component Analysis, we found that planting date, phosphorous, potassium, zinc, and soil depth were the main soybean yield predictors (R2=0.79). The physical, biological, and chemical soil indicators tested in the comprehensive Cornell assessment of soil health did not significantly correlate to soybean yields in the 13 fields studied during the 2017 growing season. The regression of the overall quality score indicated no relationship with soybean yields (R2=0.008). Saturated hydraulic conductivity (Ksat) explained 53% of the soybean yield variability; Ksat varied from 1.2 to 15.2 in/hour. Root depth and Ksat were also related (R2=0.47), and root depth was also positively correlated to soybean yield (R2=0.54). Our measured as well as modeled data confirms that planting date is the main control of soybean yield in Pennsylvania, but improved soil properties reflected on ksat and soil depth allow for the expression of high yield potentials. Growers from Lebanon county benefit from both an environment that allows earlier planting than in Centre county and the availability of low-cost manure. Our results suggest that current soil health metrics not always relate to soybean yield. However, in-situ infiltration (ksat) measurements could be a promising indicator of soil health that relates to soybean productivity.
Using field and modeling techniques, our goal was to identify soil, plant and climate attributes that are most closely related to soybean yield to both provide agronomists with indicators to use for field estimates of soybean yield potential and to improve model simulations. Specifically, the objectives were:
- Identify key soil, plant and climate indicators that relate to soybean yield on commercial farms of PA.
- Evaluate and improve if needed the cropping systems model CYCLES at simulating the effects of soil health on soybean yields in the selected fields. (in progress)
- Evaluate the impact of soil management history on soil health indicators and soybean yields. (next step)
Soybean production has expanded throughout the Northeast US during the past decade and has generally been a profitable grain crop. Locally grown soybeans are critical to support the region’s livestock industry, and soybean yields often are a primary driver of a positive return on investment (ROI). Now that soybean prices have declined, there is a need for crop producers to understand cost effective tactics to improve crop profitability. Producers report a wide range of soybean yields across our region, from 40 to 100 bu/ac, even when using similar management tactics. We believe this is likely due to factors related to soil health, and chiefly the soil water holding capacity. Even within fields, there can be substantial variation in soil and topographic attributes that generate a range of production conditions, from high to medium and low productivity in fields broadly considered prime farmland. Hypothetically, and with other factors notwithstanding, soil physical properties can be the ultimate driver that limits nutrient and water capture via its control on infiltration, storage, and root exploration of the soil volume. Pennsylvania’s producers have been unwittingly running a long-term experiment in their farms: by adding or not adding manure to the soil they may have generated a range of soil health conditions that is experimentally difficult to accomplish in the short term but offers a wonderful opportunity to test the relationships among soil health attributes and productivity in commercially managed fields. At the same time, laboratories are offering soil testing packages to evaluate the chemical, physical and biological activity of croplands as indicators of soil health.
However, these tests are often costly for the producer, and translating soil health test results into actionable management practices remains challenging. Farmer-focused research is still necessary to identify the most suitable soil health indicators, and ultimately to explain how they relate to crop yields. A better understanding of the relationship between soil health and crop yields would help agronomists to promote sustainable soil management practices in the region. Agronomists are currently exploring the spatial variability within fields to recommend higher input use in areas called “profitability zones” or high return on investment areas (HROI), and less intensive management in low return of investment areas (LROI). These low yielding areas could be targeted for improved management that ameliorates the factors that limit plant growth. This could include targeted applications of organic materials such as manure and spent mushroom substrate, cover cropping, and no-tillage. Extension educators report that farms that have implemented these tactics as a method of improving soil health seem to have improved soybean yields over time. Overall, there is a need to better understand the relationship between soil health factors and soybean yields. Understanding this relationship will help to increase soybean profitability, promote tactics that improve soil health, or retire potentially low yielding areas from input intensive crop production. We propose that a useful framework to study the controls of soil health on crop productivity and profitability is through a cropping system simulation model. Simulation models attempt to represent the fundamental biophysical processes occurring in the crop-soil interface, and therefore provide a platform to integrate soil health metrics into a prediction of crop yield response. Furthermore, simulation models that are trained to capture the effects of soil health on crop yields can be used for a variety of management planning purposes. For instance, the model could be used to project how investments in sustainable soil management practices, such as the addition of organic amendments or the use of cover crops, translate into yield and profitability increases in the future. The model could also be used to interpret the causes of intra-field and inter-year variation in yield maps, and therefore help implement precision agriculture and precision conservation practices. As more detailed weather information continues to become available from commercial sources on a real time basis, there is potential for real time crop modeling to be widely adopted in our region.
Cooperators
Research
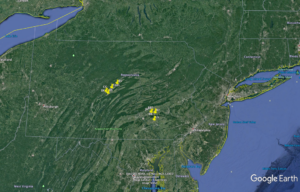
Field data was collected in two counties of Pennsylvania (Centre and Lebanon) during the 2016 and 2017 growing seasons. In 2016, the study was exploratory and involved greater variability of planting dates and soybean varieties. In 2017, we selected two fields per farm with the same planting date and variety, but with divergent record of soybean yields. In total, we worked with 8 fields in 2016 and 13 in 2017 from a total of 10 farms. Most of the fields used no-till for at least 10 years, and only 3 fields were planted under conventional tillage. About half of the fields had a long history of manure application, particularly in Lebanon county. We collected information from soil (soil and root depth, texture, bulk density, soil test, organic matter, infiltration, water holding capacity, Cornell comprehensive assessment of soil health), plant (population, phenology, light interception, NDVI, height, lodging, biomass, test weight, protein) and climate (temperature, precipitation, solar radiation, relative humidity, wind speed). We analyzed this information to understand the main variables that explained soybean yields in Pennsylvania. The more comprehensive soil analyzes (Cornell soil health test, water holding capacity and infiltration) were only performed during the 2017 season.
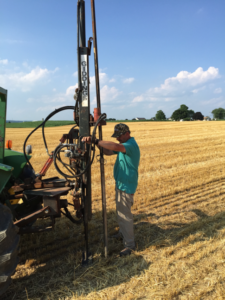
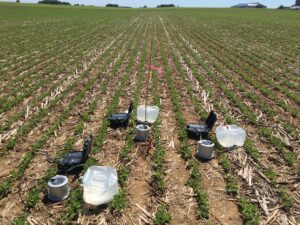
The soil samples were collected using a 2-inches hydraulic Giddings probe until a maximum depth of 48 inches. Soil and root depth were estimated using these samples. Each soil sample was divided in homogeneous layers following the 0, 6, 15, 30, 60, 90, 120 cm pattern to study the soil profile fertility and to parameterize the crop simulation model Cycles. Infiltration was measured with an automated infiltrometer developed by METER, called SATURO, which reports the field saturated hydraulic conductivity (Ksat) using two pressure heads and a single 6-inches diameter ring. The Cornell soil health analysis was done in 13 fields following the Cornell guidelines, combining the soil samples per field to a depth of 6 inches. Climate data was obtained from the North American Land Data Assimilation System. Soybean yield was estimated by cutting 3 m of plants in each sampling unit (five per field). Yields were converted to 13% grain moisture. We avoided areas that showed symptoms of diseases or pests to reduce bias. The data was analyzed using regression and principal component analysis on SAS, and with the random forest package on R.
The cropping systems’ simulation model Cycles is a process-based, multi-year, multi-crop, and multi-soil layer simulation model that runs at a daily time step, with hydrology simulated with an adaptive sub-daily time step. Earlier tests of CropSyst (Stöckle et al. 2003) and C-Farm (Kemanian and Stöckle 2010) are applicable to Cycles as they share several modules. The fundamental heat and water transport algorithms are adapted from Campbell (1985). Cycles has modules to represent plant growth based on radiation and transpiration use efficiency (Stöckle et al., 2008), coupled Cs and N cycling (Kemanian et al. 2005; Kemanian and Stöckle 2010; White et al. 2014), soil water infiltration and redistribution, and the effect of management practices on biogeochemical processes. Cycles can simulate monoculture rotations, polycultures and relay crops. The inputs required to run Cycles are: i) latitude, elevation, and daily weather data, ii) layer-by-layer initial soil profile properties (layer thickness, texture, bulk density, hydraulic properties, organic matter), iii) crop sequence, and iv) management operations (fertilization, irrigation, residue addition, tillage, harvest). The soil, plant and climate data collected in this project was used to validate the model soybean yield predictions. We are using the Root Mean Square Error (RMSE), coefficient of determination (R2), and the comparison to a 1:1 line to validate the simulations. The activities 2 and 3 are delayed because we did not anticipate the long duration to process approximately 300 soil samples collected in 2017 in regards of particles size analysis (which is critical for modelling), and other issues regarding laboratory instrumentation to analyze water holding capacity of the soil samples. We are still working on the modeling activities, and this reported will be updated as soon as we have the results.
We are currently evaluating the long-term effects of soil health management practices, such as no-till, cover crop use and organic fertilization, on soil health indicators and soybean productivity by comparing soil data from farms with a history of soil health management against traditional crop management systems. It is expected that the higher the use of soil health management systems, the higher the soil health and, therefore, the higher the plant productivity. For this activity, we intend to use the model 30-year soybean yield predictions to compare the long-term effects of soil health indicators without the temporal yield variation effect caused by weather. CYCLES will also be used to evaluate long-term carbon balances and nitrogen fluxes for each field. The model provides daily outputs, which can be aggregated to reflect seasonal or annual patterns of interest.

In 2016, due to a greater variability of planting dates and precipitation regimes, soybean yields varied from 20 to 75 bu/ac. In 2017, water stress was not a problem in most fields. In Lebanon, the simulation model Cycles predicted no water stress in the fields studied. Nonetheless, soybean yields varied considerably among fields in 2017 – from 21 to 129 bu/acre. As expected, highest yields occurred in Lebanon County. The average yields in Lebanon and Centre county were 96 and 59 bu/ac, respectively.
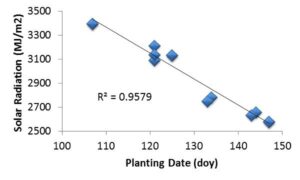
When all variables investigated were considered in the analysis, the best soybean yield predictor for the region and years studied was planting date. A simple linear regression using data from 21 fields and 18 planting dates from 2016 and 2017 growing seasons showed that planting date (x = day of year) explained 70% of the soybean yield (y) variation in the region. The regression model showed that soybean yields were reduced by approximately 0.75 bu/ac per day (y = -0.75 x + 179) of planting delay. This negative relationship of soybean yield to planting date can be explained based on the basic soybean development characteristic. Since soybean development is driven by an interaction of temperature and photoperiod, later plantings will accelerate plant development because of the warmer temperatures and shorter daylengths, and therefore can cause lower solar radiation accumulation during the reproductive stages which lower the soybean yield potential. Since there were many predictor variables that were correlated to each other in this study, we used principal component analysis to help identify groups of variables that were related to soybean yield. Using this approach, we found that planting date, phosphorous, potassium, zinc, and soil depth were the main soybean yield predictors (R2=0.79). We can interpret the soybean yield response to planting date and soil nutrients as the “Lebanon factor”. That is the effect of earlier planting that is possible due to warmer temperatures in the region, associated with the greater use of manure due to the high availability and low cost in Lebanon county. Moreover, we can argue that soil depth would have had a greater importance in yields if drought would have happened for instance.
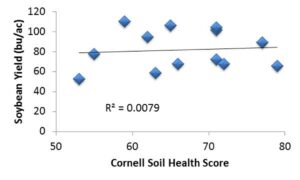
Our revealed that the physical, biological, and chemical soil indicators tested in the comprehensive assessment of soil health done by the Cornell laboratory did not significantly correlate to soybean yields in the 13 fields studied during the 2017 growing season. The regression of the overall quality score indicated no relationship with soybean yields (R2=0.008). For instance, aggregate stability was rated 17 out of 100 in a field from Lebanon by the Cornell scoring system with indications of constraints such as aeration, infiltration, rooting, crusting, sealing, erosion, runoff. However, the very same field with low aggregate stability had the 4th greatest yield (102 bu/ac), the 3rd highest Ksat (11 inches/hour), and the 4th greatest rooting depth (35 inches) from all fields studied.
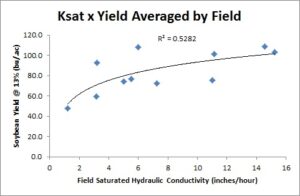
The principal component analysis of the soil health data (including Ksat, root depth, and rock mass and volume) indicated that the main predictors of soybean yield were Ksat and root depth. Saturated hydraulic conductivity explained 53% of the soybean yield variability; it varied from 1.2 to 15.2 in/hour. Somewhat surprisingly, soil texture did not influence Ksat. All measurements were done within a one-month period in Spring of 2017, and since we are measuring the hydraulic conductivity after saturating the soil we do not expect soil moisture to be factor influencing the results. The fields with the highest Ksat frequently showed signs of earthworm activity, whereas the fields with the lowest Ksat were compacted or surface-crusted soils. Our data suggests that macropore flow was a main component of the field Ksat variability, and both and indicator and cause of high soil quality and high yield. Additionally, root depth and Ksat were related (R2=0.47), and root depth also explained a big portion of the soybean yield variability (R2=0.54).
The simulations done so far are showing that Cycles can adequately predict soybean yields when the phenology crop parameter is correctly calibrated. In 2016, the averages of the observed and simulated yields were 45 and 46 bu/ac (y = 0.6x + 19, R2 = 0.95, and RMSE = 4 bu/ac). In 2017, the averages of the observed and simulated yields were 82 and 79 bu/ac (y = 0.46x + 41, R2 = 0.76, and RMSE = 14). We noticed that the model was underpredicting the high soybean yields, and therefore we used the data collected (light interception, root depth, biomass and grain yield) to parameterize physiological and morphological attributes of soybean that are represented via parameters such as radiation use efficiency, maximum harvest index and others. Based on the validation results and the data collected, we calibrated the following parameters to improve yield predictions: increased maximum harvest index (from 0.4 to 0.485), increased the threshold for cold damage (from 0 to 3˚C), adjusted maximum root depth for each environment, and adjusted curve number parameter when infiltration data was available. The comparison of observed and simulated yields of the 2 parameterized versions, before (V1) and after (V2) calibration, is presented in Fig. 1. Even though the RMSE increased from 10 to 14 bu/ac and the R2 decreased from 0.86 to 0.84, the slope of the simulated vs observed yields improved from 0.59 to 0.91. Since the model does not capture biotic stresses such as diseases, pests, weeds, and abiotic stresses such nutrient deficiencies (except for nitrogen), the higher simulated yields associated with the slope closer to 1 indicate the soybean responses to the environment are properly simulated.
We are still working with the collected field data to understand if the model is correctly picking up the yield responses to the best predictors that we observed in the fields. The final modelling step is to evaluate the long-term effect of soil health management practices, such as no-till, cover crop, organic fertilization on soil health indicators and soybean yield.


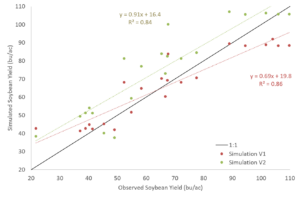
Observed versus simulated soybean yields from 2016 to 2017 before (V1) and after (V2) model calibration.
1) Planting date is a key management factor for high yielding soybean in PA;
2) The environmental factor is a big component of the soybean yield responses to management;
3) Current soil health metrics did not translate into soybean yields in this research;
3) Infiltration is a promising method to assess soil health in the region.
Education & outreach activities and participation summary
Participation summary:
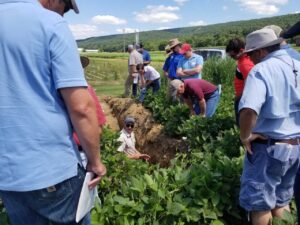
The findings on this research was shared in field days, technical meetings, diagnostic clinics, and social media. Here is a list of events where the results of this project were shared with growers and agronomists of PA:
- Centre County:
- Penn State Diagnostic Clinic on July 19 and 20th 2017
- Penn State Diagnostic Clinic on July 18 and 19th 2018
- Lebanon County:
- Field day at Glenn Krall farm on August 23rd 2017
- Talk at the Keystone Crops and Soils Conference on October 25th 2017
- Talk at Darren Grumbine farm on August 20th 2018
- Bradford County:
- Field day at Matthew Ahern farm - August 24th 2017
The next events we will give talks to share the results of this project are the Keystone Crops and Soils Conference (10/23/2018 – Lebanon, CO), and the ASA/CSSA International Conference (11/6/2018 in Balimore, MD). Our goal is to send a journal article by early 2019.
2017 and 2018 Handouts of the Diagnostic Clinic:
Understanding-Plant-and-Soil-Factors-that-Drive-Soybean-Growth-and-Yield
Soybean-Management-and-Soil-Quality-for-High-Yields
2017 and 2018 Keystone Soils and Crops Conference Presentations
Project Outcomes
This project helped to improve the knowledge of sustainable agriculture in the region. Specifically, by introducing to farmers some of the concepts of soil management to promote improved physical properties. Also, our interaction with the project farmers led them to participate in a tour to Brazil that was organized by us, which resulted in several newspaper articles. Another important outcome was the introduction of the crop and soil modeling concept to farmers, which can help them to accept the model when it becomes commercialized. This will help farmers understand the long-term impacts of sustainable soil management.
This project expanded the knowledge of "on-farm" research with a successful methodological strategy to explore local field variability to understand soybean responses that can be translated to better agronomic management, which would be harder and more expensive to do in traditional experimental design with forced treatments, for example. We also expanded our knowledge in advanced statistical modeling, crop model management and development, soil sampling and soil physical property analysis. Also, it is clear that "on-farm" experiments are favorable for the training of students because of the interaction with growers and agronomists that are more connected to market realities, which often is not offered in traditional academic projects. Finally, this project was an important training in project management and budgeting.