Final report for ONE16-265
Project Information
CitySeed stays abreast of best practices and uses innovative models to ensure a healthy and economically viable marketplace for our farmers. However, farmers report having a difficult time in selling produce that is abundantly available and selling more in previous years at our farmers markets. Our original purpose for undertaking this project, then, was to attempt to overcome this difficulty by focusing a creative and engaging marketing lens on farm produce and measuring the results.
Over the course of 2016, CitySeed: 1) reached out to farmers to identify fruit and vegetables to promote during the market season; 2) planned and hosted seven major scale events and two smaller events that were designed to promote the selected fruits and vegetables; 3) recorded market statistics for the days on which these major events were held and surveyed customers to understand any links between the events and market attendance ; and 4) polled participating farmers after the events to assess their impact on market sales.
The top five activities that our customers were interested in were based on our social media polling was, at 32%, product samplings and tastings, at 27%, special guest vendors, food trucks and carts, at 12% recipes from farmers, chefs and staff, 10%, kid’s cooking or general activities and finally at 10% themed market days.
We found that hosting events at our markets, coupled with themed months and heavy social media marketing worked to increase market attendance and engagement at our markets. We saw overall market counts up by 36% as a result of events and the associated marketing. Major events that incorporated tastings, cooking demos and increased activities did not necessarily translate into more sales for farmers. Despite an increase in market attendance, our data indicated that the boost in attendance did not translate into increased fruit and vegetable sales.
Special events raise awareness of markets and it is possible that this has an impact on new and repeat customers. New customers at the market is vital to the overall health of our farmers’ markets and we believe that these events coupled with other sales/marketing strategies should be implemented to maintain and increase market financial health.
Introduction:
CitySeed uses our past events and experience as well as current market research and best practices from across the country in determining how to move farmers forward at our markets. In the past we have held sampling, cooking demos and large scale events at our market without using a rubric to determine impact on farmers and purchases of products, yet we know that they increase customers at markets We know that cooking demonstrations and large scale and targeted tastings of farm products are popular and take approximately 6-8 hours of staff time to execute. The one large scale event we have done at the market, our Farm to Table Cook Off 2012, took approximately 15 -20 hours of staff time to execute and brought an extra 200 people to our market that day. We recently held a small heirloom tomato tasting event and at least one farmer stated that tomato sales went up that day.
We would like to be more scientific in our approach in terms of surveying and have targeted signage at the time of the event as well as pre-event marketing tools that steer customers towards buying a farm product that farmers want to sell more. While current news indicates that farmers market sales are peaking, current farmers market best practices indicate that we should be including a variety of culinary events at our markets to help farm sales. In fact, food businesses in general show that in-store sampling improves sales the day of the sampling event, but also increases sales of products and line extensions for many weeks following (http://www.businesswire.com/news/home/20090803005049/en/Groundbreaking-Study-Redefines-In-Store-Sampling-Impact-Usage#.Vgw4Y99VhBc) . While this article does not pertain to farmers’ markets it shows the significant impacts sampling can have in the retail industry. Data in article taken from a 2011 Regional Farm Market Sampling Survey conducted by the University of Kentucky across 8 states indicated that sampling was shown to have an immediate purchasing impact at the farmers market. Of respondents clearly recalling a farmers market sampling event, 55% purchased the sampled product that day when they hadn’t planned to. Another 17% of respondents that did not buy that day planned to buy the product in the future. Visitors noted that sampling significantly impacted their purchasing from the vendor (45%), recommending the product to a friend (38%), recommending the vendor to a friend (34%), and purchasing other products from the vendor (20%).
"Boosting Sales through Culinary Events and Marketing" aimed to find the “sweet spot” of marketing and engagement activities, in order to demonstrate that certain events can have an impact on both farmers’ sales and overall attendance at our markets. We sought to accomplish this through highlighting specific fruits and vegetables identified by market farmers and highlighting those crops in marketing themes, market events, cooking demos and tastings.
Cooperators
Research
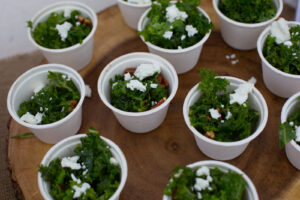
Prior to the start of the season, CitySeed polled farmers online using Survey Monkey to identify fruit and vegetables to promote throughout the 2016 market season. As a result of this survey, accessible here, a series of large and small-scale events were planned that promoted the identified crops and project partners or participants were identified. Large-scale events were planned in the beginning and end of the season when our markets generally see a decline in customers and product. Last spring, our major events focused primarily on Salad Greens and Strawberries and in the fall, on Apples and Squash. Other vegetables and fruit promoted in conjunction with these events over social media and with point-of-purchase market signage were: Arugula, Carrots, Garlic, Greens, Herbs, Lettuce, Kale Spinach, Sprouts, Pears, Turnips, Sweet potato, Winter Squash, Cucumbers, Herbs, Swiss Chard, Sugar Snap Peas, Summer Squash, Zucchini and Beets. Because our main objective was to increase sales of produce at our market, we saw no reason to exclude any of the vegetables or fruit identified in our pre-season surveys.
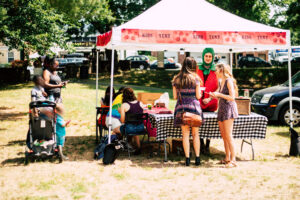
Ultimately, CitySeed hosted seven large scale events in 2016 at our larger market locations in Wooster Square and Edgewood Park. We held two additional events in Fair Haven and Downtown, two of our smaller market locations. Major events were defined as pre-publicized events that always incorporated increased signage promoting in-season highlighted crops, included at least one sampling or cooking demo and incorporated at least two other event components - such as a highlighted crop themed kids activity, guest vendors with specialty products that incorporated highlighted crops, crop information/identification table, or live music. Point-of-purchase signs identified highlighted crops, suggested pairings with highlighted produce that included other farmers market offerings, and highlighted crop focused recipes. In addition we also had signage for sampling crops and cooking demonstrations. In addition to the eight major events, CitySeed also partnered with the Hispanic Health Council to have regular cooking demos at our Fair Haven Market. Eight demos were conducted and incorporated pre-survey identified produce. These demos occurred on August 11th, 18th, 25th; September 1st, 8th, 15th, 22nd and on October 13th of 2016. Two additional cooking demos were conducted at our Winter Market by our partners Small Kitchen Big Taste in February and March of 2017.
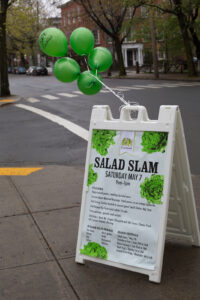
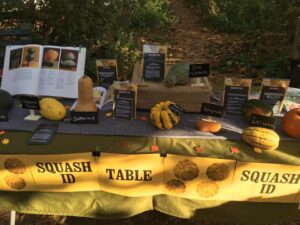
Examples of Signage:

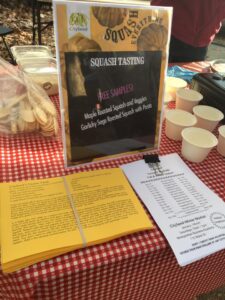
Photos of event activities:


Post event surveys were given to our vegetable farmers and identified project partners after each major event. Sales data for the week prior and the week of the event was requested in the survey along with information related to any noticeable increased customer inquiry related to promoted produce and sales of specific crops. Mid-year surveys were conducted over social media to poll our customer base about our events. Dot-surveys were conducted to gauge the reasoning for customer attendance and measure engagement with highlighted crops as a result of the events. Dot surveys are proven to be a quick, effective and engaging surveying method specifically for farmers markets and address some of the cultural and physical barriers presented there- heavy sun, customers only wanting to shop. Our dot-surveys asked a limited amount of questions and participants were instructed to answer by placing a sticker on a poster in a section that corresponded with their answer. CitySeed has has had success in the past utilizing this method to gather information and input from market customers which is why we chose this method to poll customers for the purpose of this grant.
CitySeed used our weekly e-newsletter and social media outlets to promote ID’ed crops throughout the market season. To maximize our marketing efforts these posts were boosted on a regular basis. We also used our major events and the related crop as the theme for the months the events where hosted. Market calendars were created to highlight major events and distributed throughout the season. Specific event flyers with ID’ed crop images and graphics were used on digital marketing outlets as well as in flyer for at the markets throughout the season.
There were a variety of surveys that were conducted through the course of this project to evaluate the impact of hosting themed events. Social Media surveys pushed out to CitySeed's facebook followers help tailor our events. Vendor surveys captured information about perceived attendance, customer engagement, sales on certain products and concrete data on overall sales. Dot-surveys were conducted at major events and helped us determine if our events helped draw customers to the market. Dot-surveys were only conducted during major events and not for small scale events like demos to alleviate survey fatigue during the spring/summer/fall market season. We did however conduct two dot-surveys during our Winter Market to assess the success of cooking demos and their impact on attendance and purchasing behavior. These surveys are available here.
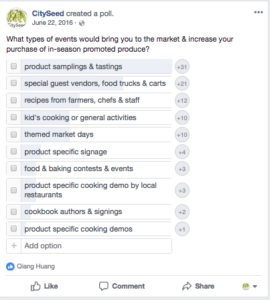
The top five activities that our customers were interested in were based on our social media polling was, at 32%, product samplings and tastings, at 27%, special guest vendors, food trucks and carts, at 12% recipes from farmers, chefs and staff, 10%, kid's cooking or general activities and finally at 10% themed market days.
The clearest result of this project is that major crop-themed events - such as the Strawberry, Apple, and Squash Events held at our markets at Wooster Square and Edgewood Park - lead to significant increases in market attendance. On average, the events brought in 561 new customers to the market compared to the same market dates the previous year - an increase of 178%. And compared to markets held the week before, each event brought an average of 240 additional customers, or an increase of 36%. We should also note that this may be skewed slightly lower due to the fact that the Squash Fest at Edgewood Park occurred one week after the annual Westville Puppet Parade, an event that brings crowds of new customers to the market. It would, then - as one farmer remarked - “unfair to compare Squash Fest at Edgewood with the week before.... so, even though we didn't strictly make more money, I firmly believe that there were more people there at Squash Fest than there would have been without Squash Fest.” Discounting the Squash Fest at Edgewood Park, then, each market on average brought an additional 331 customers to the market compared to the previous week, for an increase of 47%. Vendors, too, certainly noticed these significant increases in market attendance. At the Strawberry Fest at Edgewood Park, for example, vendors reported that market counts were at the highest levels that they had ever seen.
| Event | Customer Count | 2015 Count & Comparison | Comparison previous week |
Notes |
| Strawberry Days 6/24/16 |
1158 | 782 customers Up by 376 or 48% |
759 customers Up by 399 or 52% |
Farmers commented - definitely more people at the market, definitely will be more people for 4th of july (always is), not sure if it helped sales, they didn't see as many regulars, but saw new people; Folks really liked the fest and said we did a wonderful job over instagram and at market. Farmers questioned when the next one will be and why we don't do it every week. |
| Strawberry Days 6/25/16 |
1293 |
279 customers, up 1014 or 363% |
426 customers, up 867 or 203% | Farmers Commented: most people ever brought to this market - ever. Lots of kids and families chatting |
| Apple Day 10/1/16 |
962 | 415 customers, up 547 or 132% |
939 customers, up 23 or 2% |
Even though we found not a huge jump in attendance from the week before, we found that the event still had influenced a large sample of people, 28 people out of 91 surveyed, to come to the market. See customer dot survey. |
| Apple Day 10/2/16 |
1033 | 555 customers, up 478 or 86% |
743 customers 290 or 39% |
|
| Apple Day 10/12/16 |
223 | 161 customers, up 62 or 38% |
233 customers, down 10 or -4% |
|
| Apple Day 10/13/16 |
152 | 100 customers, up 52 or 52% |
188 customers, down 36 or -19% |
|
| Squash Everything 11/5/16 |
934 | 592 Customers, up 342 or 58% |
764 Customers, Up 170 or 22% |
There was positive feedback from customers at kids table, squash ID table, and tasting station. Questions on if squash that was being tasted was for sale and we directed them to the farmers. Great engagement and questions at both ID and tasting station- great education opportunity. Customer dot-surveys indicated that although only 10 out of 50 people surveyed came to the market because of the event 14 people planned on buying winter squash as a result of the tasting and ID table activities. See customer dot survey. |
| Squash Everything 11/6/16 |
931 | 538 customers up 393 or 73% |
1126 Customers, |
Interestingly, the same event put on at Edgewood did not have as great as an influence on people’s purchasing habits. Only 4 out of the 41 people surveyed indicated they would purchase Winter Squash as a result of the event. |
It is clear, too, that these events were brought new customers to CitySeed farmers’ markets: on average, 32% of people surveyed were first time visitors and on average 40% of those surveyed indicated that the major events held at the markets influenced their decision to come to the market that day and that many of those surveyed planned to buy highlighted crops as a result of the event. The following is an summary of our customer dot-survey results given at the market by CitySeed volunteers on special event days:
Strawberry Days - Wooster Square - 6/25/16
Link to survey results
55 surveyed
35 out of 55 people surveyed were visiting the market for the first time;
33 said that the strawberry event influenced their decision to come
Customers indicated 28 times that they purchased or planned on purchasing highlighted crops as a result of the event.
Strawberry Days - Edgewood Park - 6/26/16
Link to survey results
37 people surveyed
14 out of 37 people surveyed were visiting the market for the first time
20 said that the strawberry event influenced their decision to come
Customers indicated 18 times that they purchased or planned on purchasing highlighted crops as a result of the event.
Apple Days - Wooster Square - 10/1/16
Link to Survey results
91 people surveyed
18 out of 91 people surveyed were visiting the market for the first time
28 said that the Apple event influenced their decision to come
Customers indicated 61 times that they purchased or planned on purchasing highlighted crops as a result of the event.
Apple Days - Edgewood Park - 10/2/16
Link to Survey results
35 people surveyed
7 out of 35 people surveyed were visiting the market for the first time
18 said that the Apple event influenced their decision to come
Customers indicated 14 times that they purchased or planned on purchasing highlighted crops as a result of the event.
Apple Days - Downtown Market - 10/12/16
Link to Survey results
26 people surveyed
9 out of 26 people surveyed were visiting the market for the first time
8 said that the Apple event influenced their decision to come
Customers indicated 10 times that they purchased or planned on purchasing highlighted crops as a result of the event.
Apple Days - Fair Haven Market - 10/13/16
n/a
Because of low market attendance, language barriers and not having a dedicated volunteer to administer the dot-survey, market customers did not participate in the survey that was available on Apple Day at the Fair Haven Market.
Squash Everything - Wooster Square - 11/5/16
Link to Survey results
53 people surveyed
19 out of 53 people surveyed were visiting the market for the first time
10 people said that Squash Everything influenced their decision to come
Customers indicated 37 times that the purchased or planned on purchasing highlighted crops as a result of the event.
Squash Everything - Edgewood Park - 11/6/16
Link to Survey results
41 people surveyed
12 out of 41 people surveyed were visiting the market for the first time
9 people said that Squash Everything influenced their decision to come
Customers indicated 10 times that the purchased or planned on purchasing highlighted crops as a result of the event.
Unfortunately, according to data from post-event surveys, these events did not significantly contribute to increased vendor sales at the markets. Overwhelmingly farmers reported that sales of the promoted fruit or vegetable did not increase, compared to both sales from the previous week and from the previous year. Sales of other products on the days of the events seem to have been similarly unaffected.
The timing of events may have had an impact on the lack of increased vendor sales. As two farmers noted in the post-Strawberry Event survey, the events would have ideally been scheduled two weeks earlier - in early-mid rather than late June - when the fruit was at peak production. Farmers had “far fewer berries and less product to bring to market overall” on event days and suggested that this may account “for the dip in overall sales.”
Each event however impacted sales differently. Although the Strawberry event translated into increased sales for farmers, neither the Apple event or the Squash everything event saw an increase in reported revenue. In fact, overarchingly farmers reported a decline in revenue on the days themed events were hosted in the fall. Below is the breakdown of revenue that was reported. Also for reference is list of our total produce vendors by market (at the height of the season):
Wooster Square: 12
Edgewood Park: 5
Downtown: 3
Fair Haven: 2
| 6/24 Strawberry Event Wooster Sq. |
Prior Wks Reported Sales 6/18/16 |
Event Day Reported Sales 6/24/16 |
Difference and percent change |
| Farm 1 | $485 | $946 | $461, +95% |
| Farm 2 | $885 | $828 | -$57, -7% |
| Farm 3 | $450 | $400 | -$50,-11% |
| Farm 4 | $593 | $736 | +$143, +24% |
| Farm 5 | $527 | $356 | -$121, -32% |
| Farm 6 | $300 | $300 | $0, 0% |
| Total | $3240 | $3566 | +$326, +10% |
| 6/25 Strawberry Event Edgewood Park |
Prior Wks Reported Sales 6/19/16 |
Event Day Reported Sales 6/25/16 |
Difference and percent change |
| Farm 1 | $298 | $300 | +$2, +.5% |
| Farm 2 | $700 | $890 | +$190, +27% |
| Farm 3 | $225 | $307 | +$82, +36% |
| Total | $1,223 | $1,497 | $247, +22% |
The Strawberry events saw varied farmer sales although some saw an increase in income, others reported a loss. Overall, markets saw an increase in sales by 10% on the 24th and 22% on the 25th. On average farmers who completed the post event survey saw an increase of $62 in sales as a result of the Strawberry Events.
Survey Data link below:
June 24th and 25th Post-Event Survey Results
| 10/1 Apple Event Wooster Square |
Prior Wks Reported Sales 9/24/16 |
Event Day Reported Sales 10/1/16 |
Difference and percent change |
| Farm 1 | $681 | $1053 | +$375, +54% |
| Farm 2 | $1450 | $1100 | -$350, -24% |
| Farm 3 | $480 | $500 | +$20, +5% |
| Farm 4 | $750 | $750 | $0, 0% |
| Farm 5 | $681 | $410 | -$271, -40% |
| Farm 6 | $1000 | $1100 | +$100, +10% |
| Farm 7 | $1799 | $1743 | -$56, -3% |
| Total | $6,841 | $6,656 | -$185, -3% |
| 10/2 Apple Event Edgewood Park |
Prior Wks Reported Sales 9/25/16 |
Event Day Reported Sales 10/2/16 |
Difference and percent change |
| Farm 1 | $969 | $800 | -$169, -17% |
| Farm 2 | $315 | $375 | +$60, +19% |
| Farm 3 | $1134 | $1256 | +$122, +11% |
| Total | $2418 | $2,431 | +$13, +.5% |
| 10/12 Apple Event Downtown |
Prior Wks Reported Sales 10/5/16 |
Event Day Reported Sales 10/12/16 |
Difference and percent change |
| Farm 1 | $475 | $445 | -$30, -6% |
| Farm 2 | $440 | $424 | -$16, -3% |
| Total | $915 | $869 | -$46, -5% |
| 10/13 Apple Event Fair Haven |
Prior Wks Reported Sales 10/6/16 |
Event Day Reported Sales 10/13/16 |
Difference and percent change |
| Farm 1 | 1378 | 1341 | -$37, -3% |
| Total | 1378 | 1341 | -$37, -3% |
The Apple Events did not translate into increased market sales for vendors. Vendors did however report customer enthusiasm that resulted in new and deeper relationships with market customers. Typically our markets see steady decrease in sales starting in the fall. Also, only 2 out of the 13 farms that responded reported higher sales this year compared to the same time the year before.
Survey Data links below:
October 1st and 2nd Post-Event Survey Results
October 12th and 13th Post-Event Survey Results
| 11/5 Squash Everything Wooster Sq. |
Prior Wks Reported Sales 10/29/16 |
Event Day Reported Sales 11/5/16 |
Difference and percent change |
| Farm 1 | $1611 | $761 | -$850, -52% |
| Farm 2 | $940 | $930 | -$10, -1% |
| Farm 3 | $774 | $443 | -$331, -43% |
| Farm 4 | $1700 | $900 | -$800, -47% |
| Farm 5 | $600 | $580 | -$20, -3% |
| Total | $5,625 | $3,614 | -$2,011, -35% |
| 11/6 Squash Everything Edgewood Park |
Prior Wks Reported Sales 10/30/16 |
Event Day Reported Sales 11/6/16 |
Difference and percent change |
| Farm 1 | 1164 | 600 | -$564, -48% |
| Farm 2 | 1346 | 1139 | -$207, -15% |
| Total | 2510 | 1739 | -$771, -31% |
The Squash Everything events did not translate into increased sales for vendors. We do not believe that the event was responsible for the decrease in sales, rather a steady decline in attendance and sales is typically. As noted earlier, the week prior at the Edgewood Market was the Puppet Parade, an event that draws hundreds more people to the markets and is annually one of our most highly attended market days.
Survey Data link below:
November 5th and 6th Post-Event Survey Results
Even though events did not directly lead to boosted sales for vendors at the markets, they may have indirectly done so. On average across the events, 40% of farmers reported seeing increased customer engagement at their stands - more conversations about the promoted product, questions about ways to use the product, and - as one farmer concluded - “new and deeper relationships” with market customers. It is our hope that these conversations and relationship will lead to higher rates of customer retention at the markets.
2016 was the first year in which end of the year financial data was collected from farmers attending our markets and collected again in 2017, a year in which we did not run any major events or themed market days. For the purposes of this report we only included data from produce farmers who provided us with 2 data points. Below is a comparison summary of 2016 & 2017 sales by market.
Wooster Square: up $63,000 from 2016
Edgewood Park: down $10,800 from 2016
Downtown Market: up $764 from 2016
Fair Haven: n/a
Given the varying results, we are unable to find evidence that running special events leads to increased sales at the market. We do believe that these events helps maintain a healthy marketplace and assists in building and maintaining a loyal, informed and engaged customer base and introduces new customers to the market. These benefits should not be undervalued. In 2018, equipped with this analysis and understanding the high input required to host large scale events, we plan on hosting both Strawberry Days and Apple Days at two of our markets.
Our objective was to pin point events and marketing strategies that work to help sell more produce for farmers AND demonstrate to what degree they are working for our farmers. It was our goal to find the “sweet spot” of marketing and engagement activities and demonstrate that it has an impact on farmers’ sales at our markets.
We found that hosting events at our markets, coupled with themed months and heavy social media marketing worked to increase market attendance and engagement at our markets. We saw overall market counts up by 36% as a result of events and the associated marketing. Despite an increase in market attendance, our data indicated that the boost in attendance did not translate into increased fruit and vegetable sales.
Education & outreach activities and participation summary
Participation summary:
CitySeed conducted 9 major events and 10 cooking demos over the course of 2016. Major events were defined as pre-publicized events that always incorporated increased signage promoting in-season highlighted crops, included at least one sampling or cooking demo and incorporated at least two other event components – such as a highlighted crop themed kids activity, guest vendors with specialty products that incorporated highlighted crops, crop information/identification table, or live music. Point-of-purchase signs identified highlighted crops, suggested pairings with highlighted produce that included other farmers market offerings, and highlighted crop focused recipes. In addition we also had signage for sampling crops and cooking demonstrations.
Cooking demos were conducted by partner organizations such as the Hispanic Health Council and Small Kitchen Big Taste. All cooking demos had a representative at a table preparing a dish, there to help sample dish, answer questions and provide a recipe for customers to take home.
A summary of the results of this project were shared on the CitySeed website, Connecticut Farmers' Market Managers social media group, with the Growing for Market newsletter, a regional newsletter, and on the Connecticut Food System Alliance listserv. This listserv is one of the most utilized listservs for farms, farmers markets, non-profits and individuals in the state who work to improve our food system.
Learning Outcomes
Had increased awareness of strategies that brought more customers to farmers markets.
Project Outcomes
CitySeed set out to pin point marketing strategies that work. Although our efforts did not translate into, at least in year one, an increase in produce sales, we did achieve higher levels in attendance at our markets. Further research should be conducted to test what other strategies, such as loyalty programs, would then translate into a boost in produce sales.
In the future, instead of following a certain type of event through the entirety of a season to survey customers, we would suggest picking a smaller time frame let's say a month and a reasonable amount of surveys, to measure a particular strategy and it's impact. In this study, we focused on surveying during large scale events that incorporated all activity types through an entire season.
We found that measuring sales of certain products at farmers markets is challenging - each farm has different accounting methods and collecting data from farmers who are already stretched can be difficult which is why we asked farms for overall market sales for the days in which special events were held.
Special events raise awareness of markets and it is possible that this has an impact on new and repeat customers. New customers at the market is vital to the overall health of our farmers' markets and we believe that these events coupled with other sales/marketing strategies should be implemented to maintain and increase market financial health.
In the future we will do a end of the year customer survey rating the year's events. CitySeed will continue to do special events but fewer per year in efforts to continue to engage our customers with farmers around certain products and attract new customers to our markets.
Other farmers markets would benefit from having access to the results of this study.