Final report for ONE21-402
Project Information
Ammonia volatilization from manure is a major source of nitrogen pollution in the environment, and also reduces the fertilizer value of manure on the farm. Conventional methods of acidification are effective in mitigating ammonia emissions but involve the use of concentrated inorganic acids, which can be hazardous to handle and expensive. We studied an innovative approach to reducing ammonia emissions: bioacidification via fermentation. This method introduces carbon-rich waste materials into liquid manures, initiating a fermentation process that generates organic acids. This, in turn, lowers manure pH and mitigates ammonia loss. In this project, we fermented liquid dairy manure, digestate, and pasteurized human urine collected through our Urine Nutrient Reclamation Program.
6.25% and 12.5% additions of acid whey (62.5 and 125 gallons of whey per 1000 gallons of manure) provided the most benefit per unit of additive used. These relatively low addition rates are also desirable to farmers, who emphasized the need to minimize the addition of extra volume to their manure storage systems. These two facts suggest that low rates of acid whey addition may be the most cost-effective and practical way to implement bioacidification on dairy farms. That said, paper fibers and sweet whey also were effective and, depending on cost and availability, could be more cost-effective in some settings.
There was strong farmer interest in bioacidification, with some farmers interested in trying it on an experimental basis with whey even before further study. The lab testing suggested that under the right conditions, bioacidification could have a large impact on reducing ammonia volatilization. Taken together, the laboratory results and farmer viewpoints build a strong case for further investigation of this approach.
We performed: two case studies assessing on-farm feasibility with farmer-partners and advisors; multiple lab trials testing recipes using three waste materials: acid whey, sweet whey, and short paper fibers (pulp sludge); and interviews with six farmers. We presented our findings during one internally hosted webinar (with 17 registered participants) as well as at the Rich Earth Summit on Urine Reclamation (with 52 in-person and 203 virtual registered participants), both of which were recorded and made publicly available on YouTube.
Project Objectives:
This project is assessing whether bio-acidification of dairy manure, digestate, and urine substrates is a potentially feasible method for reducing ammonia emissions on Northeast farms. If successful, the method could generate increased farm revenue through whey or short paper fiber disposal fees, as well as reduced fertilizer purchases and/or higher yields from retained N in each substrate.
We are addressing the following questions:
Lab research questions:
- Does the addition of whey and/or paper fibers induce fermentation in liquid dairy manure, digestate, and/or human urine?
- What pH changes are achieved by different volume ratios?
- Is there any benefit from adding starter cultures?
- How long do the pH changes of different mixtures last at different temperatures?
- Does bio-acidification reduce ammonia volatilization when manure, digestate, or urine are applied to soil?
Farmer research questions:
- What challenges do farmers have managing ammonia loss from manure? How feasible would bio-acidification be on farms with liquid manure?
- We will interview 10-15 farmers managing liquid manure to understand their concerns around manure N content and loss, and manure storage / management capacity
- Using lab trial results, we will conduct a detailed analysis with two farmer-partners of whether and how bio-acidification could be added to their operations, and additional research needs.
Ammonia volatilization from manure is a significant source of environmental N pollution and an economic loss for farms. UVM Extension Nutrient Management Specialist Laura Johnson has found that farmers in the Northeast are concerned with ammonia loss, both from the perspective of neighborly relationships (i.e. reducing odor), and reducing fertilizer costs (PC, 10/14/20). According to the Vermont Agency of Agriculture, this is a key issue for the farmers they work with because fertilizer is one of their biggest farm expenses (PC, 10/19/20). A common issue noted in previous farmer interviews conducted by Rich Earth was expressed by long-time Vermont dairy farmer Peter Miller, whose several hundred cows do not produce sufficient manure to fertilize his 700 acres (Noe-Hays, 2020). Retaining the N in that manure could significantly reduce his overall costs.
In Europe, acidification of liquid manure is used to reduce ammonia emissions; however, this requires hazardous concentrated inorganic acids, limiting wider-scale adoption. An alternative is to acidify slurry using fermentation by adding high-carbon waste material to liquid manure stores. In addition to reducing N pollution and purchased inputs, this may indirectly help reduce P overapplication and runoff, if manure is used to meet crop N demand. These benefits could potentially be achieved for lower cost than other ammonia retention methods like injection equipment, tank covers, or biochar. Additionally, with adequate pH reduction, bio-acidification likely prevents methane generation in slurry stores, reducing greenhouse gas impact. This method could benefit any farmer using liquid manure, digestate, and/or urine fertilizers.
Using data from USDA (2020) and EPA (2020), we estimate that there are approximately 8,000 liquid dairy and swine manure storage facilities in the Northeast (including tanks, lagoons, and pits). These are primarily located in New York and Pennsylvania, with several hundred in Vermont.
Whey and short paper fibers are two waste products that are produced in large quantities in the Northeast and present disposal challenges to the dairy and paper industries. In New York alone, “over 1.2 billion pounds of whey are produced annually” and “[f]inding economical, environmentally protective means to manage the whey is crucial to the viability of the industry and is needed to support the expansion of yogurt manufacturing in the State” (Ketterings et al, 2018).
Both paper fibers and whey are currently applied directly to farmland in the Northeast region. Adding these substrates to manure stores before land application could be a relatively simple way to reduce manure NH3 and methane emissions. In cases where whey is already added to manure stores, benefits could be realized with an even smaller change in current practices.
Cooperators
- - Technical Advisor
- - Technical Advisor
- - Producer
- - Producer
- (Researcher)
- (Researcher)
- (Researcher)
- (Researcher)
- (Researcher)
- (Researcher)
- (Researcher)
- (Researcher)
- (Researcher)
Research
Lab Research: Materials and Treatments
Substrates
Three substrates were chosen based on their availability in the Northeast region: 1) liquid dairy manure, 2) digestate from an on-farm anaerobic digester, and 3) source-separated, pasteurized human urine (Table 1). Liquid dairy manure was chosen due to the prevalence of dairy in the region. Digestate and urine are not as common, but are becoming more so. Urine is already in use and in demand among farmers in the Brattleboro area, and may be a valuable source of nitrogen-fertilizer in the heavily populated Northeast region in the future. Both digestate and urine have a higher pH and ammonia content than typical manures, meaning they have a high potential for ammonia loss. For this experiment, liquid manure was procured from Corse Farm Dairy in Whitingham, VT, digestate from Westminster Farms in Westminster, VT, and urine from the Rich Earth Institute in Brattleboro, VT.
Additives
Sweet whey, acid whey, and short paper fibers were selected as regionally-available additives that support microbial populations in substrates (Table 1). Sweet whey is produced from cheesemaking and has a pH of 5.6 or greater. Acid whey has a lower pH (around 4.1) and is a co-product of Greek-style yogurt, cottage and cream cheese production. Although there are some re-use markets, both wheys present disposal challenges. For example, the Grafton cheese making plant in Brattleboro, VT pays 5 cents per gallon to dispose of sweet whey (Grafton Cheese, personal communication). Acid whey used in this experiment was sourced from Commonwealth Dairy in Brattleboro, VT, and sweet whey from the Grafton Cheese Company in Brattleboro, VT.
Prado et al. (2020) tested bio-acidification of liquid dairy manure using cheesemaking whey (whey pH 4.8), at 20% and 50% of manure mass. They found that a 50% whey addition was needed to temporarily acidify below pH 5, with a net reduction in NH4 emissions. We propose to test a range of whey additions, up to 100%. Whey has approximately 5-6% dry matter content, most of which is lactose (Ketterings et al. 2017, Lievore et al. 2015), so a 1:1 mixture would produce a sugar concentration approaching 3%.
Short paper fibers (SPF) are a paper manufacturing byproduct and are produced in large quantities in the Northeast region. Paper fibers used in this study were sourced from the Soundview paper mill in Putney, VT, which generates 90-120 tons per day (PC, Adams, 10/9/2020). Finding a way to incorporate this material would add organic matter to fields while being valuable to the paper industry. Because of its low nutrient content, SPF could be safely added to manure stores on farms with excess P accumulation in soil.
Subair (1995) tested bio-acidification using short paper fibers, adding 2.5% and 5% paper fiber to liquid hog manure by wet weight. At these addition rates, the final pH was reduced from 7.2 to 6.5 after 56 days, and a minor reduction in ammonia volatilization was observed. Our experiment uses higher proportions of paper fiber, and mixes paper fiber and whey to test the synergistic effects of a more labile and more recalcitrant material mixture.
We tested the above additives both separately and in combination. Other bio-acidification studies have shown that mixing labile and recalcitrant substrates can have a synergistic effect (Subair, 1995, Nykänen et al., 2010), and this may reduce the overall substrate volume needed. In one study, a half-maltose half-flour treatment had the same results as the all-maltose treatment, but greater effect than all-wheat (Nykänen et al., 2010). One possible explanation for this is that acid generated by the labile materials speeds hydrolysis of the more recalcitrant materials; acidification with sulfuric acid has been shown to increase hydrolysis (Hjorth et al., 2013). To test for such a synergy that would achieve acidification effects using less total additive volume, we mixed whey and paper fibers and compared acidification effects to those of whey or paper fibers alone.
Starter Culture
Starter culture was added to substrate-additive mixtures to test whether it enhances fermentation. To make the starter culture, sauerkraut liquid (75mL), silage tea (75mL), and one probiotic pill (Figure 1) were combined and mixed using a magnetic stirrer. To make the silage tea component, silage (74g) was added to distilled water (290g), blended with an immersion blender, and steeped for 5 hours.
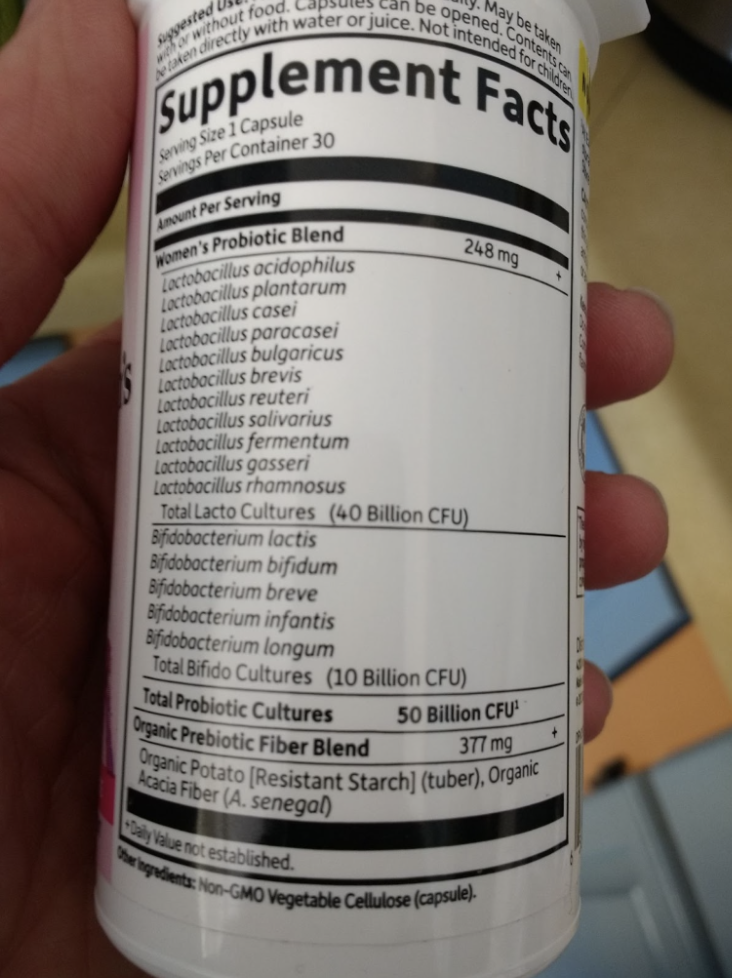
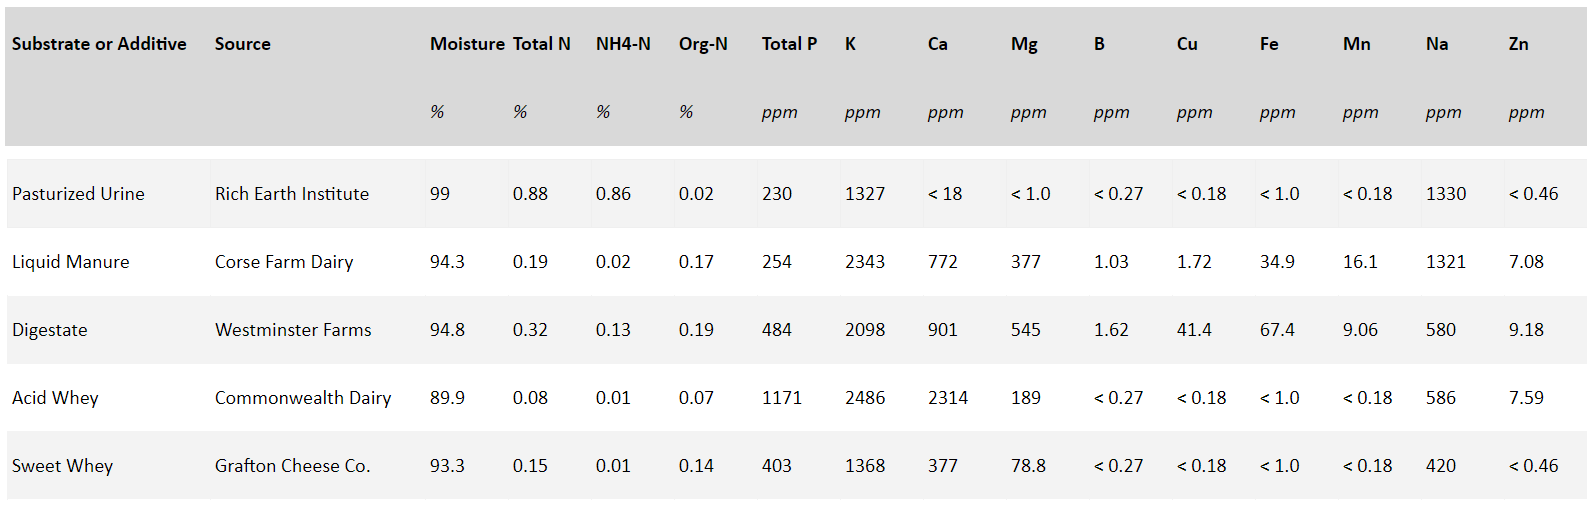
Table 1: Nutrient composition of substrates and additives, analysis provided by the Analytical Laboratory at the University of Maine
Lab Research: Procedures
Pre-trial: Test a wide range of substrate:additive mixtures to identify best “recipe” for each substrate/additive combination
Pre-trial Methods:
Mixtures were prepared at different substrate:additive ratios in a single 50 mL plastic centrifuge tube per treatment, for a total of 204 samples representing 204 treatments. The original plan included a 100% addition of paper fibers to each substrate, but this treatment was eliminated since the mixture would be too thick for farmers to pump. In addition to the tubes listed in Table 2, a control tube was prepared for each substrate (liquid manure, digestate, and urine). For each of the ratios listed in Table 2, one sample tube was prepared with culture and one without culture. All measurements of substrate and additive were made on a mass basis.
|
Substrate |
Additive |
Ratios |
|
Liquid Manure |
Sweet Whey |
12.5%, 25%, 50%, 66.67%, 100% |
|
Liquid Manure |
Acid Whey |
12.5%, 25%, 50%, 66.67%, 100% |
|
Liquid Manure |
Paper Fibers |
2.5%, 5%, 10%, 25%, 50% |
|
Liquid Manure |
Sweet Whey-paper mix (25:75) |
5%, 10%, 25%, 50%, 66.67%, 100% |
|
Liquid Manure |
Sweet Whey-paper mix (50:50) |
5%, 10%, 25%, 50%, 66.67%, 100% |
|
Liquid Manure |
Sweet Whey-paper mix (75:25) |
5%, 10%, 25%, 50%, 66.67%, 100% |
|
Digestate |
Sweet Whey |
12.5%, 25%, 50%, 66.67%, 100% |
|
Digestate |
Acid Whey |
12.5%, 25%, 50%, 66.67%, 100% |
|
Digestate |
Paper Fibers |
2.5%, 5%, 10%, 25%, 50% |
|
Digestate |
Sweet Whey-paper mix (25:75) |
5%, 10%, 25%, 50%, 66.67%, 100% |
|
Digestate |
Sweet Whey-paper mix (50:50) |
5%, 10%, 25%, 50%, 66.67%, 100% |
|
Digestate |
Sweet Whey-paper mix (75:25) |
5%, 10%, 25%, 50%, 66.67%, 100% |
|
Urine |
Sweet Whey |
12.5%, 25%, 50%, 66.67%, 100% |
|
Urine |
Acid Whey |
12.5%, 25%, 50%, 66.67%, 100% |
|
Urine |
Paper Fibers |
2.5%, 5%, 10%, 25%, 50% |
|
Urine |
Sweet Whey-paper mix (25:75) |
5%, 10%, 25%, 50%, 66.67%, 100% |
|
Urine |
Sweet Whey-paper mix (50:50) |
5%, 10%, 25%, 50%, 66.67%, 100% |
|
Urine |
Sweet Whey-paper mix (75:25) |
5%, 10%, 25%, 50%, 66.67%, 100% |
Table 2: Pretrial recipes
All sample tubes and tubes containing pH calibration solution were stored at 24°C for the duration of the pre-trial (70 days). pH was measured for all tubes at time 0, 7 days, 14 days, 21 days, 35 days, and 70 days. Samples showing the most pH change after 21 days were tested after 29 days (urine), 30 days (digestate), and 31 days (liquid manure). Urine tubes were also tested after 49 days.
Treatments for further investigation in the full trial were selected by choosing treatments from across the continuum of pre-trial ratios, selecting ratios that resulted in substantially larger pH drop than the next-highest substrate:additive treatment (Table 4). In other words, we selected treatments where an incremental increase of additive resulted in a substantial incremental decrease in pH.
pH Full Trial (Long Trial) Methods:
Using the effective recipes identified in the pre-trial, 6 tubes for each substrate/additive(s) combination were prepared. No whey/fiber combination recipes were selected, as they did not perform noticeably better than the single-additive recipes.
|
Substrate |
Additive |
Ratios |
|
Liquid Manure |
Sweet Whey |
6.25%, 12.5%, 50% |
|
Liquid Manure |
Acid Whey |
6.25%, 12.5%, 50% |
|
Liquid Manure |
Paper Fibers |
2.5%, 10% |
|
Digestate |
Sweet Whey |
50% |
|
Digestate |
Acid Whey |
25%, 50% |
|
Digestate |
Paper Fibers |
10% |
|
Urine |
Sweet Whey |
6.25%, 12.5%, 50%, 100% |
|
Urine |
Acid Whey |
6.25%, 12.5%, 66.67%, 100% |
|
Urine |
Sweet Whey-paper mix (25:75) |
25%, 50% |
|
Urine |
Sweet Whey-paper mix (50:50) |
25%, 50% |
|
Urine |
Sweet Whey-paper mix (75:25) |
25%, 50% |
|
Urine |
Sweet Whey and Culture |
6.25%, 12.5%, 50%, 100% |
|
Urine |
Acid Whey and Culture |
6.25%, 12.5%, 66.67%, 100% |
|
Urine |
Sweet Whey-paper mix (25:75) and Culture |
25%, 50% |
|
Urine |
Sweet Whey-paper mix (50:50) and Culture |
25%, 50% |
|
Urine |
Sweet Whey-paper mix (75:25) and Culture |
25%, 50% |
Table 3: Full Trial Recipes
To observe the effect on bio-acidification of different storage temperatures, three replicates of each sample were stored in a cold environment at 4°C and the other three in a warm environment at 24°C. Three control tubes of each substrate and of each additive were also stored at the above temperatures. pH calibration solutions were stored at their respective temperatures (24°C for calibration of the warm tubes and 4°C for calibration of the cold tubes).
The pH was measured for all tubes at days 0, 7, 14, 28, 42, 56, and 77. The 4°C samples were tested again at 98 days, but the 24°C samples were not tested at this time because the thermostat maintaining their temperature had failed at some point after 77 days.
The original plan for selecting recipes for volatilization analysis was to use the mixtures that requires the least substrate addition while maintaining pH below 5.5 throughout the storage period (Table 3). But since reaching this low pH required very large additive additions, we also tested recipes that exhibited significant acidification, but did not reach such low pH levels.
Data from full trials was analyzed for significant differences using a one-way analysis of variance (ANOVA) and a post hoc test, with significance determined at p<0.05. R and RStudio were used to do the analyses. Results are found in the Supplemental Information-Document.
Test ammonia volatilization following simulated surface application
To estimate the amount of ammonia that could be lost after field application of acidified substrates, we conducted jar tests in the laboratory following methods from Kennedy (2018), measuring degrees of ammonia volatilization from the 15 best recipes identified in the full trial. The test consisted of placing a sample of fermented liquid in a closed jar, along with an ammonia trap to capture any ammonia that evaporated from the sample. Also in the jar was an alkaline trap to capture CO2. Over the course of 20 days, the ammonia trap was periodically analyzed to determine the total amount of ammonia that had volatilized.
This experiment simulates a situation where the acidified liquid fertilizer (urine, manure, or digestate) is spread on the field and remains on the surface of the ground for some time before incorporation into the soil by rainfall or tillage. This is a situation commonly encountered when spreading manure on grassland, because thick manure slurry can sit in pools on the ground for some time, drying and losing ammonia to the atmosphere until rain eventually washes the ammonia into the soil. The jar trial lasted 20 days, to allow periodic measurements over a simulated dry-weather period of up to 20 days.
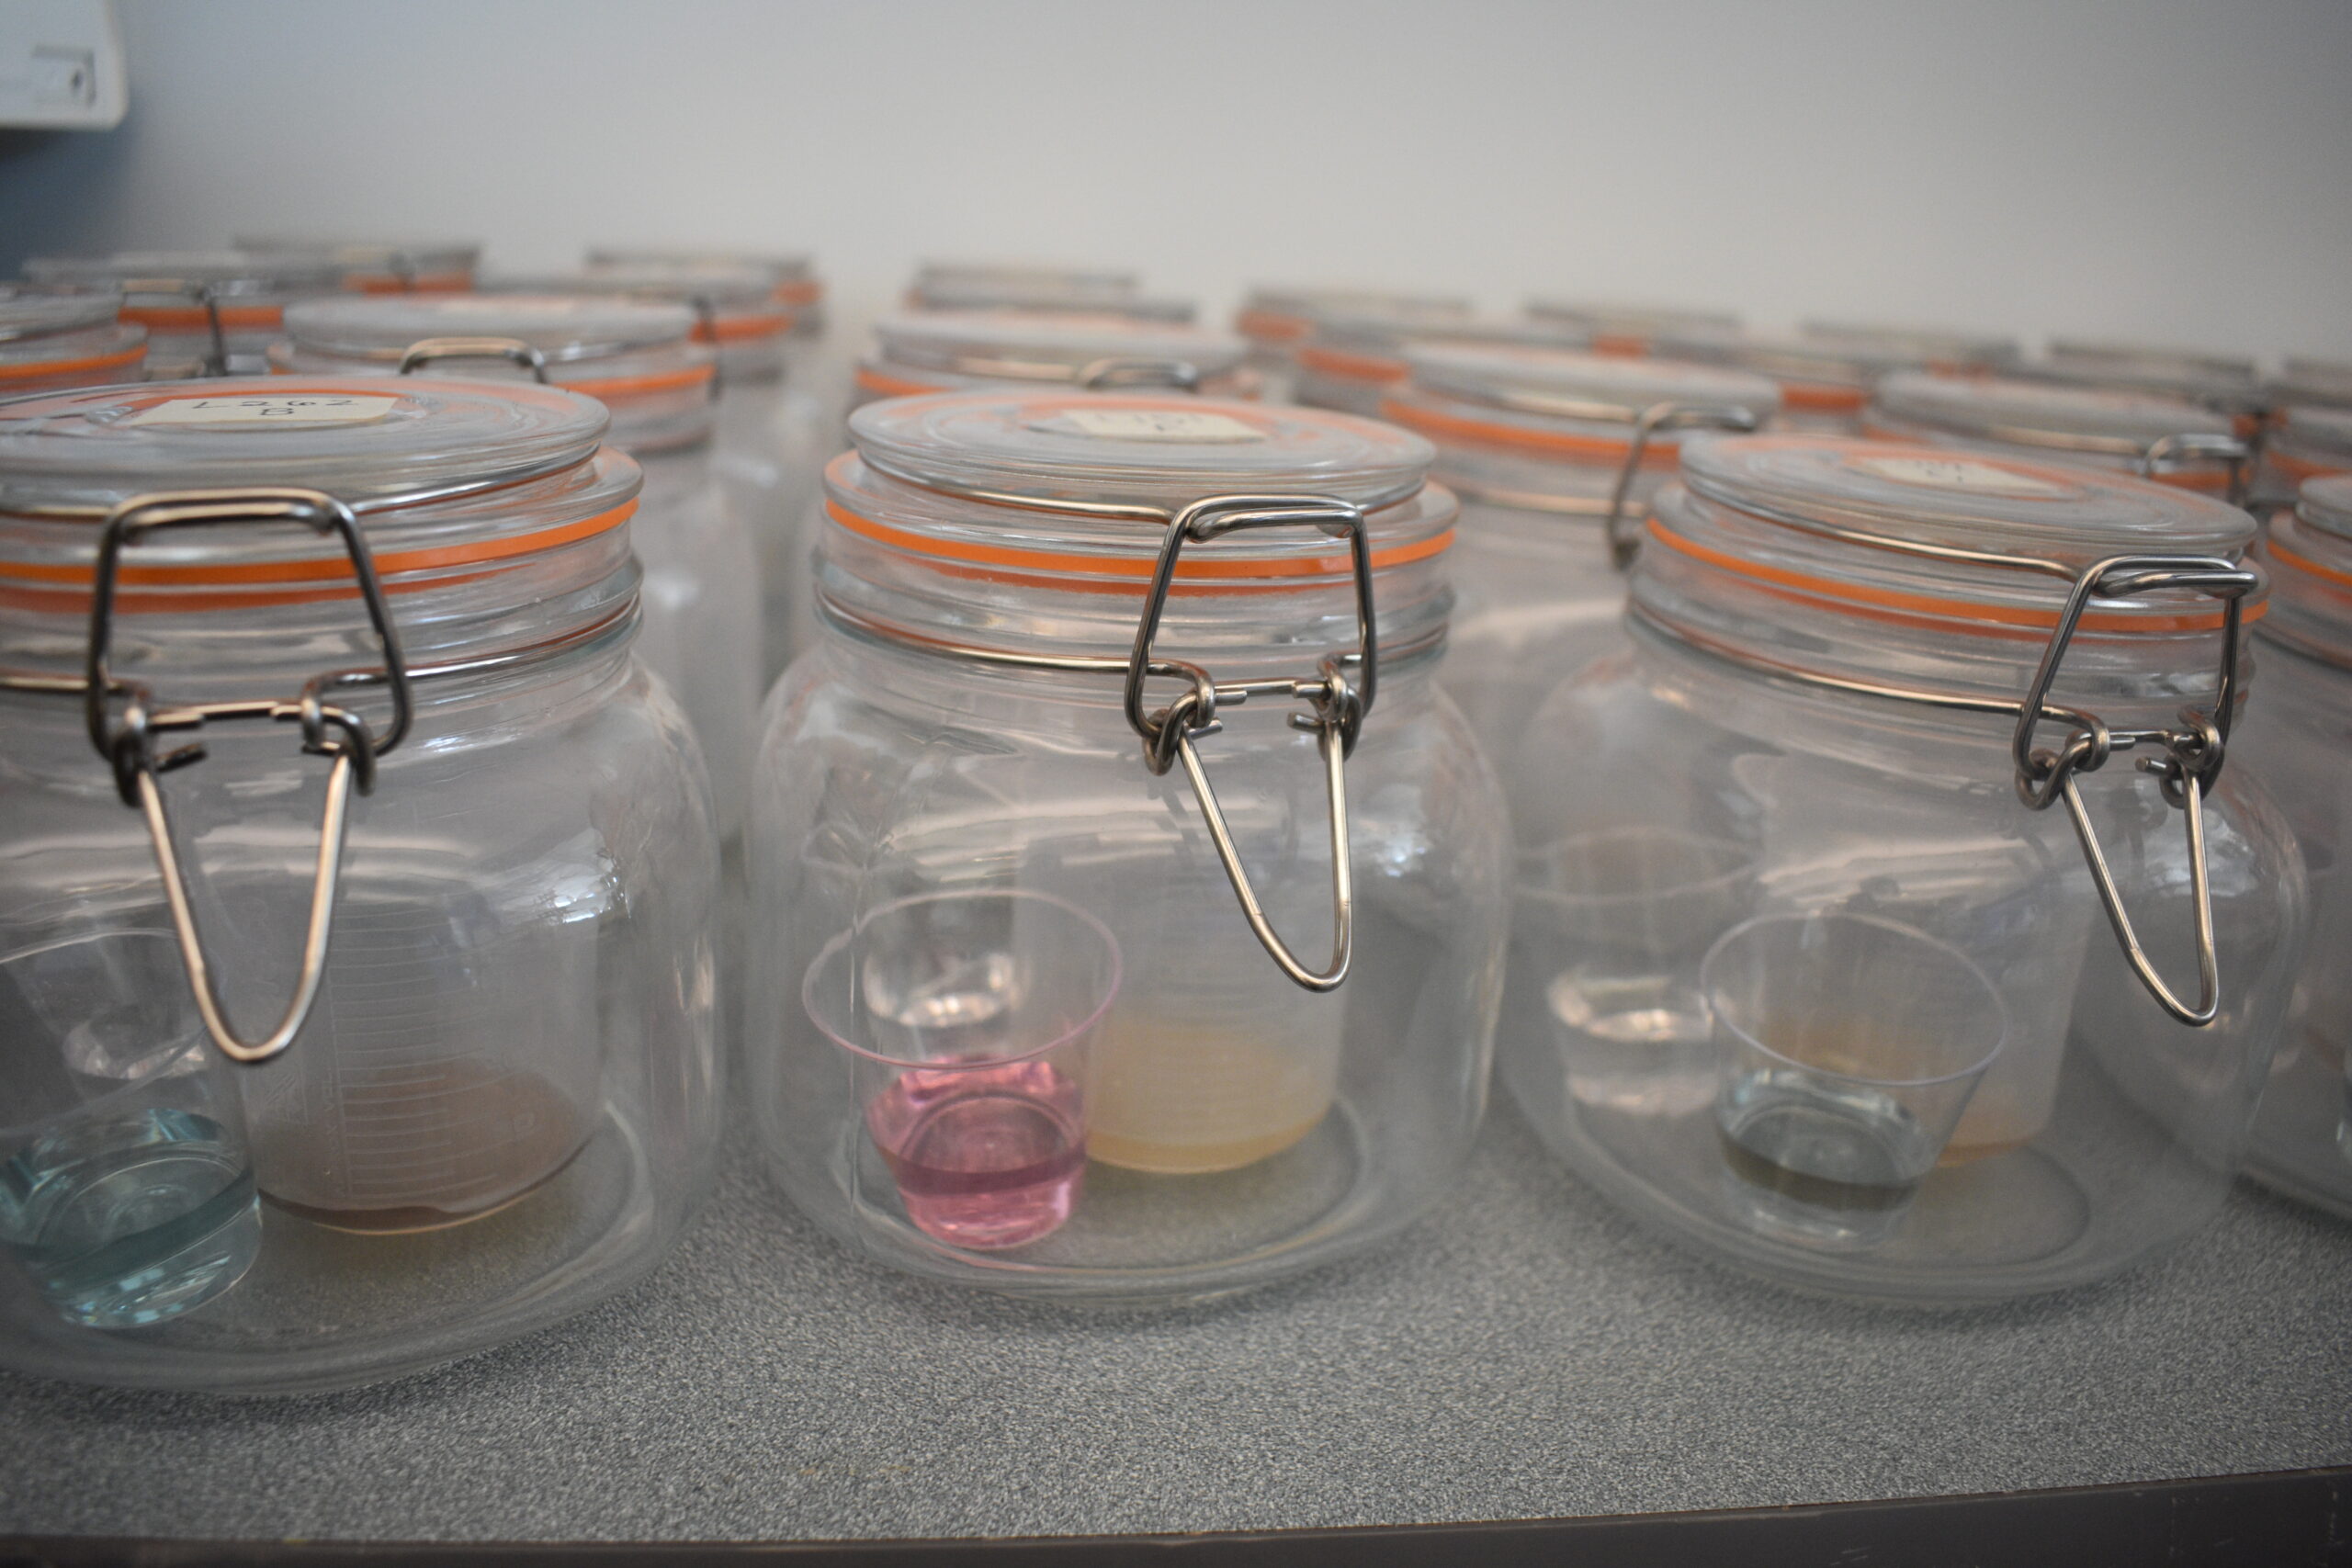
Each recipe was tested in triplicate, resulting in a total of 45 jars. Each airtight glass jar contained:
- a 100mL beaker containing 5mL of the fermented liquid being tested
- a plastic shot glass with 10mL of NaOH (1M) as a CO2 trap
- a plastic shot glass with 12mL boric acid (4%) as an ammonia trap
An indicator was made by combining methyl-red and bromocresol-green indicator in equal parts and added to the stock boric acid solution at 1%. This indicator is blue above a pH of 4.7 and red below a pH of 4.7 (Figure 2), and is used to mark a titration end-point in the Kjeldahl Method (Sáez-Plaza et al., 2013).
The pH of each liquid sample was taken on day 0 of the volatilization trials. Jars were kept at room temperature over the course of the experiment.
|
Substrate |
Additive |
Percentages Added |
|
Liquid Manure |
Sweet Whey |
6.25%, 12.5% |
|
Liquid Manure |
Acid Whey |
6.25%, 12.5% |
|
Liquid Manure |
Paper Fibers |
2.5%, 10% |
|
Digestate |
Sweet Whey |
50% |
|
Digestate |
Acid Whey |
25% |
|
Urine |
Sweet Whey and Culture |
6.25% |
|
Urine |
Acid Whey and Culture |
6.25%, 12.5%, 100% |
Table 4: Volatilization Trial Recipes
The boric acid trap was titrated on days 0, 1, 2, 4, 6, 12, and 20 to measure ammonia caught. The color of the boric acid was checked for each jar prior to sampling; if the indicator was still pink, then the jar lid was opened for 20 seconds and closed. If the indicator had changed to blue (indicating that ammonia had been captured), the shot glass of boric acid was removed from the jar and replaced with a fresh boric acid trap, keeping the jar lid open for 20 seconds. To titrate, the acid trap contents were poured into a 40mL beaker on a stir plate, and 10 mL distilled water was added to the beaker to ensure adequate volume for a pH probe. The boric acid solution was then titrated with 0.05N sulfuric acid solution to a pH of 4.7. pH. Titrations were performed using an automated pump, allowing the titrant to be dosed in increments of .01 grams from a container on a scale (OHAUS Adventurer Pro, 0.001g resolution). The grams of titrant were recorded and used to calculate the grams of N volatilized per liter substrate according to the following formula:

= grams N captured per liter of sample mixture
Data analysis
We tested data for homogeneity of variance and normality; non-normal data was transformed and reanalyzed for normality. Data was then analyzed for significant differences using a one-way analysis of variance (ANOVA) and a post hoc test, with significance determined at p<0.05. We used R and RStudio to do the analyses.
On farm feasibility evaluation and wider farmer engagement
- Farmer Interviews: For initial input on the research design and interview protocols, we reviewed information on nutrient management issues from several of the livestock farmers we had interviewed in 2018 (SARE ONE 18-318). We then engaged several additional farmers who use liquid manure and have manure storage facilities on their farms. These interviews focused on challenges with retaining maximum nitrogen potential of manures; interest, motivations and concerns potentially associated with the use of whey or short paper fibers for bioacidification; and their thoughts about the time and labor costs potentially involved in adding inputs to current manure storage.
- Farmer-partner feasibility study: Our two farmer partners have been closely involved with the project. We conducted site visits with each to review and document their current manure collection, storage, and field application systems, and how they currently manage N volatilization, with follow up interviews towards the end of the project. We shared results from the lab trials with them to evaluate whether and how whey or paper fibers could be used on their farms. Specifically, we strategized about how we could potentially implement a bio-acidification strategy with existing practices and equipment and/or determine what additional equipment/infrastructure would be needed. We evaluated the potential costs and financial benefits from implementation. Given the clear potential to use farm-generated whey on Elm Lea farm, we hope to engage with that farm partner in planning and designing a future research proposal.
SARE-2021-interview-guide-bioacidification.docx_.
Lab Pre-Trial Results
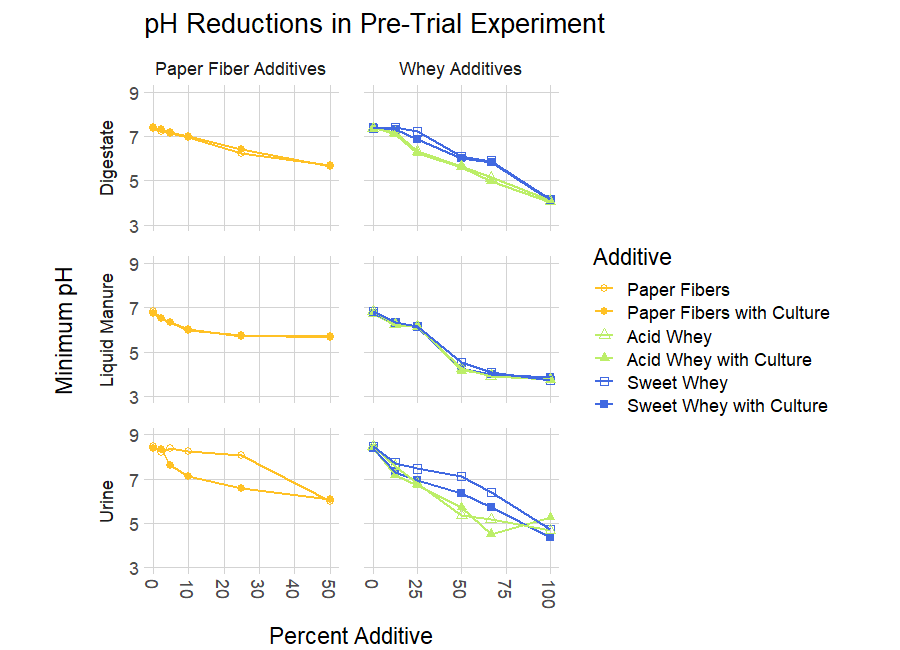
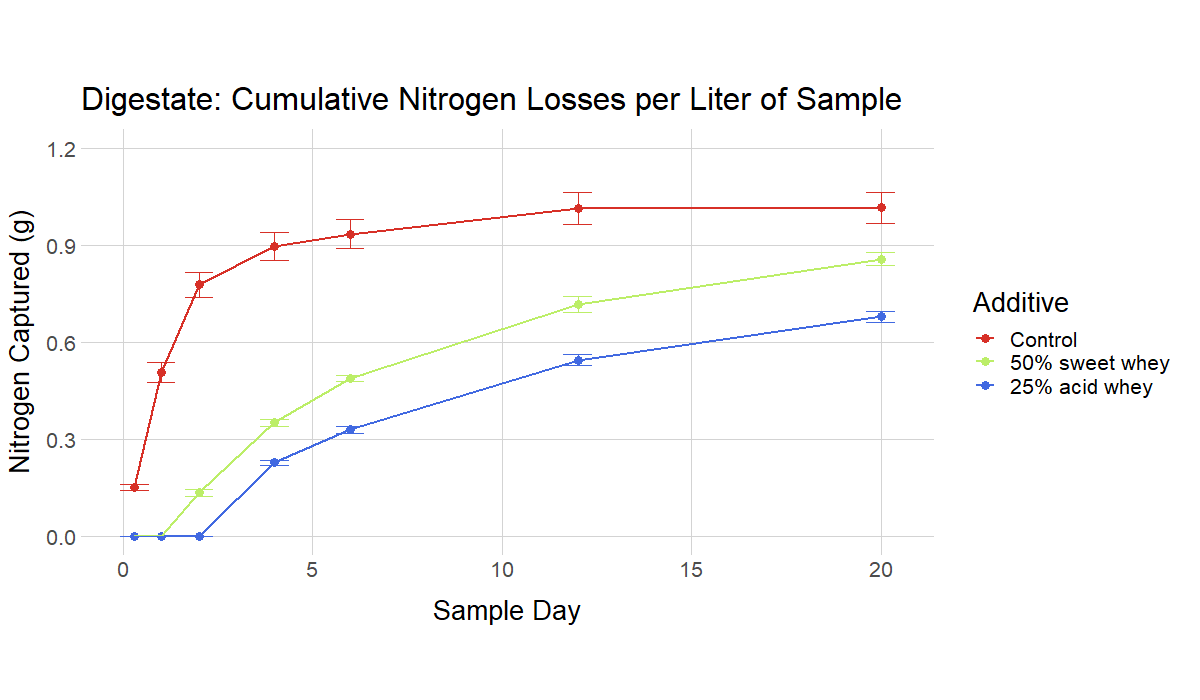
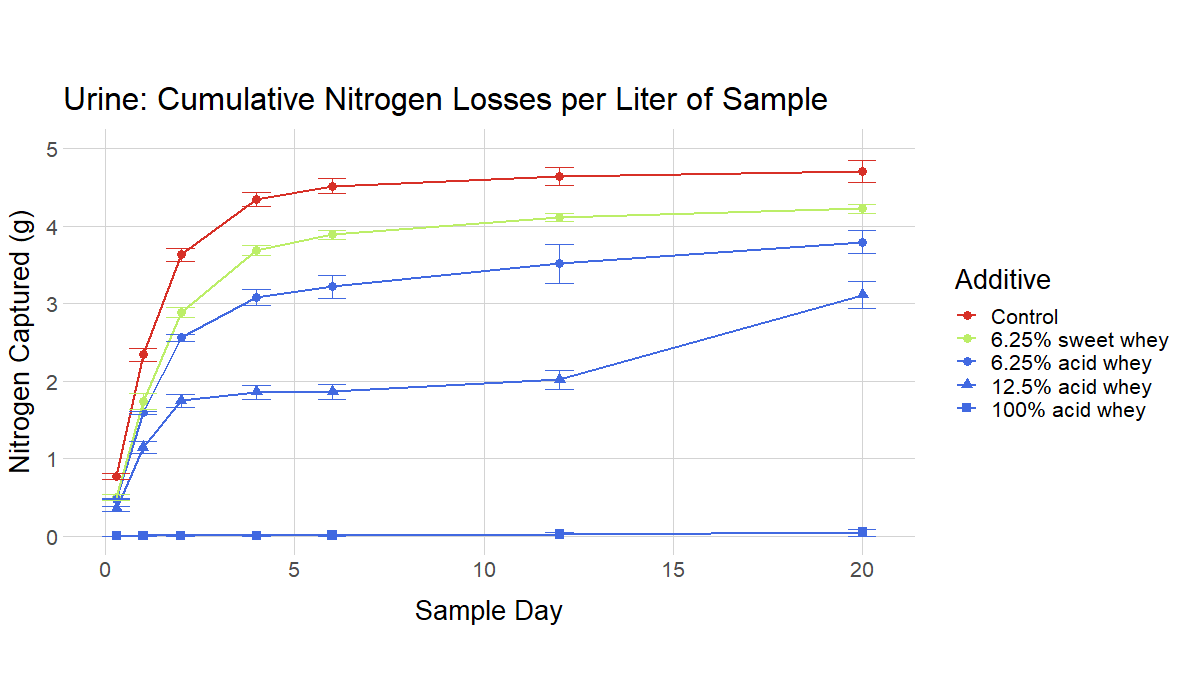
Results from the pre-trial revealed that the two wheys and paper fibers were all effective at lowering pH of all substrates tested (Figure 3). Acid whey lowered pH to a larger degree than sweet whey in digestate at all percentages except the maximum (100%), and it lowered pH more effectively in urine at all percentages except the minimum (12.5%) and maximum (50%) ratios. Both wheys reduced pH by similar amounts in liquid manure. The greatest pH reduction in substrates occurred when additives were added to substrates at their maximum rates; all whey additives added at 100% reduced digestate pH to ≤4.16, liquid manure to ≤3.85, and urine pH ≤5.28.
Paper fibers did not affect the pH of substrates as strongly as whey additives at the ratios tested. The greatest pH reduction from paper fibers occurred when paper fibers were added to substrates at a 50% rate, resulting in pH reductions in digestate to ≤5.69, reductions in liquid manure to ≤5.71, and reductions in urine to ≤6.07.
The addition of culture resulted in noticeably lower pH values in urine mixed with sweet whey or with paper fibers, but it did not affect the pH of digestate or liquid manure. Cultured sweet whey showed greater pH reductions in urine than uncultured sweet whey at all dosing levels, and cultured paper fibers showed greater pH reductions in urine than uncultured paper fibers at all dosing levels except the minimum (2.5%) and maximum (50%) percentages. This difference was especially apparent at low ratios of paper fiber additives, where cultured fiber additions lowered urine pH relative to uncultured fiber additions by 0.79 at 5%, 1.12 at 10%, and 1.46 at 25%.
Lab Full Trial (Long Trial) Results
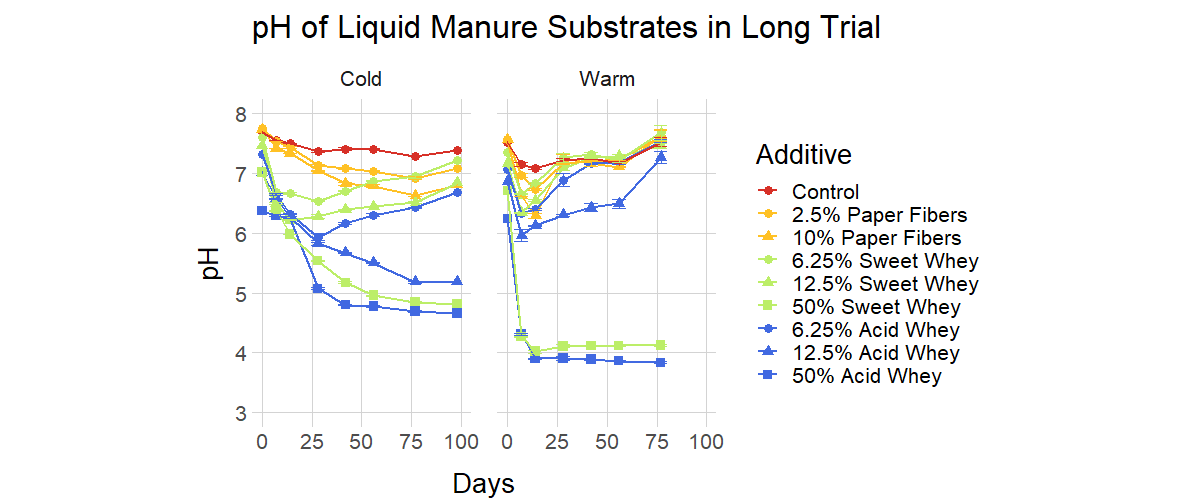
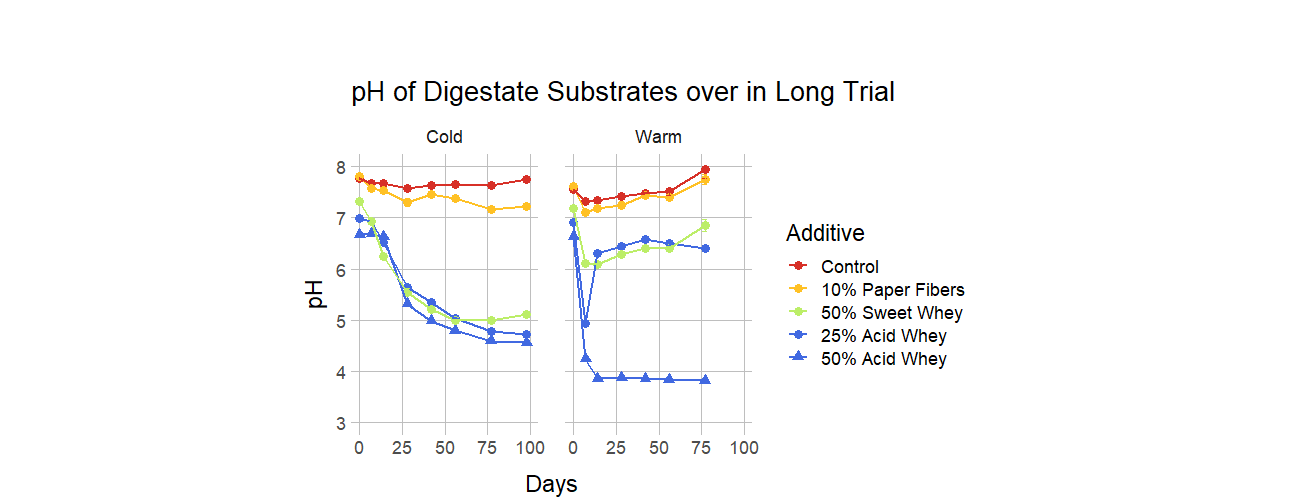
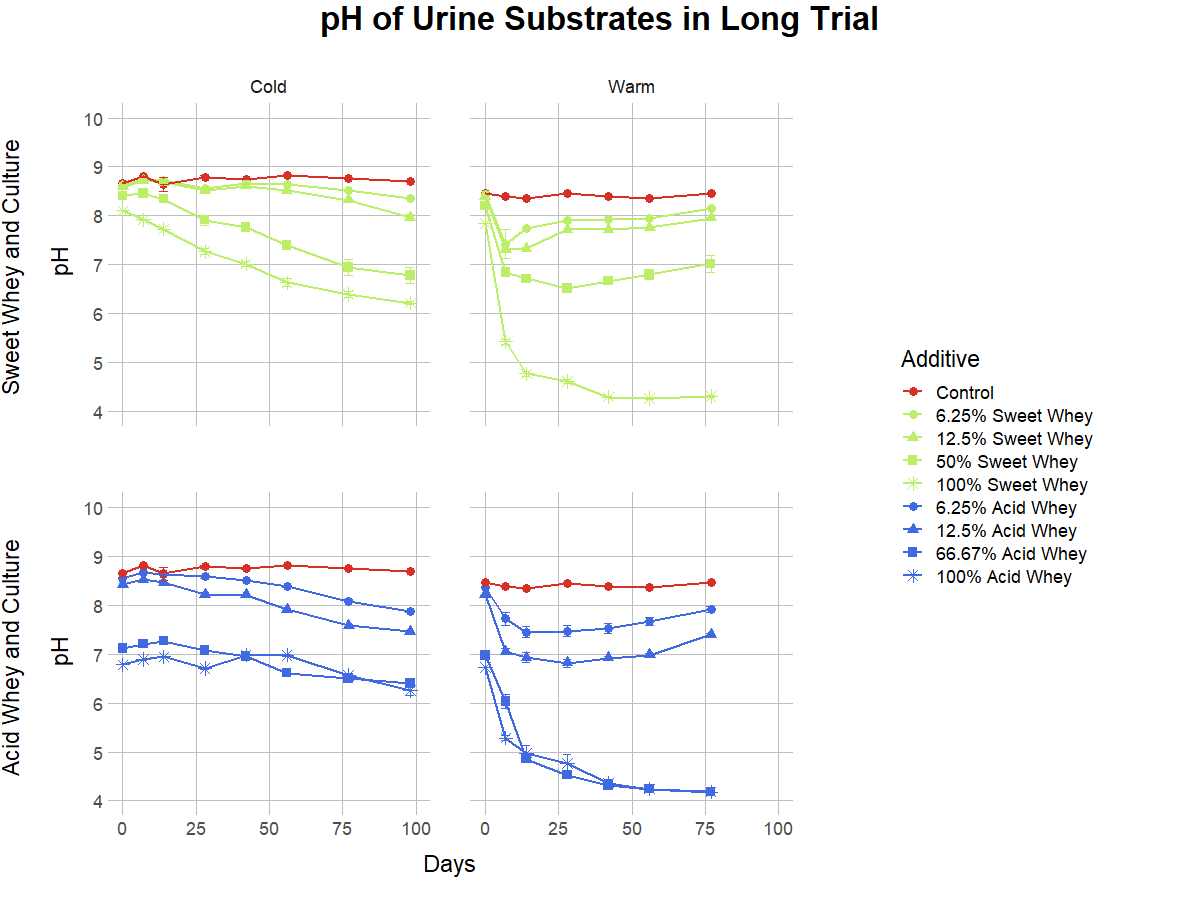
For the full trial, we monitored pH in samples stored at 24°C and 4°C, for 77 to 98 days, respectively. The pH dynamics were markedly different in the warm and cold environments, as shown in Figures 4, 5, and 6. Detailed graphs of pH behavior of all warm and cold versions of each recipe can be found in the Supplemental Information Document. A striking example of a temperature-related difference is the behavior of the liquid manure with 12.5% acid whey addition (Figure 4), in which the pH in the cold condition descends nearly to 5, while in the warm condition it drops only to 6 and then rises to over 7. Temperature can also influence the duration of pH reduction, as warm conditions frequently led to a sharp pH decrease followed by a pH increase, while the pH in cold environments tended to rebound more gradually or not at all. This rebound behavior was more pronounced with smaller percentages of additive. For example, 50% acid whey additions to manure did not rebound regardless of temperature, yet when added at a smaller rate of 12.5%, pH does not rebound in a cold environment but does rebound in a warm environment (Figure 4).
Ammonia Volatilization Jar Tests
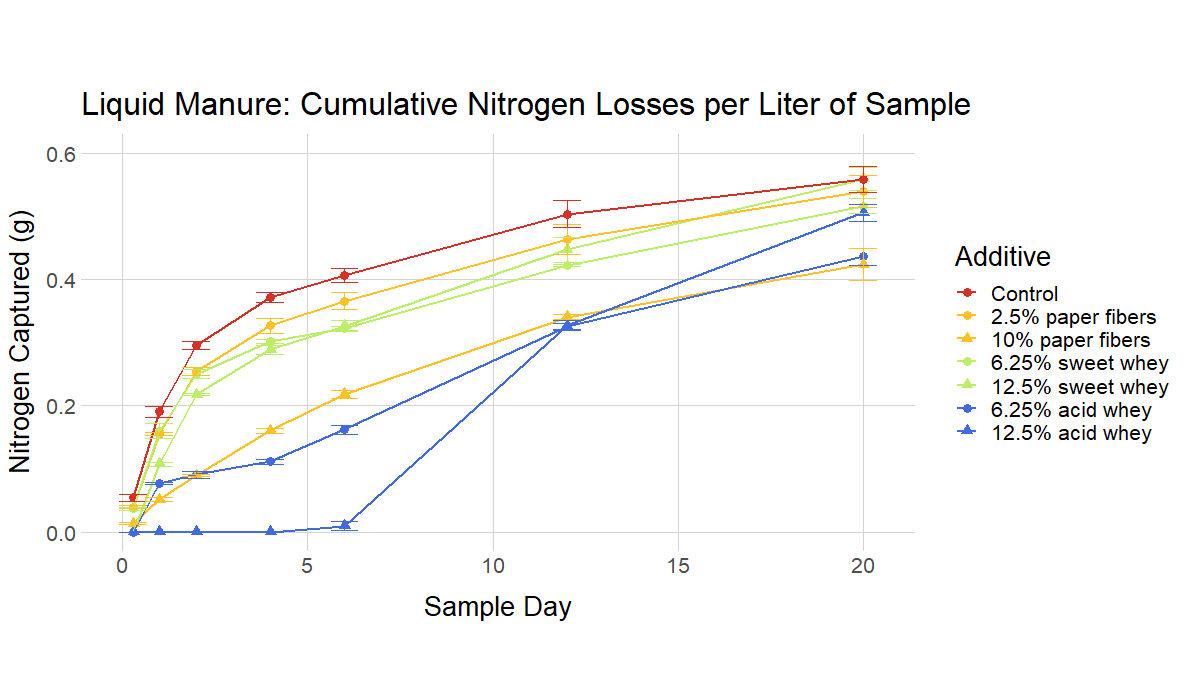
The ammonia volatilization tests simulated a situation where the acidified manure/digestate/urine is applied to the surface of a field, and then left there for a period of days without incorporation. (This equates to the common field condition where manure is applied as a broadcast and sits on the surface of a field until rain leaches the soluble nitrogen into the soil.) For instance, in Figure 7 (liquid manure) the control manure has lost about 0.4 g of ammonia per liter by Day 4, while the 12.5% acid whey recipe has lost virtually no ammonia. If substantial rain were to fall at that point, the ammonia in the 12.5% recipe could potentially be incorporated with very little loss.
The recipes with higher rates of additive generally performed better, with the highest rates resulting in virtually no volatilization for a number of days. However, an important finding was that recipes with low rates of additive and near-neutral pH values still resulted in relevant reductions in ammonia volatilization compared to non-acidified controls.
|
Substrate |
Additive |
Percent Additive |
Day 0 Sample pH |
|
liquid manure |
sweet whey |
12.50% |
6.83 |
|
liquid manure |
sweet whey |
6.25% |
7.05 |
|
liquid manure |
acid whey |
12.50% |
5.21 |
|
liquid manure |
acid whey |
6.25% |
6.59 |
|
liquid manure |
paper fibers |
2.50% |
7.04 |
|
liquid manure |
paper fibers |
10% |
6.92 |
|
liquid manure |
none |
0% |
7.15 |
|
digestate |
sweet whey |
50% |
5.67 |
|
digestate |
acid whey |
25% |
4.46 |
|
digestate |
none |
0% |
7.49 |
|
urine |
sweet whey |
6.25% |
7.8 |
|
urine |
acid whey |
12.50% |
6.94 |
|
urine |
acid whey |
6.25% |
7.41 |
|
urine |
acid whey |
100% |
5.07 |
|
urine |
none |
0% |
8.66 |
Table 5: pH measurements of all recipes on day 0 of the ammonia bench trial experiment. All manure and digestate recipes are cold and uncultured, and all urine recipes are cold and cultured.
Quantifying the benefit
Finally, using the results from the volatilization experiment, we performed a series of calculations to determine the total increase in the amount of nitrogen delivered to the (simulated) soil by each of the tested recipes. Calculated values included:
- Total reduction in ammonia volatilization (grams of nitrogen per liter of urine/digestate/manure)
- Reduction in ammonia volatilization per unit of additive (grams of nitrogen per kg of additive)
- Total net increase in retained nitrogen per unit of additive (the previous value, plus the nitrogen in the additive itself)
Put another way, calculation #3 is how many additional grams of nitrogen will reach the soil for every kilogram of additive used. This number includes ammonia in the urine/digestate/manure that is retained instead of volatilized, plus the nitrogen content of the additive itself.
The graphs below show the result of calculation #3. The x-axis corresponds to the number of rainless days after application of the urine/digestate/manure. For each point on the x-axis, the y-value of the colored lines indicates how many more grams of nitrogen will enter the soil using each acidified recipe (instead of the non-acidified control) if the first substantial rain were to fall at the end of the indicated day.
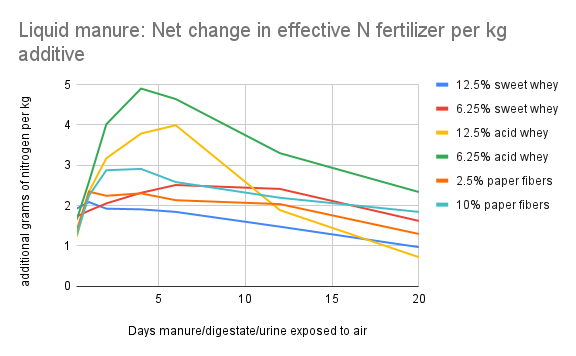
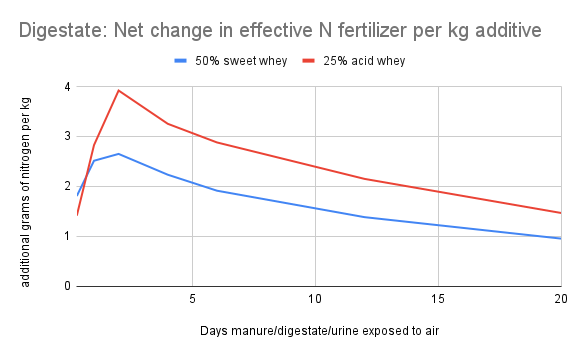
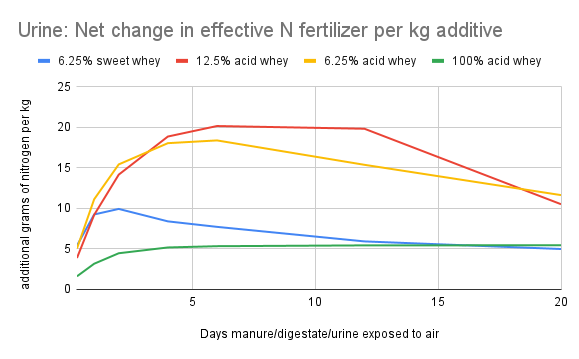
Calculation #3 is the most useful metric for determining cost/benefit to a farmer. In the context of a given farm, the cost of procuring and adding an additive can be determined, and can be compared to the value of the additional nitrogen that reaches the soil due to the addition of the whey to the manure storage system.
The “additional grams of nitrogen per kg additive” values can be multiplied by 8.4 to approximate pounds of nitrogen per 1000 gallons of whey, or by 2 to approximate pounds of nitrogen per ton of paper fibers.
As an example, on the liquid manure graph (Figure 10), if rain falls at the end of day 4, and the farmer has used 6.25% acid whey as an additive, each kg of whey would theoretically result in just under 5 additional grams of nitrogen reaching the soil. In English units, that would be about 40 pounds of additional nitrogen per 1000 gallons of acid whey added. By factoring in the cost of procuring and adding the whey, and the value of the urine, the farmer could determine the cost/benefit ratio. The liquid manure used in our study was very dilute--with more concentrated manure the volatilization risk is higher, so the benefit from bioacidification might also be higher.
NOTE: These values are from a laboratory jar experiment experiment that did not contain soil, and should be taken only as an indication of what sorts of benefits might be possible on a farm. Followup experiments in a field environment are needed to determine actual effects.
Laboratory Research Conclusions
- Acid whey was generally the most effective additive, and low rates of addition (6.25% and 12.5%) resulted in the greatest benefit per unit of additive added, in both urine and liquid manure.
- Acidification of digestate required relatively large rates of additive, compared to urine and liquid manure.
- The pH of all mixtures were lower than the unamended substrates, for all additives in all substrate types.
- For a given pair of substrate and additive (e.g. urine substrate with acid whey additive), the pH reduction was larger with higher rates of additive (Figure 10).
- Temperature had a large effect on the performance of many recipes, resulting in differing rates of acidification and final pH.
- Reductions in pH were sometimes temporary, with an initial decrease in pH followed by a rebound in pH. Recipes containing larger amounts of additive tended to stay low for longer, and recipes with the highest rates of additive experienced little to no rebound. Warm conditions resulted in faster rebound than cool ones.
- Acid whey more effectively lowered pH than sweet whey when added at the same proportion. In extreme cases, such as addition of whey to liquid manure at a rate of 12.5%, the pH after 98 days of storage in the cold condition was 5.18 ± 0.01 for acid whey and 6.84 ± 0.01 for sweet whey (Figure 12). Acid whey also generally outperformed paper fibers.
- Addition of a starter culture to urine substrates achieved greater pH reductions than uncultured urine substrates. Culture did not measurably affect pH in manure or digestate substrates.
- For a given pair of substrate and additive, ammonia volatilization was reduced at higher rates of additive, with the exception of 6.25% and 12.5% sweet whey in liquid manure.
- The lower the pH of a substrate on the day of field application, the lower the ammonia volatilization over the course of the following 4 days (see Supplemental Information Document).
Partner site visits to assess feasibility
The Corse Farm Dairy
We conducted a site visit with Leon Corse on August 16th, 2022 with a follow-up interview on May 15th, 2023. This dairy farm currently has 90-100 cows. It is a no-till operation, and has not been plowed in 35 years. Row crops are not grown. The Corse Farm philosophy is to "treat the land with only products that are naturally occurring, using no herbicides, pesticides, chemical fertilizers and only products that are natural to the earth." In addition to their own manure, some 10 tons of custom formulated organic fertilizer was applied in 2023 at an approximate cost of $13,000 - $14,000.
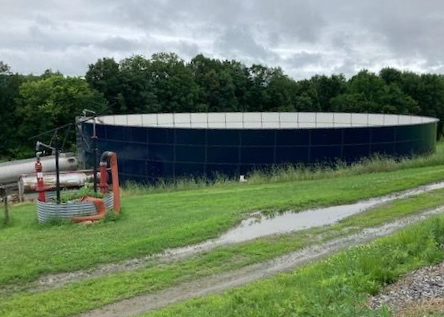
The Corse Farm has a large manure storage tank with a capacity of 600,000 gallons, built 31 years ago, which was half-full at the time of our visit. The storage tank receives not only manure from the cows, but wastewater from the milking facility, including detergents and other acids used for cleaning. (The wastewater first goes to a buried concrete tank and then is pumped to the manure storage tank.) A crust forms in the manure storage tank on top of the material stored here, which Corse noted has the effect of reducing ammonia losses. The tank normally has the capacity for seven months of storage.
There is an agitation system, connected to a tractor, with an articulated manure pump, which operates during the period when the manure is being spread. (Manure is usually spread three times a year, April, June and October, and requires one week each time. They hope to eliminate the June spreading soon.) The system both agitates the stored material to mix solids that have settled to the bottom, and pumps the liquid manure into the spreader.
Because the manure storage tank is usually full in the spring, it would be difficult to add any additional material such as whey or paper fibers any time before the spring manure application. Corse notes that on most dairy farms, capacity in the spring will be a challenge for adding anything that takes very much volume. Addition of whey or paper fibers prior to the fall applications would be more feasible in terms of manure pit capacity.
If the additive were introduced to the manure pit all at once and then mixed in, this would incur considerable time, labor, and expense of operating the tractor and running the agitation system. There would have to be a significant benefit in order to justify the effort. Corse suggests that the need for agitation could be avoided (in the case of whey) if the whey could be parked in a tractor-trailer on the farm and be gradually added, mixing with the liquid manure going into the manure storage tank. Potentially whey could be added directly to a buried tank between the barn and manure pit, but the tank would have to be modified to accept it. It would be important that this step did not incur significant additional labor.
With regard to ammonia losses through volatilization, Corse believes that his system does not currently result in significant losses during application, due to the low percent solids in the liquid manure, which allows the liquid manure to quicky soak into the ground after application. Because the farm is no-till, there is also deeply rooted sod, which may also play a role in the quick uptake of the nutrients applied. There is also high organic matter in the farm's soil, which likely aids nutrient retention.
Given this situation, although Corse identified a potentially practical way to combine whey and fresh manure before they were added to the storage tank each day, it was questionable whether the benefits would outweigh the costs. The percent solids level in the manure holding tank is very low, due to the addition of wash water. As a result, dissolved ammonia is quickly carried down into the soil by the infiltrating water immediately after application, rather than remaining on the surface in a slurry. This is in line with UVM guidance that there is less ammonia volatilization as solids content goes down.
Elm Lea Farm, Putney School
We conducted a site visit with Pete Stickney on October 6th, 2022, with a follow up visit on August 29th, 2023. The Elm Lea farm has approximately 25 cows, and grows forage hay to feed them. The cows produce approximately 1400 pounds of milk per day. Cheese is also made on the farm on a small scale, but the intention is to increase the cheese operation, making a young jack cheddar. An effort is being made to reduce the amount of purchased synthetic fertilizer - none was used in 2022, and four tons in 2023. (In 2022, urine from the Rich Earth Institute was also used.)
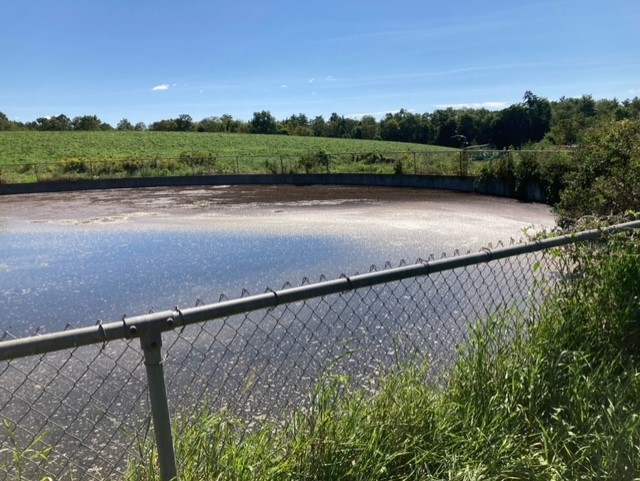
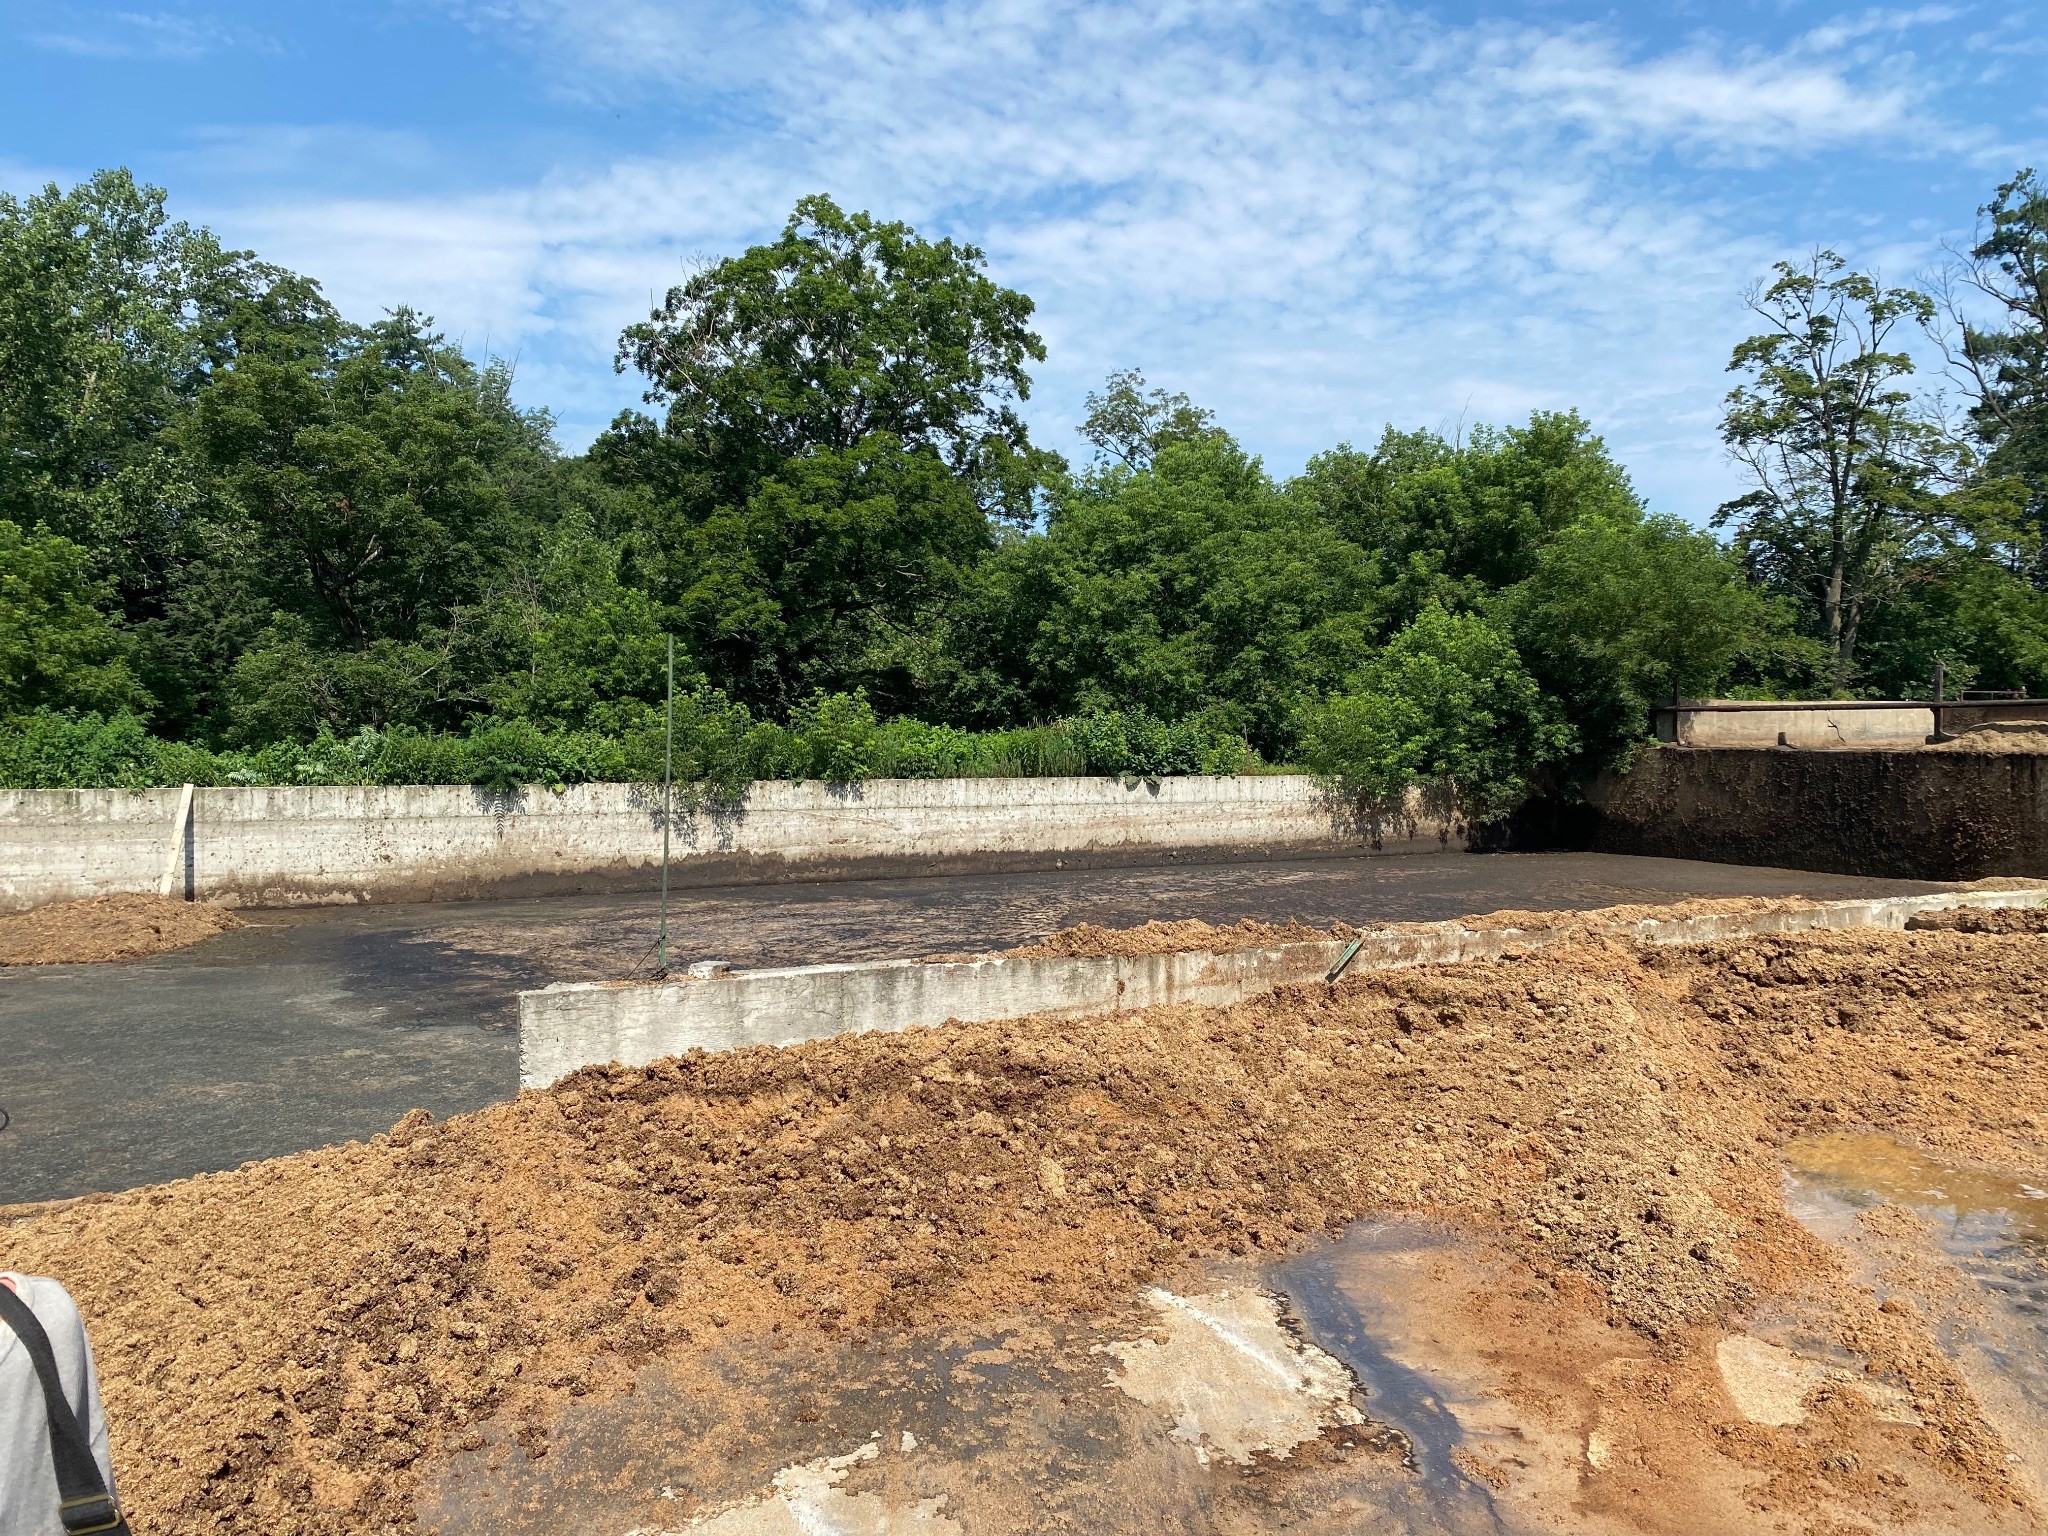
There is a plastic-lined 180,000-gallon lagoon which collects all the rain that falls in the portion of the barnyard that contains the solid manure pile, and all the leachate from the solid manure pile, as well as the milk room wash water, which includes cleaning components such as liquid soap, acid sanitizers, and chlorine bleach. Some 250 gallons of milkroom wash water is produced daily and added to the lagoon. The barnyard solids are stored separately and turned with an excavator periodically. Food waste from the dining hall is also intended to be added to this composting system. Elm Lea farm does not make a slurry as they currently do not have the equipment to manage this. As cheese-making is ramped up, whey is also planned to be added to the lagoon, anticipating approximately 400 - 500 gallons/month. (Pete is interested in potentially adding more whey from off-site.) The lagoon system was built 18 years ago. The plastic lining has a 20 year life, so the intention is to build another larger concrete-lined tank, holding 500,000 gallons, in 2025.
The material in the lagoon is sprayed on the hay and pasture in the spring, using an overhead sprayer. While the grass receives some nutrients from this application, Stickney feels the water that this adds to the fields is as or more important to hay/pasture health, particularly in a drought year as was the case in 2022. The intended addition of whey, however, will also add valuable nutrients. Unlike Corse farm, there is no crusted layer on top of the lagoon, as very little solids are added to the system.
At Elm Lea Farm, they already intend to add whey to their manure holding pit, simply as a way to manage the "waste" whey. This will be the simplest way of incorporating whey into a manure storage system. However, the whey can also play a role in acidification. This synergy of having a cheese making operation on farm has the added value of reducing nitrogen losses from the lagoon, as well as during the spray application. In other words, this model has the benefit of increased nitrogen retention by making cheese on the farm, which could potentially be a selling point for this farmstead cheese.
It would not be feasible or desirable to add paper fibers to this system, as there is no agitation system, and these would likely collect at the bottom of the lagoon and could clog the irrigation system.
With regard to adding whey-derived biostimulants to irrigation liquid, Stickney is interested in this, particularly as an educational project with the Putney School students, doing a longitudinal study. However, it would be best to add the biostimulant to the system during irrigation, but not added directly to the lagoon, so as to conduct an experiment comparing the added biostimulant to control. It would make sense to do this during applications of urine which Stickney would like to expand if sufficient urine is available. Stickney is also interested in the possibility of adding urine to the lagoon as a way to increase the nitrogen content of the system. He does not think this would result in excess nitrogen application, but would require adding material to his piping system to get the liquid to more distant fields.
It may also be possible to measure differences in ammonia losses during application, after whey has been added. Stickney would also be interested in measuring the levels of chemical components of milk room wash water in the lagoon. With regard to soil health, he is also interested in measuring changes in microbial communities from fields treated with different fertilizers.
Farmer Interviews
The goal of these interviews was to understand the perspectives, interest, and feasibility of these methods on a range of farm types and to learn what farmers would need in order to consider using whey or paper fibers for nitrogen retention.
In addition to the two partner-farmers, six farmers on five farms in southern Vermont and New Hampshire that have liquid manure storage were interviewed. All the interviewees were male. Their ages ranged from 23 - 69. While we initially intended to interview 10 or more farmers for this project, and made every effort to do so, it turned out that given the limited number of farmers who have liquid manure storage in our area, and due to some management changes and imminent sales of two farms, we were only able to include five. However, among those five there was a wide range of manure storage systems, so that we were still able to glean significant perspectives on the feasibility of bioacidification on diverse farms. Four of the five operations were described as "conventional" and one was certified organic. All farmers were offered the option of confidentiality. While most were comfortable with their names being used, one was not. Since there are only a small number of interviews and few farms with liquid manure in the region we have elected to keep all responses anonymous to protect that individual's privacy.
The acres under management (primarily in corn silage, haylage, and pasture) ranged from approximately 300 to 700 acres. Most of the farmers interviewed had their home farm and also managed additional rented fields at varying distances to the home farm. The farmers interviewed all had dairy cows that were at least partially grass-fed. Some also had beef animals. The numbers of livestock ranged from 80 to about 550.
Most of the farmers had both stacked manure and storage tanks or lagoons of varying sizes from "too small!" (this farmer did not recall the size of his lagoon) to an estimated 3.5 million gallons. One farmer noted that they had a storage tank of 600,000 gallons but needed about 2 million. Insufficient storage was a source of frustration for most of the farmers. Those that use sand for bedding need to remove that sand to increase storage size, which adds time and expense. They aim for storage time of 5 - 7 months, but one farmer noted he only had four months of storage available. A wet year such as 2023 increases the amount of precipitation entering the tanks/lagoons, further reducing storage time.
Nutrient Management Challenges
In reviewing interviews conducted as part of our 2018 SARE funded project, we noted that most of the farmers primarily relied on their own livestock manure for fertility management. Several of the farmers utilized rotational grazing of animals on pasture, as well as crop rotation and cover crops, to supply their nutrient needs. Several of the farmers also purchased additional fertilizers and amendments such as a 26-0-26 synthetic fertilizer or a 20-5-25 mix. One farm used the organic mix “Pro-Grow” (5-3-4). Some also used alfalfa and soybean meal as high-N fertilizers. One also used fish emulsion as a foliar feed. Several had also used biosolids. Many of the farmers reported that they do not get enough nutrients for their farms from their own livestock manure. Several had developed bartering relationships with other farmers, exchanging animal feed for manure, for example. The prospect of additional source of nutrients was attractive, especially a high N fertilizer for grass crops, corn, and hemp. That project was exploring the use of urine as a high-nitrogen addition, which most found a potentially beneficial supplemental source of nitrogen. One expressed interest in adding urine to his liquid manure storage so as to increase its nitrogen content.
Farmers interviewed for the 2018 project also had a preference for a local product (in that case, urine) and for “closing loops.” One commented in this regard, “The price we are paying for synthetic fertilizer doesn’t include all the externalized societal costs. Recycling something locally could potentially reduce some of those impacts.” This philosophical preference for re-using a local product that has been considered "waste" was reiterated by several of the farmers participating in the current project.
Most of the farmers interviewed for this project have nutrient management plans and make nutrient applications based on soil tests, live tissue sampling, and the recommendations of their nutrient management advisor. However, all noted that they also make decisions based on their observations of their plants (color and robustness) and their knowledge of crop nutrient needs, as well as soil type. Soil health was generally evaluated by noting how well crops performed; water infiltration and water holding capacity; degree of compaction; organic matter as indicated on soil tests; and whether or not there was significant erosion. While microbial life was of interest, none of the farmers emphasized this as a soil health indicator (although several noted that high organic matter was likely correlated with helping beneficial microbes.)
Most of the farmers interviewed worked hard to reduce the amount of fertilizers they needed to buy in. These efforts include crop rotations and cover cropping or interseeding. All the farmers used their own manure, and aimed to practice good manure management to maximize nutrient availability and avoid nutrient losses. For organic farmers, added fertilizers and amendments included Chilean nitrate, feather meal, lime and wood ashes. For the conventional farmers, added fertilizers and amendments mentioned included urea, CoRoN (a controlled-release liquid nitrogen product), and sulfur.
Some farmers do not have sufficient manure production on their own farm to meet their nutrient needs, so they either buy in manure from other farms, trade feed for manure, or use more commercial fertilizer, though that is not desirable due to the expense. The organic farmer noted that he hoped to not have to use any Chilean nitrate or feather meal in the future due to cost. With regard to manure management, one farmer noted that better ability to aerate and/or agitate the storage lagoon would be advantageous to better mix the solids into the liquids, but this farmer needed to rent a manure agitator boat for this purpose, which was expensive, on the order of $300/hour.
The timing of manure and fertilizer applications varied. One farmer was able to cut hay four to five times per season and applied manure after each cutting so every 30 days from the end of April until mid-November, while another farmer only made two applications per year (spring and fall). One farmer noted that they only agitated their liquid manure storage on the day they were going to spread so as to avoid breaking up the seal or crust that formed on the top of the slurry, helping to prevent nitrogen losses.
Applications on grassland cannot be incorporated, so farmers noted that anything to reduce ammonia losses would be very helpful for these applications.
Motivations
All the farmers interviewed expressed strong interest in retaining nitrogen for fertility (high quality forage), as well as economic and environmental considerations. As one farmer put it, "We're interesting in anything that could benefit our crops and minimize environmental impact." Another commented "Anything we could do to help retain nitrogen is money in the bank for us." With regard to economic issues, the high cost of nitrogen fertilizers was frequently mentioned; for organic farmers especially, obtaining sufficient nitrogen at an affordable cost was cited as a reason bioacidification was intriguing, as urea cannot be used on organic farms.
While some farmers already add paper fibers to manure, whey appeared to be a more attractive additive to manure storage, primarily because of perceived ease of application. One farmer noted that adding paper fibers could create more of slurry which was not what he aimed for. He noted, "it would be much easier to add [whey] because we're looking for liquid anyway, and sometimes we have to add additional water to our liquids… to get enough to pump and make the manure pumpable, so adding liquid like that would be a good choice." Whey was also looked upon favorably because farmers believed it would supply additional nutrients. (One farmer noted that years ago, when Grafton Cheese had excess whey and needed to dispose of it, they added it to his manure pit. He did not recall whether this provided significant benefit, but it contributed to his positive perception of whey as an additive.)
Farmers also wanted to be sure the paper fibers would not add contaminants, such as PFAS.
Although urine as a fertilizer was not discussed in any depth in these interviews, some farmers also expressed interest in adding urine to their manure storage to add liquid (for ease of application) while also increasing nitrogen and other nutrients.
Concerns
- The most significant concern mentioned was storage capacity of their systems. Storage capacity is an ongoing difficult issue for farmers who store liquid manure, particularly for farmers in Vermont who are prohibited from spreading between December 15 and April 1. One Vt farmer rents land in New Hampshire and so is able to spread there when the tank is too full, but concern about capacity was mentioned by all but one farmer interviewed.
- The next concern was the potential cost and availability of these additives. Whey was perceived as likely to be available and the cost of "waste" whey from cheese plants was expected to be minimal; however, this would need to be determined. Paper fibers have different prices depending on the type of paper used, so farmers would need to know the cost and were less likely to utilize this depending on affordability. Availability of the appropriate amounts at the appropriate time was also a concern. Farmers also wondered whether the bioacidification process would complicate the timing of manure application, which must be done to match the timing of plant nutrient needs.
- With respect to paper fibers, farmers expressed concerns about chemicals that might be present in the paper (such as dyes), as well as chemicals used in the processing of paper fibers to break them down. Several also mentioned worries about potential PFAS contamination of paper fibers. One also mentioned wanting to know the source of the paper fibers including whether hardwood or softwood, anticipating that these would have different consistencies, acidity levels and/or nutrient make-up. One farmer who currently uses short paper fibers as a bulking agent for manure in the barn commented that he used it because it was available for free; he noted that when this manure was used in the field it caused a lag in nutrient availability, "because it takes nitrogen to break that down," so this farmer wondered if adding paper fibers to his stored liquid manure might result in a similar lag in nitrogen availability to plants.
- Certified organic farmers would need to verify that anything added was appropriate or approved by both the federal National Organic Program and the state certifying agency. With regard to whey, farmers thought the questions to be addressed would include anything added to the milk to make cheese - i.e. what is in the rennet or the coagulants. With regard to paper fibers, certifiers would need to know what chemicals had been used to turn wood pulp to paper or to process the fiber product. It was thought that whey would be more likely to be approved than paper fibers.
- Paperwork and Permitting: Farmers expressed a strong desire to avoid the need for additional paperwork or permits for these additives. They would be interested in using them if doing so would not create additional permitting requirements for them. As one farmer put it, "the department of agriculture needs to accept it and have it on the books and say this is a best management practice and you guys are free to use it, you know what I mean?"
Research and information needs
In order to consider using these additives, farmers would need to know the specific nutrient analysis of the liquid manure after added whey or paper fiber, and the forms of nitrogen that would result. They would also want to know the nutrient analysis of whey to determine what other benefits might be obtained in addition to nitrogen retention. Some farmers would want to see an analysis of whey for potential contaminants, such as pesticides, chemicals, or antibiotics.
They would want to consider a cost-benefit analysis that included:
- Value of added nutrients
- Cost of additional equipment required
- Cost of additional labor or trucking
Some additional questions and curiosities:
No-till systems: Some farmers with no-till systems are double-cropping with different cover crops, but noticing a higher need for nitrogen with the second crop. Could whey-enhanced manure (or urine-enhanced?) be a good application prior to the second crop? Many farmers have moved to no-till systems, but are concerned with N loss on application because incorporation is not possible. Would bio-acidification help with this?
- Type of bedding used and how this might influence consistency of manure in storage, and difficulty of agitation.
- Some farmers are already using paper fibers with bedding: can this be added to manure storage, and if so, how would it affect ease of agitation and nutrient availability?
- Different agitation equipment that would best facilitate adding whey or paper fibers
- Are there any potential paperwork and permitting considerations?
- What, if any, concerns might milk buyers or landowners (of rented fields) have about these additives? It was noted that milk buyers (such as the coop, Dairy Farmers of America) were asking more questions of farmers recently about their practices: "[T]hey’re just going deeper and deeper every year with how much they want to know about us…. They want to be able to tell their customers [that] all of our farms are doing x, y, and z to make sure that you have the highest quality product, you know. It’s all about the sales and maintaining the customers and educating all the people that don’t know what we do every day, you know."
- Application equipment: Would any different equipment be needed or useful? Ex: drop tube attachment to sprayer systems for applying liquid manure when corn is finishing in August, importance of not clogging nozzles in this system
- Could NRCDs or other programs provide cost-sharing to enable farmers to retrofit equipment if needed and/or increase storage size to accommodate bioacidification?
Although farmers mentioned that they would like to see field trials of one or two years to learn how bioacidification of liquid manures actually works in practice, two of the farmers said they'd be happy to try using whey on an experimental basis. One said, "We’re usually game for stuff so… if I have storage space we would be open to…specifically the whey. I mean I gotta believe that if I had storage, whey would be a benefit to us….whether it’s nitrogen or organic matter it’s gotta bring something." Another commented, "Basically, it’s reusing what we’ve got to get rid of anyway, and if you can make it something valuable, then yeah."
When asked if they thought their customers or buyers would have concerns, one farmer commented "I think they trust us and most people …when they’re buying our milk… they’re buying local, they’re buying from a neighbor, from a friend, a trusted source…. If anything they might be encouraged and especially if [the whey is coming from a local source, they'd say] 'you know it’s local and anything that can help you we’re supportive of, you know.'"
Overall conclusions
Based on interviews with farmers, there is farmer interest in bioacidification of dairy manure using whey or short paper fibers in order to reduce ammonia losses from liquid manure applied to farmland in the Northeast. Farmers also reported interest in this as a beneficial way to reuse "waste" materials available locally. For manure or manure digestate, the benefits are probably greatest with material that has high solids content and is applied in a no-till context, because these factors result in the material spending a long time on the surface of the field without being incorporated into the soil, therefore risking nitrogen losses through volatilization.
The most often-reported farmer concern on dairy farms was manure storage capacity. Many farms reach capacity over the winter months and have no room for additional whey or paper fibers during that period. For these capacity-limited farms, the addition of bioacidification additives would be more practical in the summer, when manure storage volumes are typically lower. This bioacidified manure would be applied to fields in the fall or summer–which fortuitously is a time when ammonia volatilization risk is higher due to warm weather, and when bioacidification would therefore give more benefit.
The next-greatest farmer concern related to the cost of procuring whey or paper fibers and the cost (labor or equipment) of incorporating them into their stored manure. Mixing manure and additives on a daily basis, prior to addition to the storage system, appeared to be the most viable way to combine them. (On some farms there is already an intermediate tank between the barn and manure storage tank, which could be used for mixing.) It was impractical to add a large amount of additive to the manure storage at one time and then agitate the entire storage, due to labor and fuel consumption, even on farms that possessed appropriate equipment.
Between whey and paper fibers, whey was the preferred additive among the farmers interviewed. Farmers generally perceived whey as potentially contributing additional nutrient benefits, while paper fibers brought up more potential concerns including possible PFAS contamination. On the other hand, farmers already using paper fibers to bulk up manure in the barn, may benefit from adding this material to their manure storage through bioacidification.
A key conclusion was that on farms with cheesemaking operations, the regular addition of the resulting whey to the manure storage system would be an ideal way to manage the whey and reduce ammonia volatilization at the same time. When manure storage capacity allows it, adding on-farm-generated whey to the manure storage rather than directly land applying it could be a good way to reduce ammonia volatilization. Farmers who import manure from other farms to meet nitrogen demands could also be especially positioned to benefit from bioacidification using whey, because bioacidification would better utilize the nitrogen in on-farm manure, and could offset some of the labor and expense of transporting large volumes of manure.
In the laboratory study, all the recipes tested were effective to some degree at lowering the pH of the urine, digestate, and manure. Acid whey was more effective than sweet whey in achieving acidification in all but the highest rates of addition (in which case they were comparable). Inoculating the mixture with a microbial culture had a large beneficial impact with urine, but not with liquid manure or digestate. Digestate required higher additive rates to achieve acidification, compared with urine and liquid manure.
6.25% and 12.5% additions of acid whey (62.5 and 125 gallons of whey per 1000 gallons of manure) provided the most benefit per unit of additive used. These relatively low addition rates are also desirable to farmers, who emphasized the need to minimize the addition of extra volume to their manure storage systems. These two facts suggest that low rates of acid whey addition may be the most cost-effective and practical way to implement bioacidification on dairy farms. That said, paper fibers and sweet whey also were effective and, depending on cost and availability, could be more cost-effective in some settings.
There was strong farmer interest in bioacidification, with some farmers interested in trying it on an experimental basis with whey even before further study. The lab testing suggested that under the right conditions, bioacidification could have a large impact on reducing ammonia volatilization. Taken together, the laboratory results and farmer viewpoints build a strong case for further investigation of this approach.
Education & outreach activities and participation summary
Participation summary:
Webinar: We hosted a webinar on September 7th to share results from the lab trials and farmer-partner assessment of the bio-acidification concept. (Webinar flyer: BlogFlier_Reducing-On-Farm-Ammonia-Loss-From-Manure-through-Fermentation-Using.) The event included a panel with our farmer-partners and collaborators, as well as Rich Earth researchers. Seventeen people were registered for the event in addition to the researchers, partners and advisors. (We did not note if all of these actually attended, but all registered received a recording of the event.) In addition to presenting our results, we invited participants to offer feedback and highlight any concerns or additional research needs to include in followup research. Attendees included farmers, other researchers and ag educators, environmentalists, and land care specialists.
Upon learning of the lab results, both farmer-partners were supportive of the concept, and eager to continue participating in research related to this topic. Leon noted that a cost-benefit analysis of nutrients saved (or added, in case of whey) versus the fuel and labor costs of the additions would be needed. He would also like to see on-farm applications and their results to see how the lab results translated into practice.
Leon also suggested that if this method of nutrient retention becomes feasible, perhaps NRCS would be interested in providing cost-share grants to help farmers increase the storage capacity of their systems.
He also pointed out that as an organic farmer, he would have to have any additives such as whey approved by Vermont Organic Farmers for potential pass-through contaminants in the whey (such as pesticides, chemicals, antibiotics). He suggested checking with VOF to determine whether this could be a concern. With regard to paper fibers, they are not currently used on organic farms. Leon also reiterated his speculation that with his current storage capacity, the most likely timing for addition of whey would be in summer for his fall field application.
Pete Stickney noted ongoing research on this topic on his farm might be difficult because it is hard to quantify nutrient levels in the lagoon because the amount of rainwater varies widely. However, he was convinced by the research results that “we [will be] doing the right thing, adding our own whey, or adding additional whey” when the new larger lagoon is built. He would be interested in adding acid whey and speculates that Cabot Cheese and Grafton Cheese both have excess whey that they need to get rid of due to reduced numbers of farms in surrounding areas to land apply the whey.
Bradley Kennedy (board member of Rich Earth and involved in conceptualization of this project) noted that since ammonia volatilization was a more significant problem in warmer weather, summer addition of whey or paper fibers for fall application did make the most sense.
Joanne Chickering, a sales representative with RMI (who supplies paper fibers to farmers) noted that the PFAS level in paper fibers is tested regularly, and is not higher than background levels in soil. Nonetheless, organic farmers currently are not using paper fibers.
Tom Beaudry supported the point that storage capacity would limit most farmers to fall applications. He was particularly interested in the results with the addition of biostimulants and would like to see further research on this.
We also presented our research results in the “Urine Fertilizer in Agriculture” Panel at the Rich Earth Summit on Urine Reclamation, which had 52 in-person participants and 203 virtual participants. The panel was recorded and posted on the Rich Earth Summit website, available at: https://www.richearthsummit.org/2023recordings
In addition, we plan to share our findings with an academic audience by submitting our results for publication in a journal such as the Journal of Environmental Quality or Agrosystems, Geoscience and Environment.
Through our internship program, several college students have participated in this study as a learning opportunity. In summer 2022, University of Dayton Emma Allington presented about her involvement with this research and preliminary findings to the ETHOS (Engineers in Technology and Humanitarian Opportunities of Service) Center. Summer 2023 intern, Ella Ball, from Williams College assisted with honing interview guides, interviewing and transcribing social research interviews. 2023 Eco AmeriCorp Service Member from the College of Wooster also assisted with transcription.
Throughout this project, we have shared updates about our research in our quarterly newsletter (Spring and Fall 2023), blog, and on social media. We also regularly host tours of our Research Center, which includes a stop in our laboratory and an introduction to our current research projects, including this bioacidification research.
Learning Outcomes
The farmer-partners both reported significant changes in their understanding of this concept and its potential application on their farms. The six additional farmers interviewed for the project learned about it and would consider using these additions if feasible and if the cost/benefit analysis was positive. Two farmers at one farm with a large storage tank were confident this would be both feasible and a positive addition to their operation.
Project Outcomes
Eight farmers (our farmer-partners plus six additional interviewees) learned about this method and all expressed interest in further research and demonstration of its benefits. In addition, 17 people attended or received copies of our webinar with details of the lab results. Also, over 100 people attended the presentation of research results at the 2023 Rich Earth Summit.
Major areas requiring further study are:
- Testing in a farm environment, in a full-size on-farm manure storage system, or in a smaller storage tank in on-farm conditions
- Field trials measuring actual ammonia loss from bioacidified and unamended manure/digestate/urine
- In-depth analysis of cost and benefits
- Investigation of whether methane emissions are increased through whey or paper fiber addition. (This could be a benefit in anaerobic digesters, but an environmental drawback in open manure pits.)
Citation List
Adams, Christina. Resource Management Inc., Holderness, NH. Personal Communication (10/9/2020).
EPA. 2020. Inventory of U.S. Greenhouse Gas Emissions and Sinks: 1990-2018 https://www.epa.gov/ghgemissions/inventory-us-greenhouse-gas emissions-and-sinks-1990-2018
Hjorth, M., Fernandez, M.S., Jayaram, S., Sørensen, J.A., Adamsen, A.P.S., 2015. Bioacidification of manure – By supplying manure with 2-3% sugar or cellulose, in: RAMIRAN - 16th International Conference, “Rural-Urban Symbiosis.” Hamburg, Germany. 338–341.
Johnson, Laura. UVM Extension, St. Johnsbury, Vt. Personal Communication (10/14/20)
Kennedy, B. (2018). Bio-acidification of livestock slurry with soy molasses. University of Copenhagen.
Ketterings, Q.M. and K.J. Czymmek. 2018. Nutrient Management Spear Program: Applied Research, Extension and Teaching in Nutrient Management for Dairy/Cash Grain Farms Program Update 7/12/2018. Department of Animal Science, Cornell University, Ithaca NY. http://nmsp.cals.cornell.edu /publications/NMSP_7_12_2018.pdf
Ketterings, Q.M., K.J. Czymmek, S Gami, G. Godwin and K. Ganoe. 2017. Guidelines for Land Application of Acid Whey. Animal Science Bulletin 247. Department of Animal Science, Cornell University, Ithaca NY. http://nmsp.cals.cornell.edu/publications/files/AcidWheyGuidelines2017.pdf
Lievore, P., Simões, D., Silva, K.M., Drunkler, N.L., Barana, A.C., Nogueira, A., and Ivo M. Demiate. 2015. Chemical characterisation and application of acid whey in fermented milk. J Food Sci Technol. 2015 Apr; 52(4): 2083–2092.
Noe-Hays, A. 2020. Final report for ONE18-318: Practical Strategies for Reducing Ammonia Volatilization from Urine-Derived Fertilizers. Northeast SARE Partnership Grant Program, USDA. https://projects.sare.org/project-reports/one18-318/
Nykänen, A.M., Hämäläinen, N., Kostia, S., Mikola, J., Romantschuk, M., 2010. Reduction of Odorants in Swine Manure by Carbohydrate and Bacterial Amendments. J. Environ. Qual. 39, 678. https://doi.org/10.2134/jeq2008.0530
Prado, J., Chieppe, J., Raymundo, A., and Fangueiro, D. 2020. Bio-acidification and enhanced crusting as an alternative to sulphuric acid addition to slurry to mitigate ammonia and greenhouse gases emissions during short term storage. Journal of Cleaner Production. 263.
Sáez-Plaza, P., Michałowski, T., Navas, M. J., Asuero, A. G., & Wybraniec, S. (2013). An Overview of the Kjeldahl Method of Nitrogen Determination. Part I. Early History, Chemistry of the Procedure, and Titrimetric Finish. Critical Reviews in Analytical Chemistry, 43(4), 178–223. https://doi.org/10.1080/10408347.2012.751786
SARE ONE 18-318, Practical Strategies for Reducing Ammonia Volatilization from Urine-Derived Fertilizers https://projects.sare.org/project-reports/one18-318/
Subair, 1995. Reducing ammonia volatilization from liquid hog manure by using organic amendments. PhD thesis, McGill University, Montreal.
USDA. 2020. Census of Agriculture: 2017 Census Volume 1, Chapter 1: State Level. National Agricultural Statistics Service. https://www.nass.usda.gov /Publications/AgCensus/2017/Full_Report/Volume_1,_Chapter_1_State_Level/
Vermont Agency of Agriculture, Food and Markets staff, Montpelier, VT, Personal Communication, 10/19/20