Progress report for SW20-914
Project Information
44,000 family forests cover 3.3 million acres in Oregon and Washington; 74% “have good stewardship attitudes but are not highly engaged in managing their land” [1]. Social science research identifies shortfalls and calls for experimentation with modern technology and marketing to better engage landowners [2]–[5]. Preparing a Forest Management Plan (FMP) may involve days-to-months navigating dozens of websites, learning software, or visiting offices, and remains a challenging prerequisite for cost-share or incentive programs or to justify investments in forest management or acquisition decisions. Mapping and characterizing a property’s forest stands remains a particularly costly and time-consuming bottleneck.
Our motivating research questions are:
- Can machine learning models trained with publicly-available imagery, lidar, climate, and soils data produce actionable maps delineating and characterizing forest attributes required for FMPs (e.g., dominant tree species, size, and abundance)?
- Beyond basic FMP requirements, which attributes sought by owners and managers to assess forests and make confident management decisions can be adequately modeled or easily recorded with ubiquitous technology (e.g., smartphones)?
- Will a user-friendly web app delivering forest information reduce time and effort for FMP completion? Will it facilitate increased landowner awareness or adoption of new management and conservation practices?
Following best practices to coproduce actionable science, our team will involve stakeholders and end-users (landowners and foresters) throughout the project, including qualitative research to define user needs and requirements, assessing models that estimate forest conditions, honing tools deemed suitable for broader use, and delivering them with web technologies and extension activities.
We will engage stakeholders who develop and review FMPs to ensure our deliverables comply with relevant formatting and data sufficiency requirements. Producer Advisors will participate in qualitative research including interviews with forest owners and managers in Oregon and Washington to clearly define User Needs, Use Cases, and Functional Requirements for new tools and technologies. We will then train, document, and publish open-source machine learning models using hundreds-of-thousands of plots and stand-delineations from public agencies across Oregon and Washington, apply them to generate predictive maps of basic forest conditions, and refine our models following forester and landowner feedback and ground-truthing. Based on our research, we will integrate new features/products into existing open-source web apps to serve maps and tabular data that auto-populate relevant sections of a FMP template.
Our work will lead to the following outcomes:
- A benchmarking dataset with hundreds of thousands of forest observations alongside corresponding 2D and 3D remotely-sensed data enables rapid advances in state-of-the-art forestry and computer vision applications and a repository open to comparable data from other regions.
- An open-source framework for data processing, model-fitting, and predictive forest mapping demonstrated across Oregon and Washington facilitates replication in other US regions.
- An equitable coproduction process motivated by needs and interests of non-industrial forest owners provides new technologies and resources that increase landowner awareness and adoption of forest conservation and management activities.
This project is organized around five objectives:
- Employ an equitable and inclusive process to co-produce actionable science. Diverse stakeholders are engaged throughout the entire research cycle including problem definition, methodology, interpretation of results, and extension activities. This involvement ensures science-based outcomes and products are salient, credible, and legitimate [12].
- Establish a large benchmarking dataset for machine learning and remote sensing applications in forestry. Extensive data covering most of Oregon and Washington including stem-mapped plots, stand delineations with corresponding inventory data, aerial and satellite imagery, lidar point clouds and lidar-derived raster and vector layers, and other climatic and environmental layers. Data provenance, formatting, and processing will be clearly documented along with reproducible computing pipelines allowing others to submit new data.
- Establish a reproducible pipeline for generating actionable maps and supporting data delineating and characterizing forest stands throughout Oregon and Washington. This will include fundamental attributes such as species composition, size class, stocking level, and other forest structure attributes, as well as an assessment of this approach for additional indicators such as timber value, fire and forest health threats, and wildlife habitat suitability.
- Reduce the time and expense for non-industrial forest owners and managers to assess forest conditions, conduct forestland valuation, and develop management plans. Deploy user-friendly open-source technology focused on serving Tribes, consulting foresters and NRCS Technical Service Providers, and family forest owners with actionable forestry information.
- Increase landowner engagement and activation. Increase awareness and use of time- and cost-saving tools to accelerate the learning curve, completion of Forest Management Plans, and adoption of sustainable forest management and conservation practices. Increase landowner interest, preparedness, adoption, and participation in programs that support practices to improve forest health, wildlife habitat, mitigate and adapt to climate change, and reduce pest and wildfire risks.
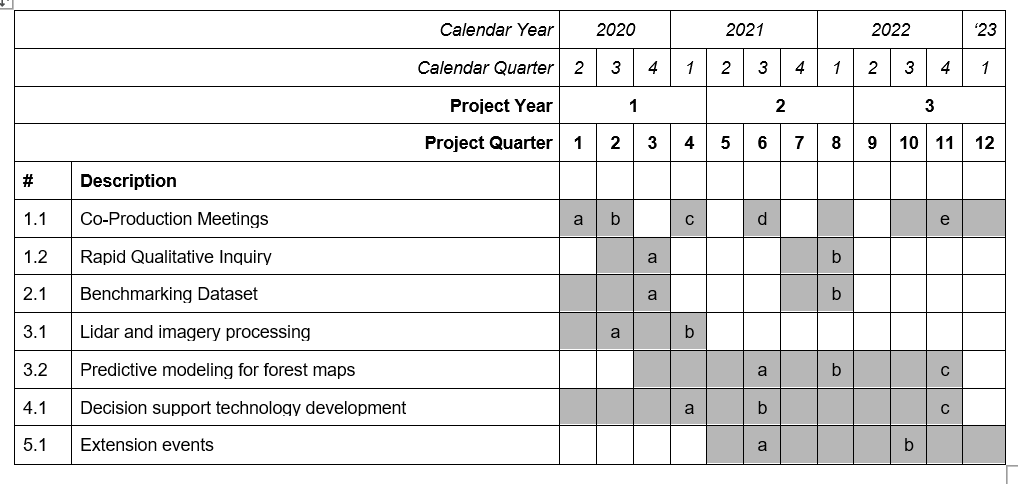
Milestones
1.1 - a) goal-setting meeting; b) workplan meeting; c) science implementation meeting; d) rollout #1 beta version; e) rollout #2 v1.0
1.2 - a) user needs survey work, culminates in requirements; b) user experience beta-testing completed
2.1 - a) training datasets published online; b) journal article describing datasets published
3.1 - a) lidar and imagery datasets processed across OR & WA; b) data processing pipeline migrated to Azure, documented and published on GitHub
3.2 - a) regional forest maps produced; b) journal article describing forest mapping predictions; c) documentation completed on GitHub
4.1 - a) wireframes; b) beta version; c) version 1.0
5.1 - a) Tree School 2021 workshops completed; b) Tree School 2022 workshops completed
Cooperators
- - Technical Advisor - Producer
- - Producer
- - Technical Advisor - Producer
- - Technical Advisor - Producer
- - Technical Advisor - Producer
Research
Our motivating research questions are:
- Can machine learning models trained with publicly-available imagery, lidar, climate, and soils data produce actionable maps delineating and characterizing forest attributes required for FMPs (e.g., dominant tree species, size, and abundance)?
- Beyond basic FMP requirements, which attributes sought by owners and managers to assess forests and make confident management decisions can be adequately modeled or easily recorded with ubiquitous technology (e.g., smartphones)?
- Will a user-friendly web app delivering forest information reduce time and effort for FMP completion? Will it facilitate increased landowner awareness or adoption of new management and conservation practices?
Our related hypotheses are:
- The application of image segmentation and computer vision approaches to tasks of forest stand delineation and typing can produce will produce maps of sufficient quality to be integrated into maps used in Forest Management and Stewardship Plans accepted by State and Federal agencies.
- User Research will indicate a handful of primary use cases for the Landmapper app that will be somewhat consistent/shared among family forest owners, consulting and professional foresters, and other non-industrial forest owners/managers including land trusts and American Indian Tribes with smaller forestland ownership (<5,000 acres). These use cases will include:
- Populating maps and tables to complete Forest Management Plan templates to access/satisfy eligibility for cost-share and incentive programs by State and Federal Agencies.
- Acquiring geospatial data that can be further modified and augmented with additional data in Geographic Information Systems and mobile devices such as the adjustment of forest types and boundaries.
- Learning about the landscape context and conservation priorities around their land.
- Using georeferenced PDFs with mobile applications (e.g., Avenza) to support navigation and data collection in the field.
- A map- and table-generating web app will reduce the time, effort, and expense required for landowners and foresters to complete Forest Management and Stewardship Plan templates.
Objective 1: Equitable Process for Coproduction of Actionable Science
Through the course of three meetings of the project's Advisory Team and numerous meetings by the Project Team, we developed a Co-Production Assessment Plan which laid out the principals and methods for evaluating our efforts to co-produce actionable science. This is a living document which covers: (i) assessing the process of co-production; (ii) assessing the outputs of the project; and (iii) assessing the outcomes of the project.
Objective 2: Produce a Large Open-Source Benchmarking Dataset for Forest Mapping
Through public records requests from several State and Federal agencies with forests in Oregon and Washington, we have acquired plot-based and stand-based datasets representing all the forested ecoregions across Oregon and Washington. The forest observation data have been processed and organized to support easy loading along with corresponding remotely-sensed and other datasets including lidar point clouds, aerial and satellite imagery, elevation and terrain-derived attributes, disturbances detected from historical satellite imagery, and down-scaled climatic attributes.
Data have been organized into hierarchical folder structures and text files that provide quick access to the various data layers accessible for each plot- or stand-based set of forest measurements.
Objective 3: Produce high-quality forest stand maps across the region
Forest observations collected in the field
Measurements of field plots installed by state and federal agencies across Oregon and Washington have been gathered. A total of 3,594 and 3,985 unique plots coincide with available lidar and satellite imagery data, respectively.
From the year of field measurement, these plots have been grown forward using the Forest Vegetation Simulator growth-and-yield model on an annual timestep. When the plot data (measured or grown-forward) corresponds with available lidar or satellite data, the plot is included in the dataset used for model training and evaluation. The following table displays how many observations among these plots are available from each year of lidar and/or satellite data acquisitions.

Predicting forest structure attributes
We trained linear models in two ways using regularization to penalize model complexity using Lasso or ElasticNet methods. We fit three different ML algorithms including k-Nearest Neighrbors (kNN), Random Forests (RF), and Gradient Boosting Machines (GBM). All models are implemented using the scikit-learn Python library and open-source code for reproducing the model fitting, scoring, and application are being released on GitHub in the form of Jupyter Notebooks.
Fore each algorithm, we fit models using all available sensor-derived predictor variables (17 lidar-derived features or 52 satellite-derived features) plus latitude, longitude, and elevation.
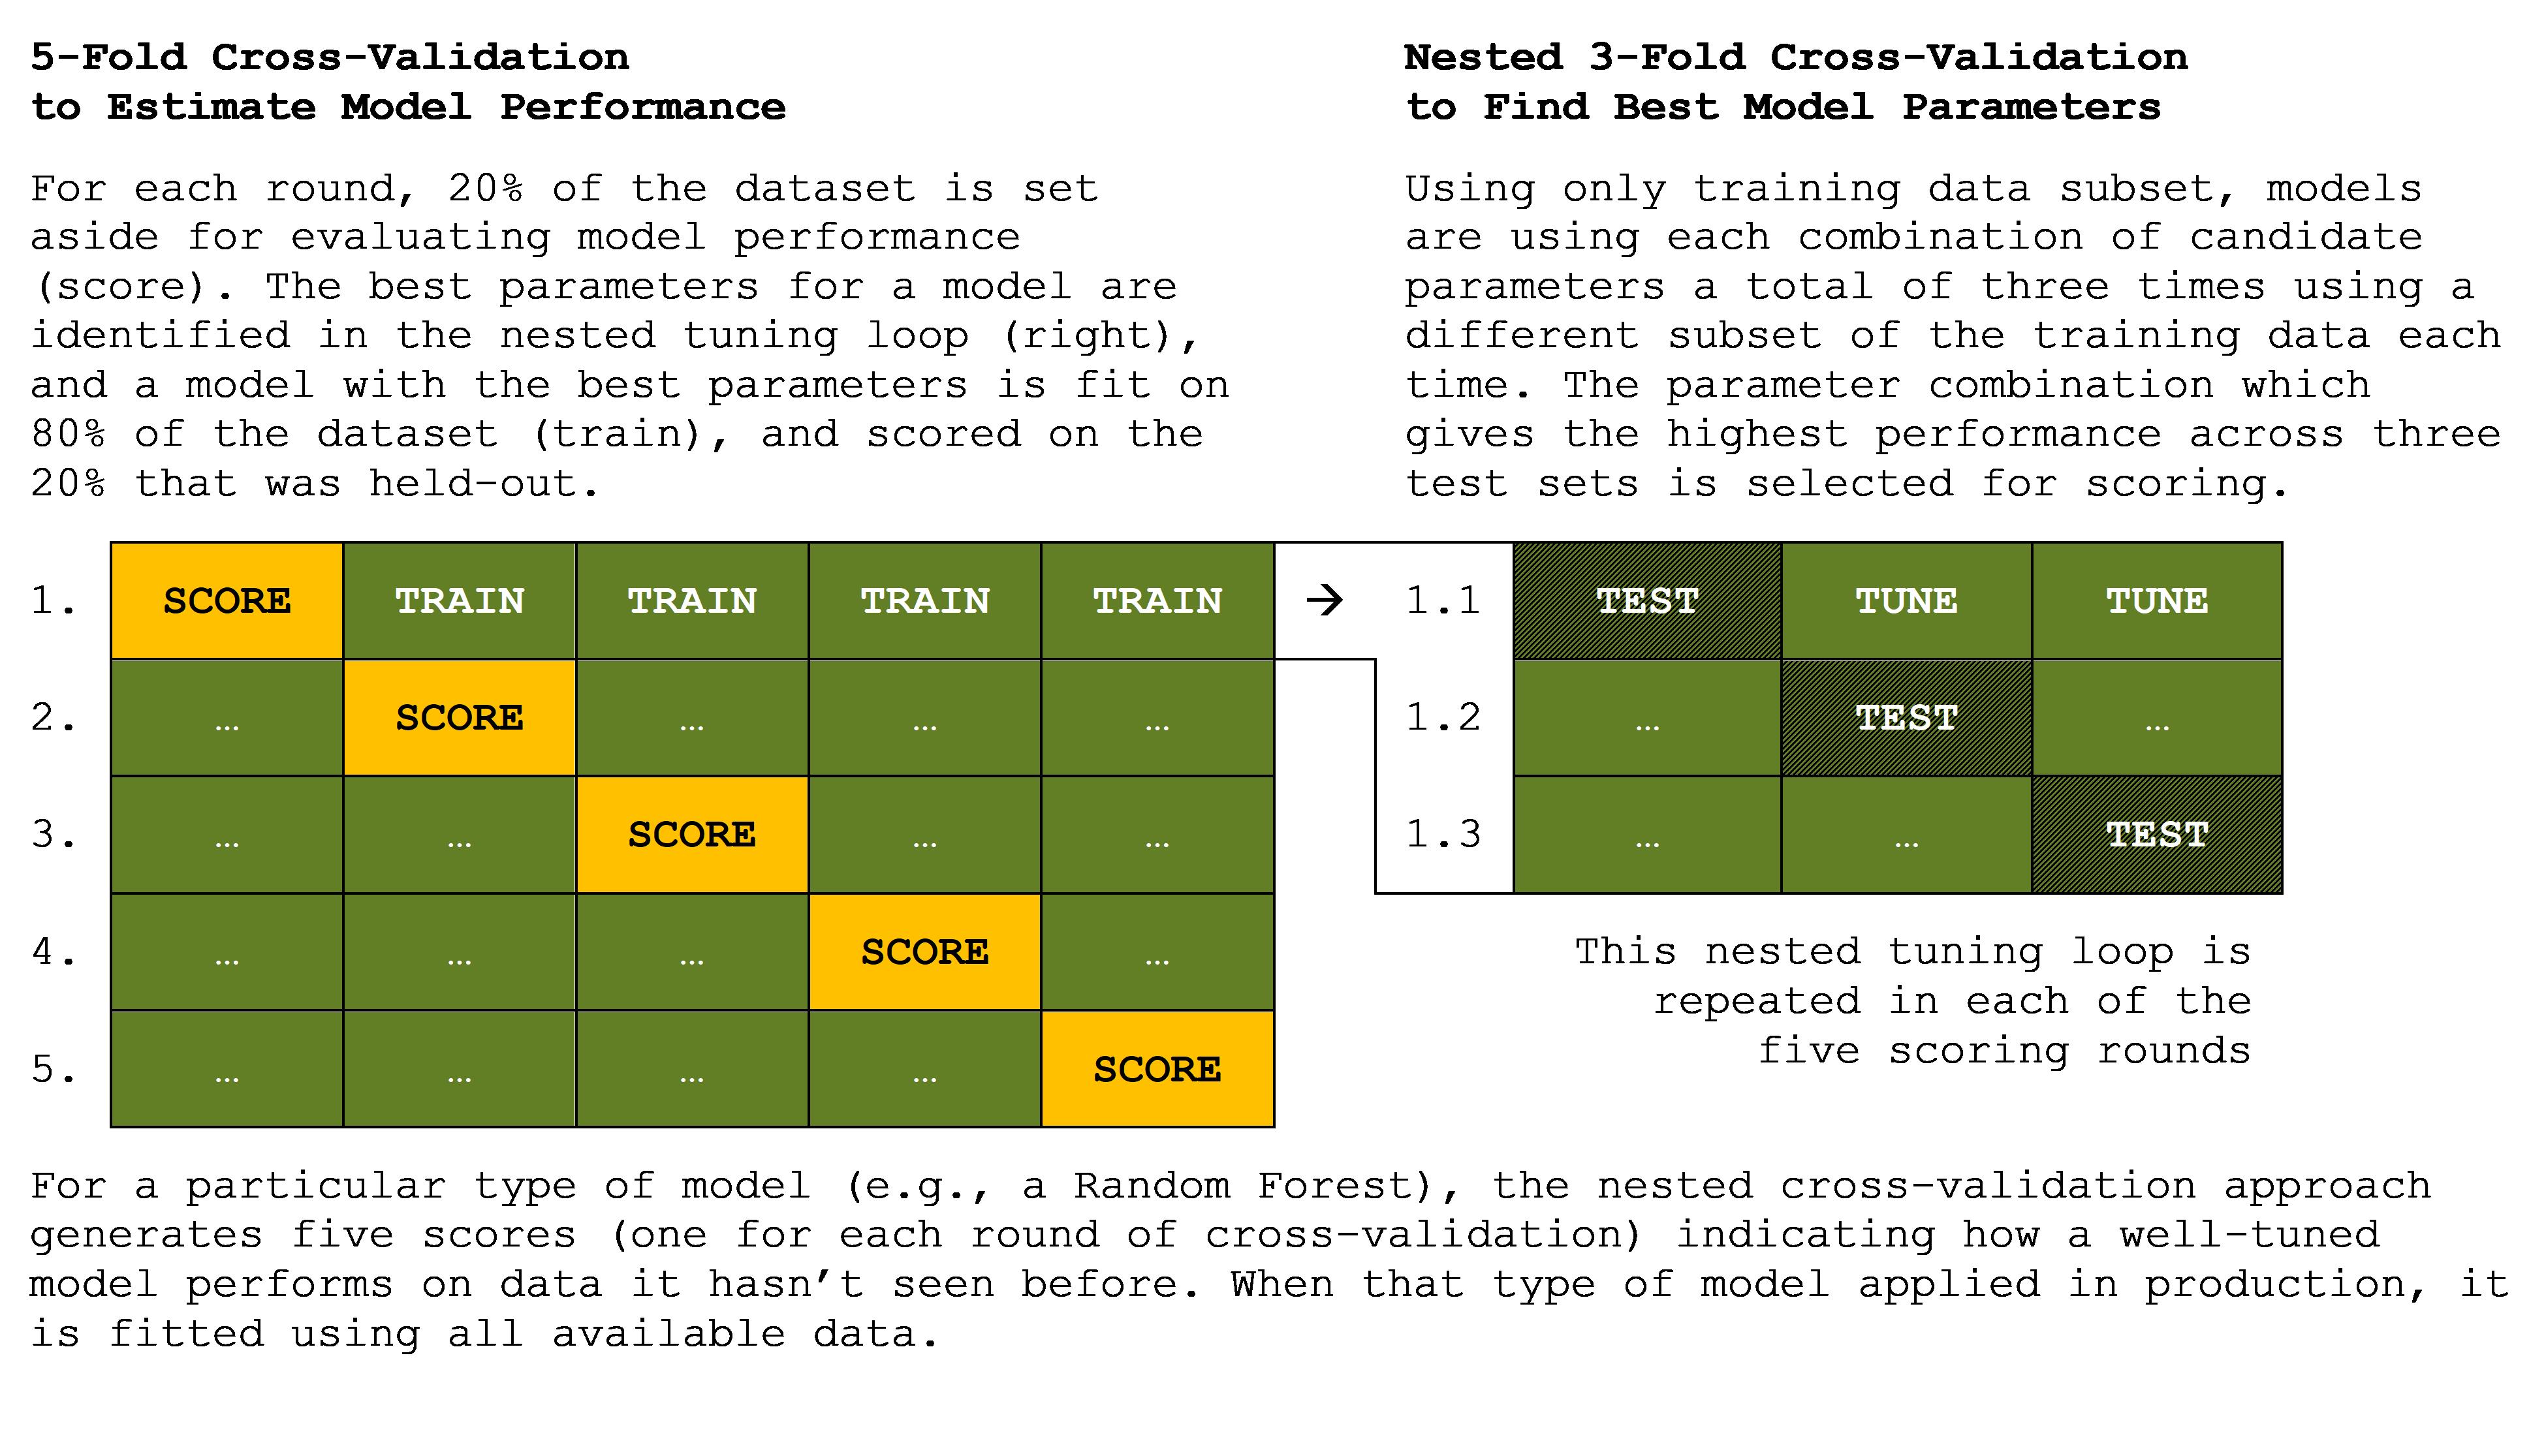
We trained models to predict percent canopy cover, dominant tree height, quadratic mean diameter, Stand Density Index, cubic volume per acre, and aboveground tree biomass per acre using both lidar- and satellite-derived features at the scale of 10-by-10-meter pixels. We employ a "chained" regression approach whereby the first variable in the "chain" predicts canopy cover using the remotely-sensed features only. The second variable in the "chain" (dominant height) uses the remotely-sensed features as well as the predicted values for canopy cover. The third variable in the chain (quadratic mean diameter) is predicted using the remotely-sensed features as well as the predicted values for canopy cover and dominant tree height, and so on. Apart from the convenience of fitting a single model that can return four structural attributes (canopy cover, dominant tree height, quadratic mean diameter, and total cubic volume), this approach also allows the model to exploit correlations between target variables included in the "chain" independently from the remotely-sensed features.
We adopt a nested cross-validation approach to estimate the performance of the various models/algorithms while also allowing the hyperparameters of each model to be tuned. This allows us to estimate the predictive performance of each model type on held-out data when it has been tuned to achieve the lowest predictive errors. This approach is illustrated in the following figure.
 Predicting forest composition attributes
We investigated the utility of a Random Forests model to predict presence and abundance of individual tree species as well as an adaption of the model to perform ordinal classification for the abundance tree species groups (e.g., firs, spruces, pines, cedars, oaks, etc.) as absent, present, abundant, or dominant using satellite imagery. We also trained a model to predict the relative abundance of hardwood versus softwood species from satellite imagery.
Predicting land cover
Because the models to predict forest structure and composition are trained from field observations of forested locations only, the application of these models over arbitrary geographic extents will often include requiring the models to predict conditions over non-forest areas (e.g., water, developed areas, croplands, shrublands, etc.). In non-forest areas, the predictions of our forest structure and composition models will not meaningful. In order to exclude non-forest areas from being mapped with forest structure and composition attributes, we developed a Logistic Regression classification model based on NLCD Land Cover from 2019 with samples across the State of Oregon. We utilized a simplified set of land cover types: water, forest, and non-forested land.
Automating stand delineation
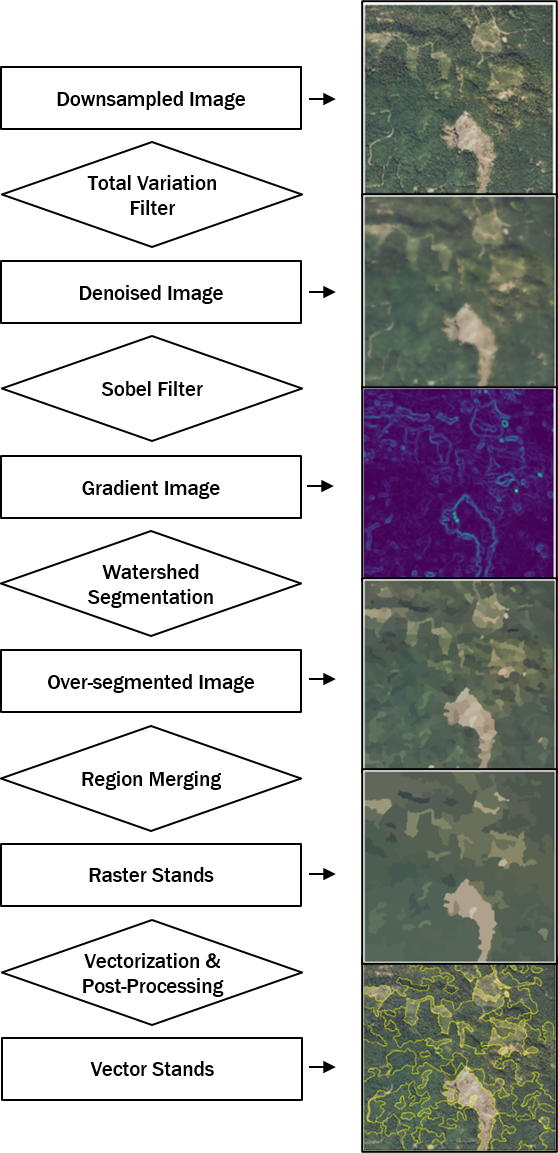
We have implemented a workflow to automate the segmentation of forest stands from aerial imagery following the Size-Constrained Region Merging (SCRM) approach described by Castilla et al. (2008). This approach applies a series involving downsampling imagery (if necessary) to 10-meter resolution, followed by a de-noising filter, and a gradient (Sobel) filter to produce an image depicting how spectral values change over space. The gradient image is oversegmented from seeds placed in local gradient minima using the watershed segmentation approach. The "superpixels" produced by oversegmentation are approximately 1/10-acre in size. A graph is constructed which encodes the adjacency of superpixels and the spectral "distance" between the pixels. A region-merging algorithm is then applied which successively merges adjacent superpixels while honoring constraints including a minimum mappable area for stands, and approaching a mean polygon area.
Although the plot-level training data from state and federal agencies provide an excellent basis for the Project Team to evaluate the precision and uncertainty of forest type predictions across Pacific Northwest ecoregions, the development of property-scale maps for use in Stewardship and Forest Management Plans also necessitates that the maps we produce are judged as credible and practical by foresters and landowners. Over the course of this project, the acceptability of the Forest Type maps we generate was evaluated collaboration with participating landowners as part of beta-testing. The beta-testing was structured so that participants accessed maps of predicted forest attributes for an area of their choosing (within Oregon and Washington) and provide open-ended responses as well as specific survey questions. With the debut of the Landmapper web app in December 2020, the Project Team gathered similar feedback regarding other maps (topographic, soil, stream) and tables through a webinar and online survey which helped identify a variety of bug-fixes and updates to the user interface and underlying data we provide.
Objective 4: Reduce time and expense for forest assessment, valuation and management planning
To inform better understanding of the diverse needs and and potential use cases for forest landowners and managers for new stewardship planning tools and technologies in the Pacific Northwest, we convened a team to conduct User Research through a series of interviews and qualitative analysis.
User-centered design and engineering
As part of the User Research process, our teams have followed a user-centered design and engineering approach, focusing on clearly defining user needs, motivations, and use cases through qualitative research methods, including the application of semi-structured interviews and thematic analysis.
A 2-day training with two academic social scientists with expertise in natural resource social science and user research (Rebecca McLain from Portland State University & Shana Hirsch from the University of Washington) was joined by all Project and Advisory Team members involved in interviews. Following these trainings several Project Team members collaborated to produce a User Research Protocol. This 18-pp document describes the sampling approach, generic interview template, and data handling and processing methods. The User Research Protocol (along with the Co-Production Assessment Plan) were reviewed and updated with the guidance of the Advisory Team in December 2020. Five Project Team members (Jones, Braybrook, Brown, Loreno, Cowherd/Gutierrez) who participated in the User Research workshop formed an Interview Team and are conducting the interviews in pairs.
A generic interview template is used to guide 60-minute semi-structured interviews on topics related to motivation for forest stewardship, challenges involved with gathering information and making decisions, and the experiences and attitudes landowners have had with existing people, organizations, and technologies involved in forest stewardship planning and implementation. These interviews are being recorded and transcribed.
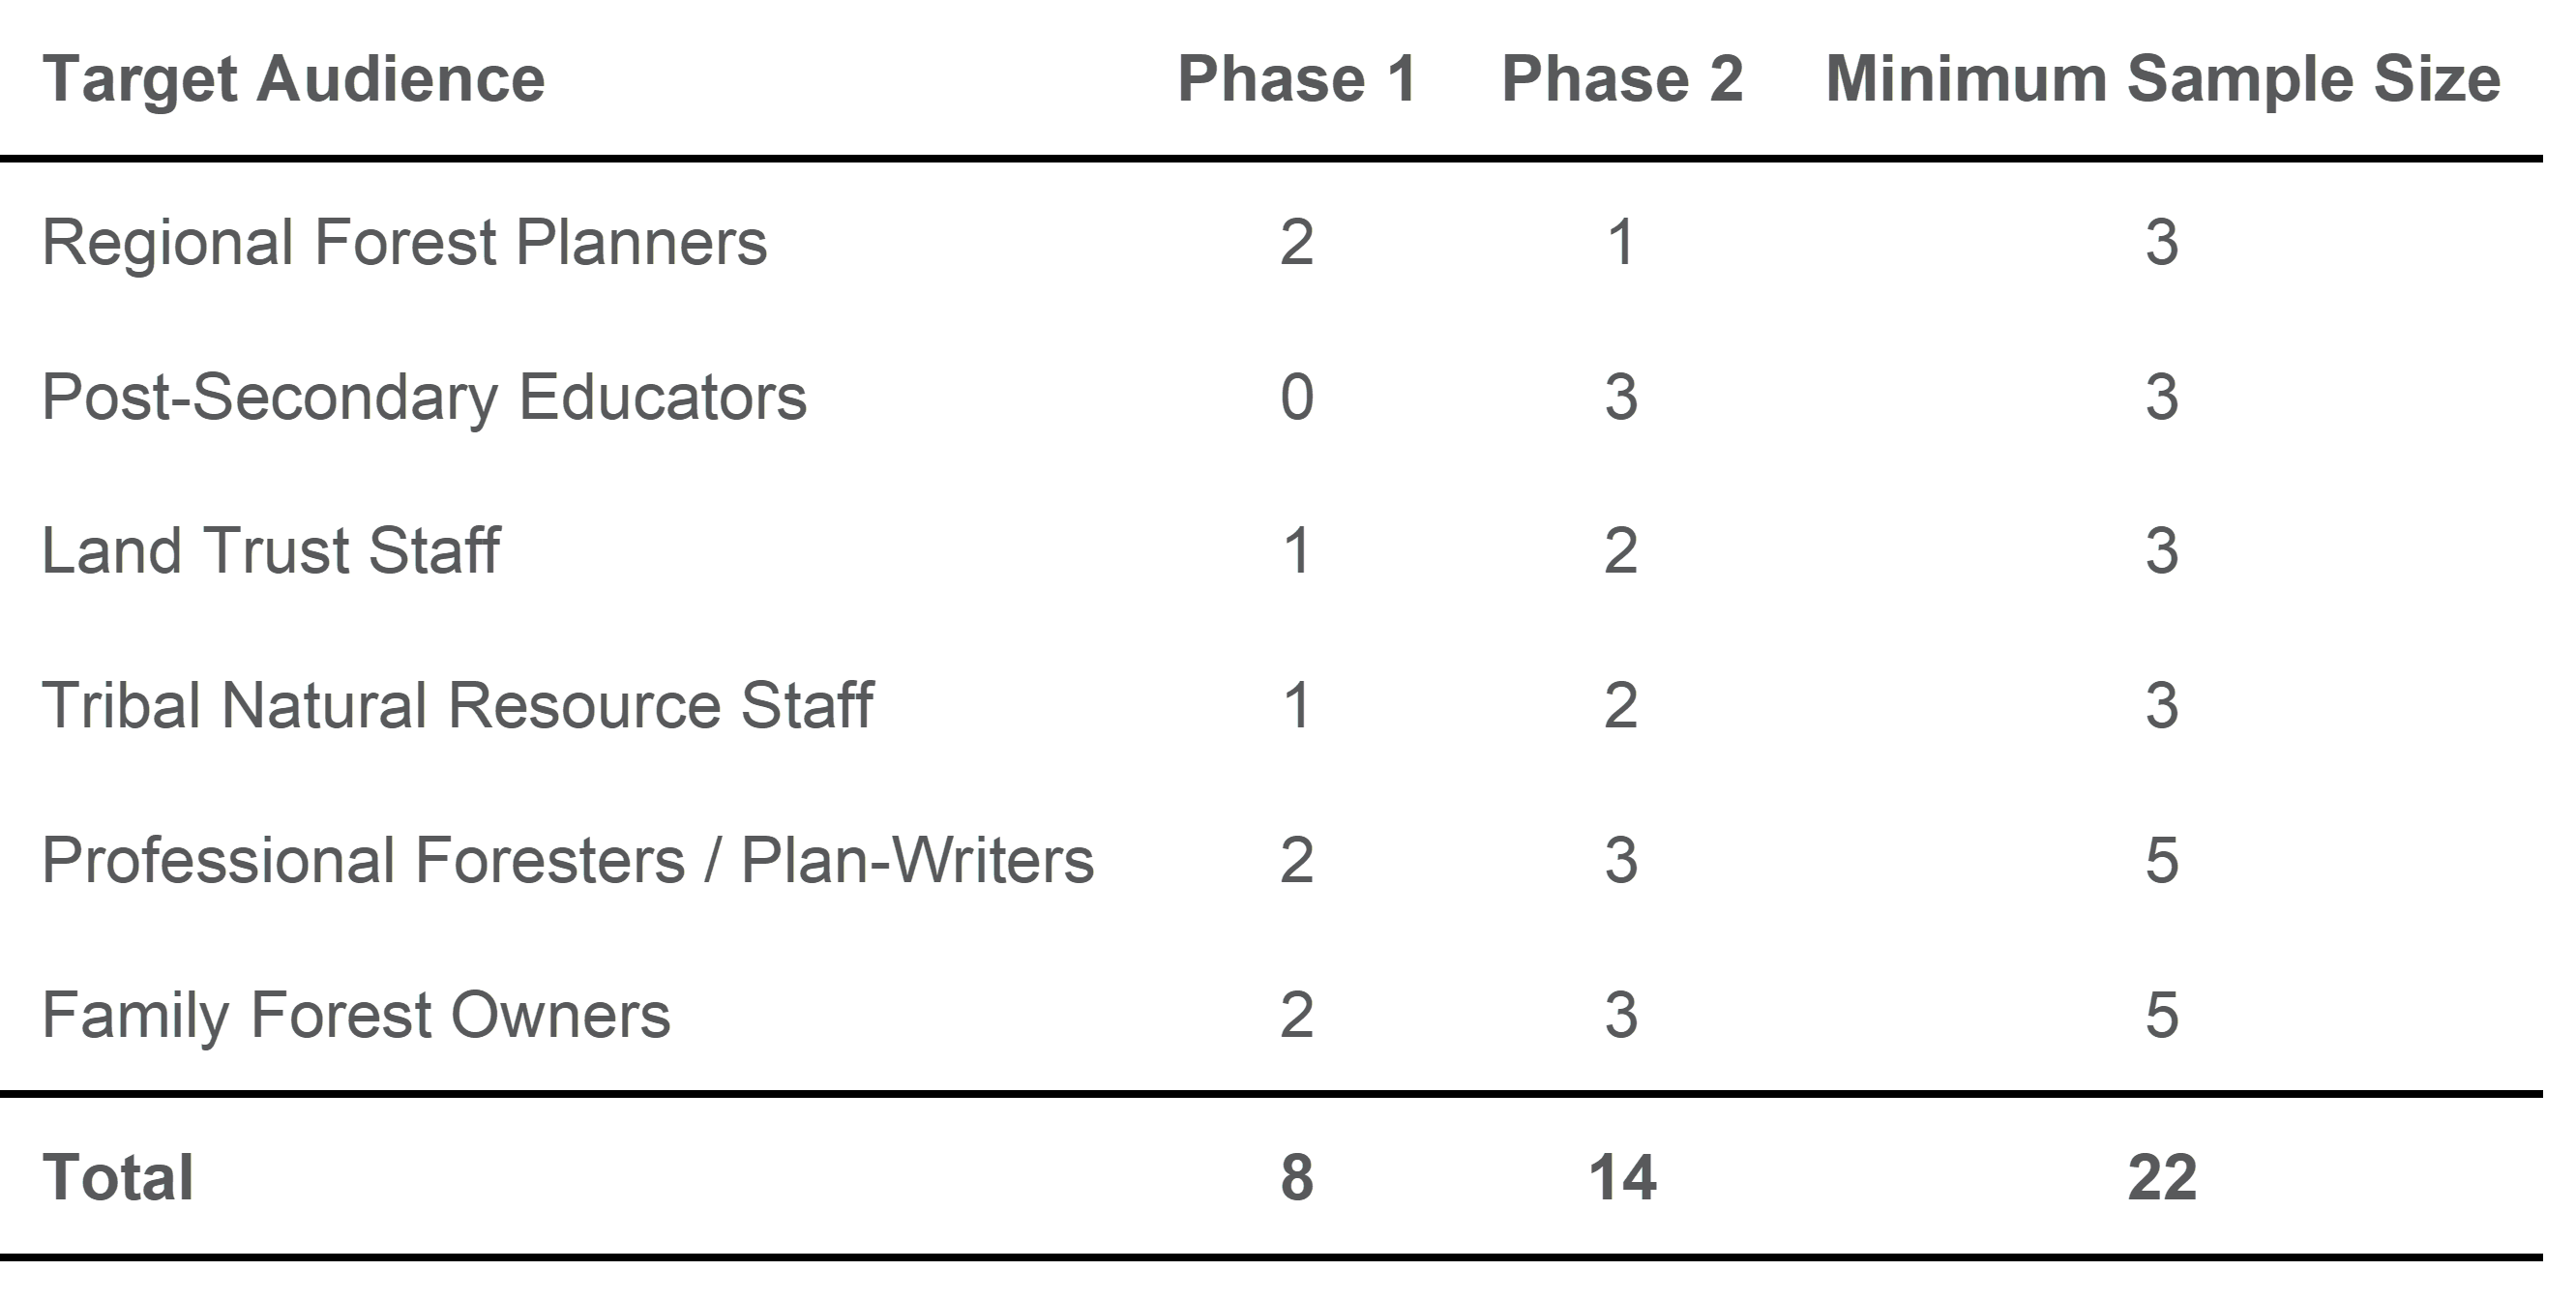
Phase II interviewees are identified through a combination of snowball sampling and referrals by key informants. The Project Team is making an explicit effort to identify potential interviewees from racial and ethnic minorities and to ensure concerns for different forest types in the Pacific Northwest are reflected in the geographic diversity of participants as well.
Following the transcription of recorded interviews, the Interviewers will be joined by PI Diaz to assign codes the interview transcripts to provide the foundation for subsequent analysis. Following the coding of transcripts, several Advisory Team members will participate in the clustering of key themes using an Affinity Diagram approach (known as the KJ Method). These interviews are intended to provide the foundation for the development of a User Requirements document describing the primary types or profiles of users, the main scenarios and use cases for new stewardship planning tools, and the functional requirements that would need be to met for these users to accomplish the primary use cases identified.
Equitable process for co-production of actionable science
Co-production process planning and evaluation
The approach to co-producing research and evaluating the research co-production process was initially drafted by Project Team with collaborators from Ecotrust (David Diaz, Sara Loreno, Stephanie Gutierrez), Wallowa Resources (Lindsey Jones), Northwest Natural Resource Group (Rowan Braybrook) and Michigan State University (Jasmine Brown). The Advisory Team was presented the draft User Research Plan and Co-Production Assessment Plans, and their guidance was re-incorporated into revised Plans.
As part of the preparation for the development of these plans, Project Team participants held small group discussions of Positionality Statements prepared by each Project Team member. This need to address researcher positionality is increasingly recognized among social science researchers as a means to explicitly acknowledged and navigate the diverse perspectives, biases, and interests that each of the researchers brings to the project. These statements and discussions also provide a forum to identify and discuss how power and privilege show up in the research process, and to consider how this team of researchers can build on this increased awareness.
The approach to research co-production was grounded with discussions of the Project Team of foundational concepts for the production of actionable science (e.g., Cash et al., 2003) and emerging best practices in the field (e.g., Beier et al., 2017). The development of a Co-production Evaluation Plan was guided by the example provided by Wall and colleagues (2017).
Five core principles were defined in the Project's Co-Production Assessment Plan:
- Honor those who have come before. Acknowledge and build upon the knowledge, efforts, and products of others who have already contributed significant time and energy to these topics. Do not reinvent their products or needlessly duplicate their work.
- Motivate new work by user needs and interests. The intended beneficiaries of the project believe their experiences and concerns are reflected in the definition of the problem, approach, outputs, and definitions of success for the project. Ask and acknowledge who is likely to benefit from the project’s research, development, and extension activities.
- Include the diversity of all intended beneficiaries. The geographic and demographic diversity of intended beneficiaries is reflected by those engaged by the project. Participants feel their voice has been heard in a meaningful way, and that mutual respect is demonstrated throughout the project.
- Be accessible and responsive. Expectations of participants in the project are clearly heard and met. Responses are timely and accessible, and improvements in project outputs and activities are prioritized and implemented accordingly.
- Be transparent and reflexive. Acknowledge the subjective nature of research and reflect upon preconceptions and lived experiences that shape each Project Team member’s views of how the world works and they relate to those we interact (and don’t interact) with throughout the project.
Broader problem definition and goal-setting
Although this project is focused in particular of aspects of forest mapping and modeling that can be addressed through appropriate technology, we sought to ground this effort in a co-produced scoping of related issues and problems forest landowners and managers are experiencing and working through. Given the COVID pandemic, our original plans to host a large in-person Goal-setting event was instead executed in the form of four 1-hour focus groups completed via Zoom videoconferencing. These focus groups involved a total of 20 participants, and were focused on addressing these key questions:
- What challenges or unmet needs for forest assessment, stewardship planning, implementation, or monitoring do you face?
- What would a successful initiative addressing these needs look like?
As part of our Co-Production Assessment Plan, we also polled respondents in these focus groups to ask whether they believed they would benefit personally from the project, and whether they felt they were able to share their perspective and were treated with respect. 6 participants did not respond to the poll. 8 out of 14 respondents agreed or strongly agreed that they would personally benefit from this project, with the remainder indicating they were not sure. 14 out of 14 respondents agreed (3) or strongly agreed (11) that they had the opportunity to voice their concerns and be treated with respect.
Themes from Focus Groups: Challenges and Problems for Land Stewardship
Among the participants in focus groups, we heard repeated themes including: the need for outreach and personal connections with landowners and foresters; need for education platforms; long term monitoring; how to act given climate change; infrastructure (lack of it) is a big challenge (e.g., roads, mills); weak or variable markets for forest products; and limited capacity and availability of contractors. Among the educators, forest managers, and service providers included in focus groups, we heard themes including: how to educate landowners on basic forest knowledge; wide diversity of values related to the land; lack of funding (monitoring, getting contractors for small parcels); how to keep people engaged for the long term; how to translate values into goals.
Themes from Focus Groups: Vision of Success
Focus group participants were more readily able to translate their experiences into clearly identifiable challenges and bottlenecks that seemed to resonate strongly and see repeated mention among participants. In contract, when we asked participants about what their vision of successful stewardship programs might look like, we heard a variety of responses that seemed more individually-tailored and rarely cohered into shared themes. Those visions we heard included: consistency in long term monitoring to be used as a communication tool and information about how our activities affect the land; more outreach materials that are regionally focused; that more connections with foresters and landowners needed to be fostered because personal connections cannot be replaced.
We also heard specific feedback in terms of delivery of forest information, including: "Give people examples of the [stewardship] process based on forest type and values- something like a story map where people can see the range of management options based on their goals." We also heard interest in seeing more education and workforce development opportunities to build capacity for the limited forestry workforce, including support for more education opportunities like Tree School (local day- and half-day events with short classes covering a variety of topics held by Oregon State Extension) and landowner affiliation groups like Oregon Small Woodlands Association.
The importance of encouraging and being accessible and inclusive for landowners to make direct personal connections with eachother and with service providers was perhaps the strongest theme. One focus group participant voiced a clear call for our efforts: "Regardless of the tools we develop to help people know their land and make plans, the key is to help them find the gateway to engagement and access to assistance and tools. Providing a welcoming and inclusive gateway is essential to making our assistance appealing and accessible across the diversity of people and their perspectives. Foresters or the forestry assistance community is not always inviting or appealing to everyone, even if they ultimately would benefit from the assistance. Ecotrust’s project could be successful indeed if it helps create a more inclusive gateway to forestry assistance."
Honoring those who have come before
Following on the first principle of co-production defined in this project's Co-Production Assessment Plan, the Project and Advisory Teams determined that a review of related initiatives should be completed. A total of 15 different initiatives were identified between the Project and Advisory Teams and the participants in the Goal-Setting Focus Groups. Representatives from 3 among the 15 initiatives contacted responded and were interviewed. Summaries of the remaining 12 initiatives were prepared and compiled based on publicly-available documentation and web tools and applications. In general, the initiatives that were assessed fell into three categories: those with publicly available spatial tools; those with proprietary/internal spatially mapping tools; and those with no spatial tools whatsoever. Organizations with publicly available spatial tools include North Carolina’s Forest Pre-Planning Tool (FPPT), Oregon Explorer, and Texas A&M’s Forest Information Portal (FIP). Organizations with proprietary or internal spatial services include NCX (Basemap), USFS SMART, and Chiloquin Community Projects.
Most of the existing forestry and geospatial data services we investigated provide a rough summary of the soils and hydrology of the site. Services that are oriented toward general information, such as Oregon Explorer, provide a wide array of information but little analysis. Tools built for land management usually supply a report that summarize conditions within a selected set of parcels or a site boundary and include more layers that show the impacts of regulations on potential harvest activities. Organizations that use their spatial tools internally tend to have additional proprietary datasets built onto the standard layers public tools provide. The biggest challenge reported among these initiatives was getting the cooperation of private landowners.
According to those we contacted during this review, many landowners list privacy concerns as the reason they choose not to cooperate with these initiatives. A representative of the Timmons Group summed the problem up nicely when he said, “Many landowners are not comfortable providing information that is publicly available on their local assessors website.” Initiatives that sought to verify their remote sensing information frequently resorted to peering into private forest lands from the county roadway.
Producing a large open-source benchmarking dataset for forest mapping
In 2021, the SpatioTemporal Asset Catalog (STAC) clearly emerged as a standardized format that can be readily applied for the preparation of earth observation datasets for machine learning applications (e.g., Duckworth and Cheipesh 2021). We anticipate completing the organization of the data we have been using for forest modeling and mapping into a STAC format and are interested in pursuing the contribution of the data we have gathered to the Radiant Earth Foundation's MLHub, which provides a catalog of open datasets specifically intended to support ML applications with earth observation data.
In 2023, Ecotrust produced a TreeForCaSt dataset that contains several data from several remote sensing sources (NAIP aerial imagery, Sentinel-2 satellite imagery, lidar point clouds, etc.) alongside the forest inventory plot data we compiled from USFS, BLM, and Washington DNR.
STAC Data
Field plot data
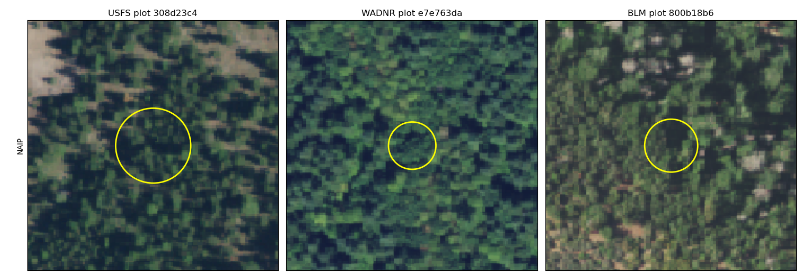
Forest inventory data for 4,683 unique field plots for Oregon and Washington State were compiled. The dataset consists of 15 canopy composition and structure target variables with annual point estimates for the period 2010 - 2023. These variables were estimated using the USFS Forest Vegetation Simulator (FVS) with records from field campaigns implemented from 2010-2018 by the US Forest Service (USFS), the Bureau of Land Management (BLM), and the Washington Department of Natural Resources (WADNR). Plot sizes vary across field campaigns. The USFS utilized the largest sampling area, with plots covering 1/4-acre each (58.9 ft radius), while BLM utilized 1/8-acre plots (41.6 ft radius), and WADNR utilized 1/10-acre plots (37.2 ft radius) (Figure 1). Data from surveys conducted in seven Oregon and Washington National Forests are included in the USFS plots. Additionally, data from surveys in Lane, Coos Bay, and Rogue Valley counties are included in the BLM plots, and data from a survey conducted in the state of Washington is included in the WADNR plots.
Remote sensing data
Remote sensing data was collected for the period 2010-2023 from public repositories. For each plot, we linked the closest image available to the plot year within an interval of ± 2 years. All remote sensing assets were projected to UTM coordinates. All imagery was fetched and processed to fit a 120 x 120-meter bounding box, and stored as Cloud Optimized GeoTiffs (COG).
National Agriculture Imagery Program (NAIP)
NAIP imagery is a collection of 3 to 4-band (R, G, B, N) orthophotos collected by the US Department of Agriculture (USDA) during the agricultural growing season. Each image tile is based on a 3.75-minute longitude by 3.75-minute latitude quarter quadrangle, with an additional 300-meter buffer on all four sides. The first images were collected in 2003 at a spatial resolution of 1 meter and only three bands (RGB). The resolution was improved to 0.6 meters for all US states and to 0.3 for some states (OR, LA, MS, AL) in 2018. All states have 4-band images available since 2010. NAIP images may have up to 10% cloud coverage. The flying cycle is five years for images collected between 2003 and 2009 and three years starting in 2010.
NAIP imagery was fetched from the Google Earth Engine NAIP collection for each year in the forest inventory plot dataset. The images acquired represent the median of each pixel value across all images available in GEE in a given year. For years not available in the GEE repository, we retrieved imagery from two additional providers: NOAA Digital Coast and Oregon Statewide Imagery Program. Images were fetched at the provider's native spatial resolution and then resampled to 0.5 m. We selected this resolution to set a fixed spatial resolution across NAIP editions while minimizing information loss and maintaining the number of pixels in each tile divisible by 120 meters, the size of the plot bounding box.
Landsat 8
Landsat 8 imagery, corrected for surface reflectance, was acquired from Google Earth Engine Landsat 8 collection for each year between 2013 and 2023. We fetched a leaf-on composite with images between April 1 and September 30 using the 120x120m plot bounding box, yielding a 4x4 pixels 30-meter resolution Landsat image. For each band, the median value was chosen across all images matching the date range. To remove unwanted pixels (clouds, cloud shadows, saturated pixels) a mask was applied using the Pixel Quality Assessment band (QA_PIXEL), representing surface, atmospheric, and sensor conditions per pixel, and the Radiometric Saturation Quality Assessment (QA_RADSAT) representing unusable band pixels due to saturation.
DEM
We acquired elevation data from the USGS 3D Elevation Program (3DEP) at 1-meter spatial resolution through the 3DEP ArcGIS REST API. We derived six topographic indicators from the DEM, resampled at a 10-meter spatial resolution. All metrics were calculated using a DEM of the size of a USGS Quarter Quadrangle, then cropped the resulting image to fit the 120x120 meter bounding box.
To compute the topographic metrics we utilized the richdem and pysheds Python libraries. These metrics included slope, aspect, flow accumulation, topographic position index (TPI) at 300m and 2000m, slope position class at 300m, and landform class. The slope and aspect provided information on the steepness and orientation of the terrain, while flow accumulation indicated areas of concentrated flow. TPI at different scales allowed us to identify specific slope positions such as valley bottoms, lower slopes, mid-slopes, upper slopes, and ridge tops, while the landform class combined TPI at two scales to identify different geomorphological features.
LIDAR and LIDAR-derived rasters
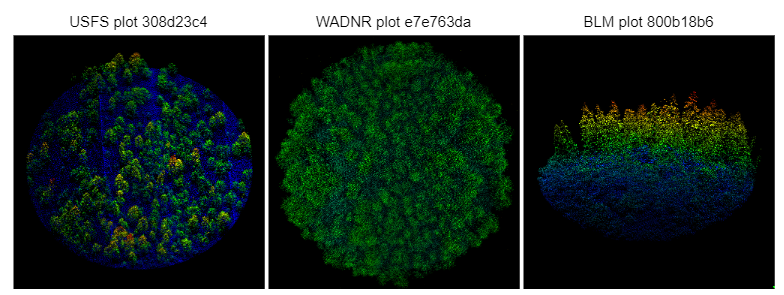
LIDAR data from 111 acquisitions conducted between 2000 and 2018 were obtained from various sources including NOAA Digital Coast, Puget Sound Lidar Consortium, Washington DNR, and Oregon State University. The point clouds had varying densities, with most plots having a density higher than 4.98 points per square meter. The figure below shows a sample of LIDAR point clouds for USFS, WA-DNR, and BLM 1-hectare plots. Ground surfaces were generated from 1-hectare point cloud clips using LAStools, and then summarized to plot-level using FUSION software. Plots with post-measurement disturbances or significant deviations between lidar and FVS canopy height estimates were excluded.
While the availability of LIDAR data in TreeForCaSt is currently limited, we anticipate to increase these assets in the near future, as the acquisition and dissemination of public LIDAR products become more prevalent.
Access
Following best practices for benchmarking datasets, TreeForCaSt aims to be fully reproducible. The source code is available in GitHub, including the survey plot dataset, data fetching scripts, and code to build the catalog. The current built version of TreeForCaSt catalog and data are stored in an AWS S3 bucket and can be browsed using RadiantEarth STAC browser through this link.
Two reproducible tutorials have also been produced, illustrating:
- Programmatic access to browse, query, visualize, and download data in the TreeForCaSt STAC
- How to train a simple computer vision model to predict forest attributes from the STAC (in this case, predicting forest biomass from NAIP aerial imagery).
Each of these tutorials are presented as Jupyter Notebooks, and enabled to be opened in the free Google Colab service. This allows anyone interested in running the tutorials from doing so for free without having to download or install anything on their computer.
Predictive modeling of forest attributes
Simplifying the collection of public domain geospatial and earth observation data
To support the application of these predictive models, we developed several data-fetching functions which collect the relevant input data from free and publicly-accessible data sources including Google Earth Engine (SENTINEL-2 satellite imagery) and The National Map (Digital Elevation Model). These functions gather these data for areas defined by a bounding box and return the data in raster or vector formats, so that these data can be stored locally, or integrated directly into a predictive modeling workflow.
Forest structure
Linear models trained in single ecoregions and applied in others (i.e., "visitors") showed very high variation in predictive ability, while all the other types of models generally showed much less variability. Visitor models generally performed substantially worse than all other model scopes. Outsider, insider, and global models showed performance that was more closely clustered together, although insider and global models were typically the best performing. For the linear models, insider models trained in ecoregions with several hundred observations often performed better than global models. In contrast, the GBM and RF models commonly demonstrated higher performance in global models than in insider models, indicating that the information learned from observations in other ecoregions contributes to improved performance for these models in each region where they are applied. Predictive performance was generally best for canopy cover and dominant height, particularly for lidar models, with predictions of tree diameter (QMD), stand density, cubic volume, and aboveground biomass show increasing levels of error.
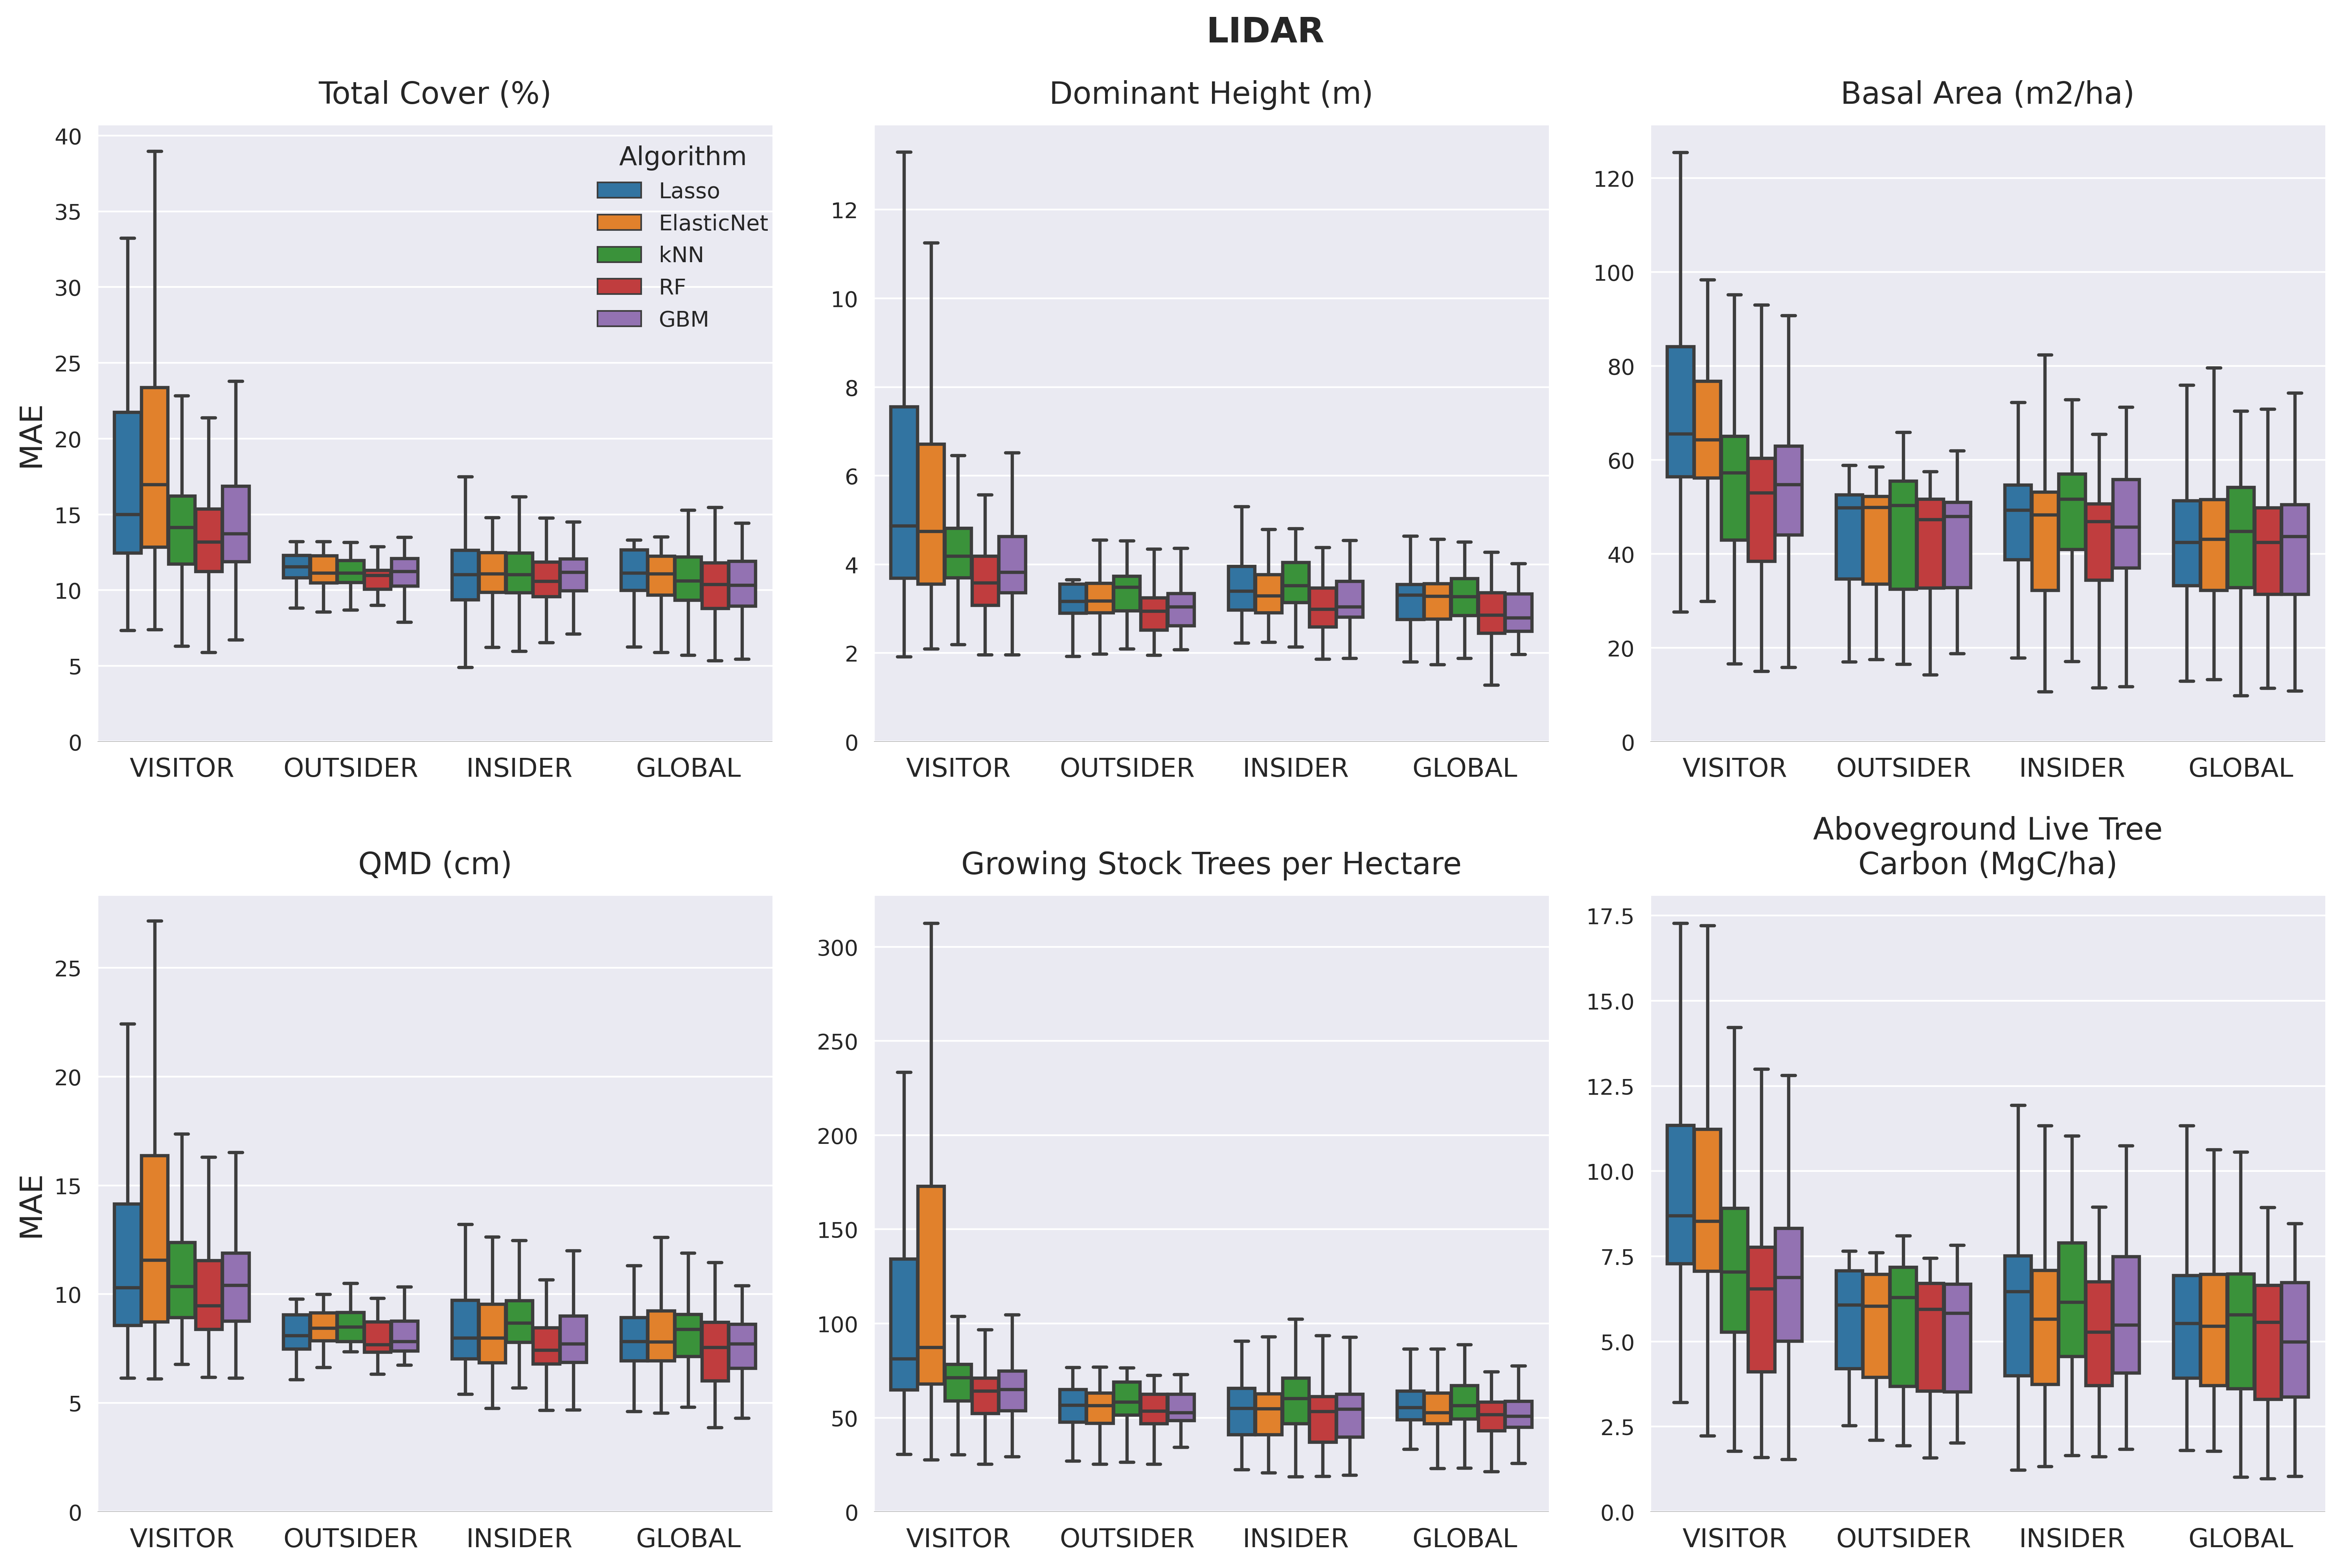
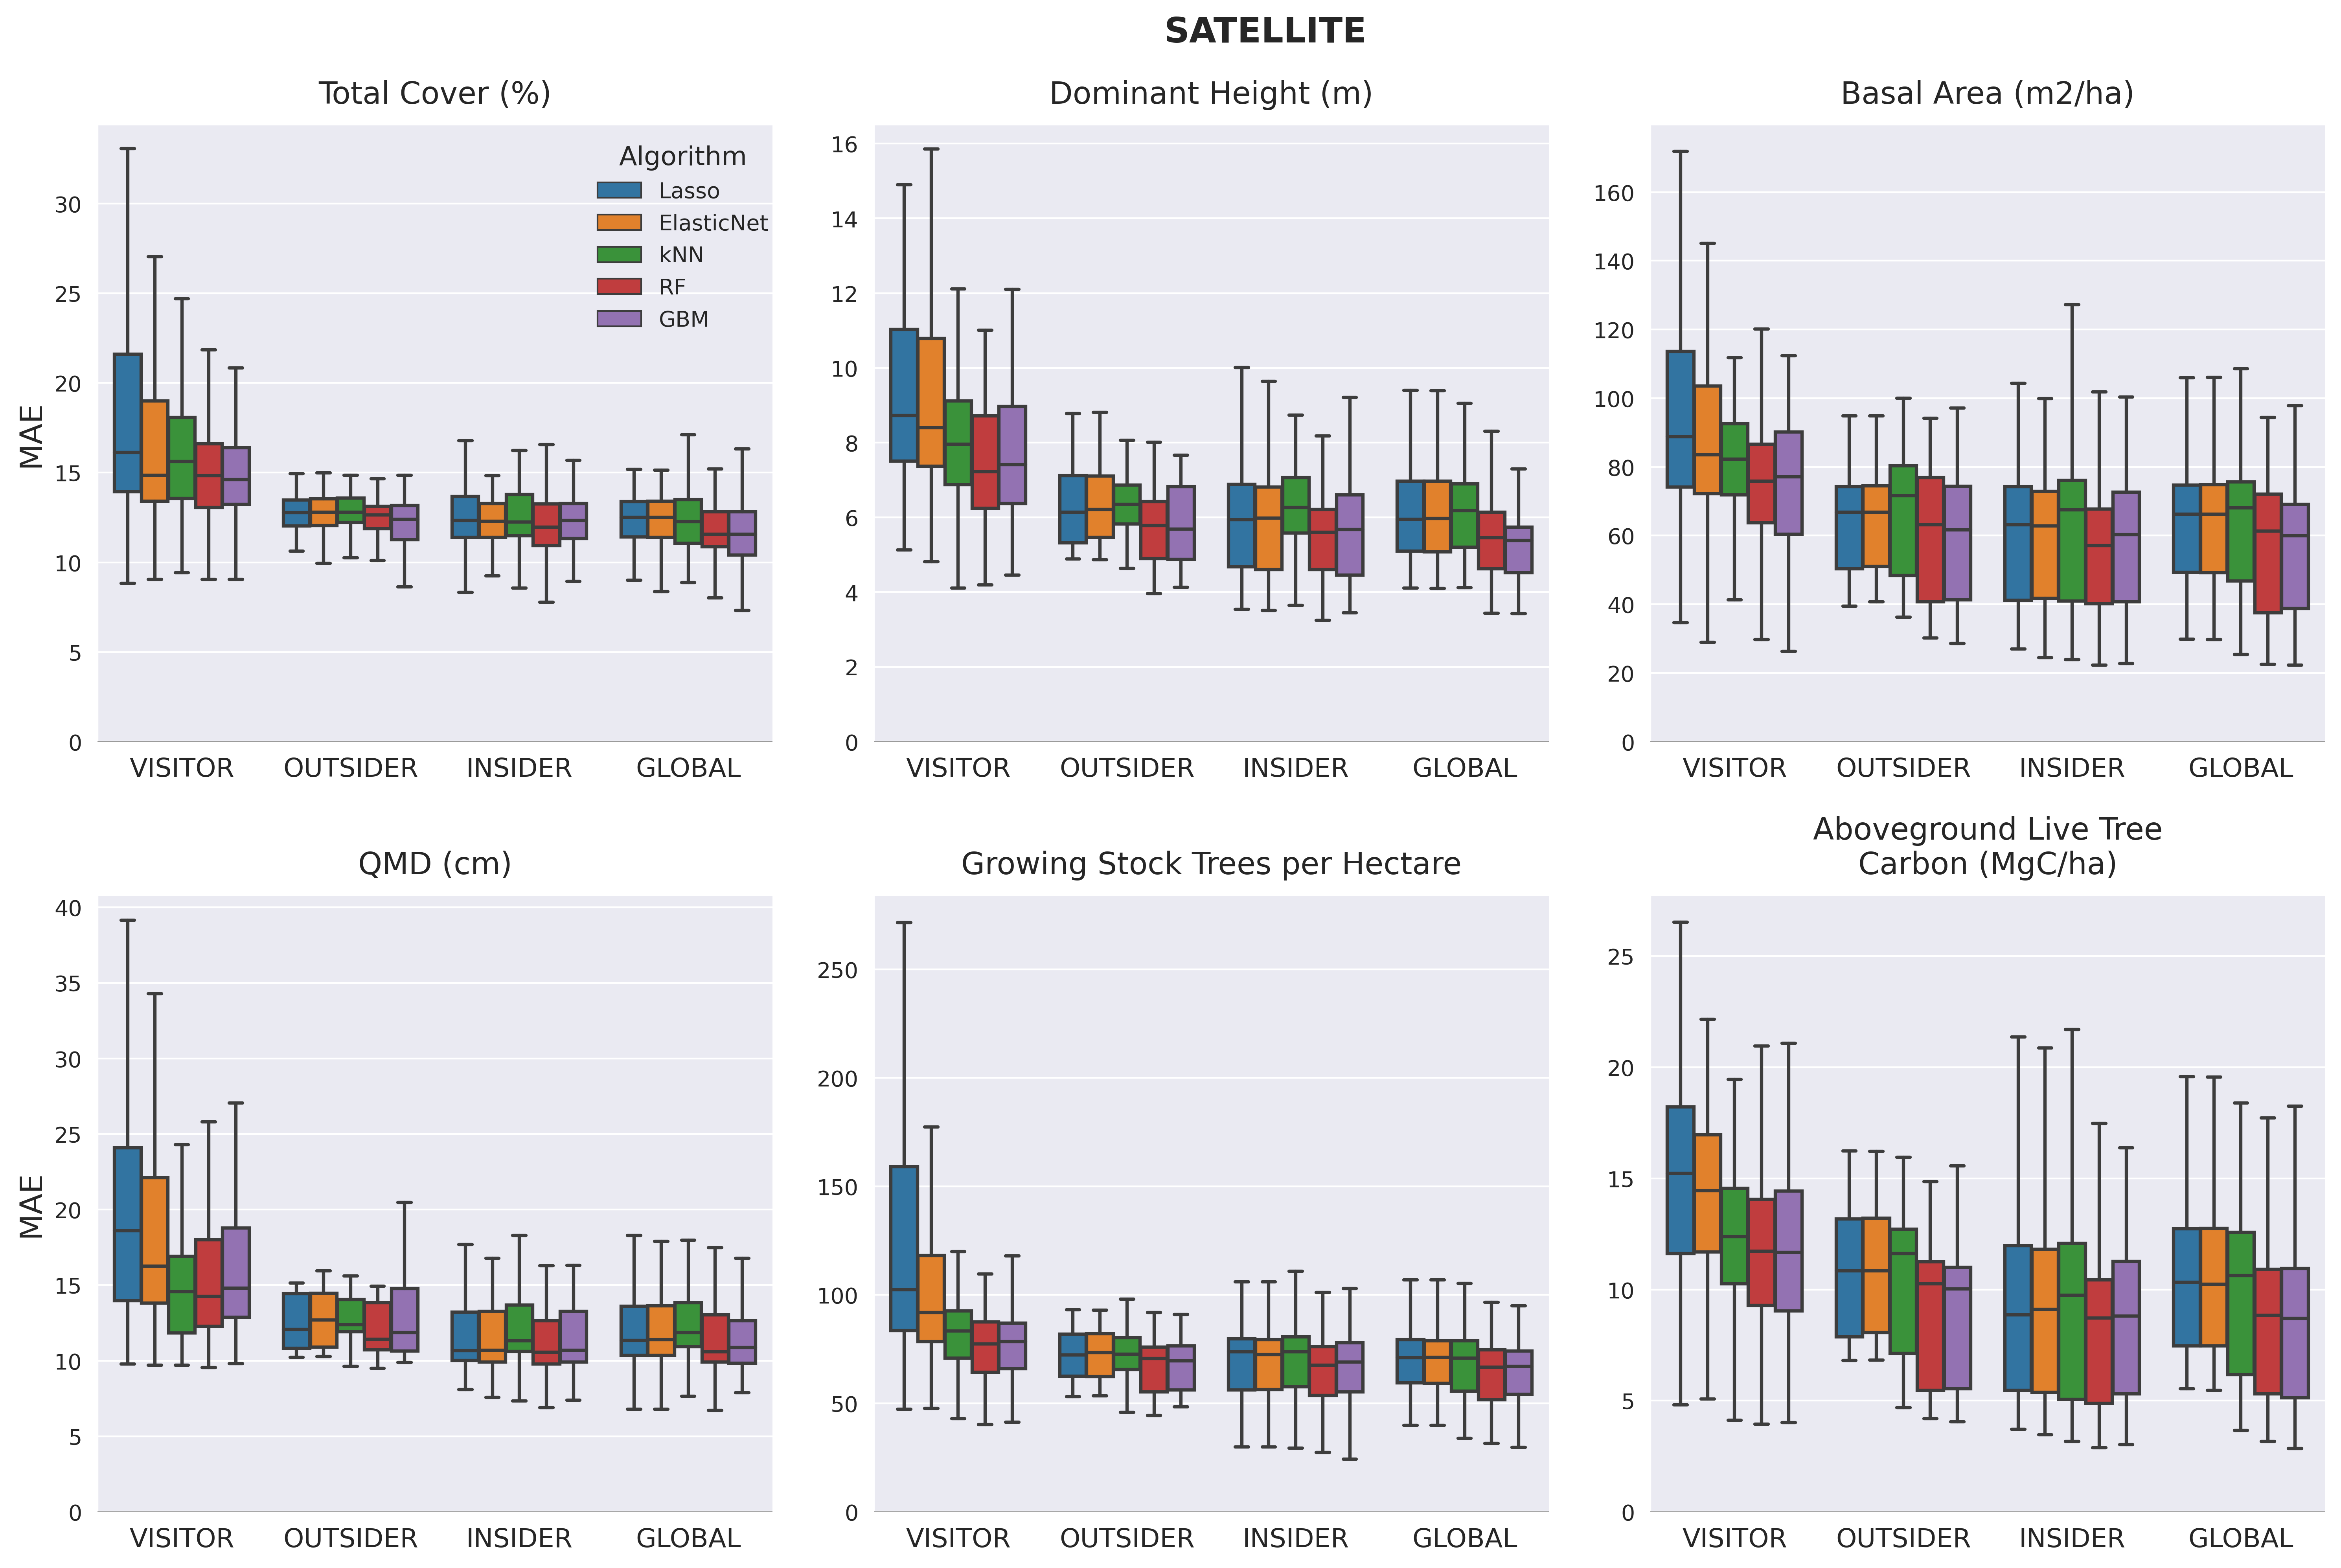
Lidar models consistently outperformed satellite models for predicting forest structure attributes. When the predictive performance of all the insider and global models trained with lidar and satellite are ranked, the GBM-GLOBAL-LIDAR and RF-GLOBAL-LIDAR models are usually the highest performers. In the case of predicting canopy cover, the ranks of the two best-performing satellite models (GBM-GLOBAL and RF-GLOBAL) were not statistically significantly different from the top-performing lidar models. For all other target variables, the ranks of the top-performing lidar models were better by a statistically significant margin than the best performing satellite model with the sole exception being GBM-GLOBAL-SATELLITE model's prediction of Stand Density Index falling within the critical distance for determining statistical significance of the top-ranking lidar models.
To consider the suitability of the top-performing lidar and satellite models for predicting forest structure, we characterized how closely predictions matched observations across the range of values observed for each forest structure attribute. In the case of canopy cover and tree diameter, we also classified how many predictions had errors that fell within one or two canopy cover classes (30% error to be off by a single class) or diameter class (5" error to be off by a single class). We observed that, although the best-performing global lidar model provides a better fit for each of the forest structure attributes than the best-performing global satellite model, the satellite model generated predictions within a suitable level of tolerance for predicting forest conditions within a single canopy cover class or diameter class used in prepare forest type maps for Forest Management Plans used by non-industrial forest owners.
An example of the inputs and outputs of the best-performing global satellite model (GBM) is shown for two forested scenes below.
A manuscript titled, "Predicting forest structure attributes from lidar or satellite data and assessing model transferability across multiple ecoregions', is currently in development and scheduled to be submitted for publication this spring. This manuscript is a chapter within larger dissertation completed by PI David Diaz. Some of the key findings explored within the manuscript include:
- The provision of basic forest structure and composition maps remains a key unmet need that can increase access to forest planning and stewardship by non-industrial forest owners. These hurdles can be meaningfully reduced with maps generated by predictive models from publicly-available remote sensing data.
- The compilation of a large multi-agency dataset of remote sensing plots spanning multiple ecoregions enables testing of forest structure models within and across ecoregions that was not previously possible using existing open data from any single agency.
- Lidar models consistently outperformed satellite models, though canopy cover was a close call.
- Tree-based ML algorithms (RF and GBM) consistently outperformed kNN and linear models regardless of the data source or region.
- By using a variety of hold-out methods to train models with different geographic coverage, we demonstrate that linear models generalize poorly when trained in one region and applied to another. When data from more than one region are available, we find that kNN is generally outperformed by all other models considered though RF and GBM showed the best performance. ML models RF and GBM showed the strongest generalization capabilities, with the addition of data from outside a target region (Global models) commonly increasing predictive performance whereas kNN and linear models often showed their best performance when trained as Insiders (using only data from a single target region).
- The performance of models needs to be assessed within each ecoregion in which it may be applied. Patterns that appear when considering predictions vs. observations across regions may obscure poor model performance in individual regions.
- The generalization capability of tree-based ML models and more advanced non-linear models trained with a cross-regional dataset appear well-suited for fundamental forest structure mapping and planning needs. When lidar or similarly high-resolution data are available, is more likely that forest mapping and planning needs can be met in extensive (e.g., non-industrial) management contexts. The utility of ML models trained using 10-meter or coarser satellite imagery alone is context-dependent and justifies additional research and model development. The incorporation of higher-resolution information from one or more remote sensing platforms (e.g., lidar, aerial imagery, higher-resolution satellite imagery) is likely to be necessary to consistently achieve estimates of forest structure that are sensitive enough to within-region variation before we can confidently meet the forest mapping needs of landowners and forest managers for extensive forest planning across the Pacific Northwest.
- Agencies should share data because global models show improved performance compared to insider models
Adjustments to forest attributes based on advisor and user feedback
Based on facilitated discussion and survey work with the project's Advisory Team and directly from users, the Project Team decided to adjust visualization approaches and inclusion of specific forest attributes. This included encouragement to step back from the goal for forest stand delineation, which is elaborated in more detail further below. We generated example maps for different visualization options for members of the Advisory Team for locations they knew well (e.g., usually places that they owned or managed). We presented maps depicting a variety of forest attributes, using both continuous and categorical symbology. We heard a consistent preference for displaying maps of forest attributes using binned/categories values (e.g., visualizing maps of canopy cover classes such as sparse, moderate, and closed rather than a continuous map of canopy cover percent). We also presented maps showing several levels of spatial aggregation, ranging from no aggregation (rasters showing 10 meter resolution forest attributes), to images with forest attributes clustered to roughly half-acre patches, and to larger spatial units similar to stands or traditional forest management units. In terms of spatial aggregation, a clear majority of respondents preferred no spatial aggregation in the presentation of these forest attributes.
We also asked our Advisory Team about their preferred indicators for depicting forest stocking, structure, and composition. We heard unanimous encouragement for example, to prefer live tree basal area rather than Stand Density Index as an indicator of forest density. We also were discouraged by the Advisory Team to introduce metrics depicting fire hazard or fire risk. The map layers we gathered for this purpose generally showed little-to-no fine-scale variation, and Advisory Team members generally recommended this topic could be more productively communicated directly with service providers while avoiding the potential for confusion or misunderstanding of fire metrics that require consideration of burn probability and potential burn severity. Discussion of this particular topic (fire hazard reporting) was also influenced by recent difficulties encountered in Oregon to roll-out fire hazard maps that were tied to regulatory programs through an Oregon Wildfire Risk Explorer web application. The release of these data were mandated by the Oregon legislature, but following their release and public reactions after being contacted about the map and potential implications of designating properties as higher fire risk, maps intended to communicate fire hazard at property scale were withdrawn (Profita et al. 2022).
Development of a reproducible pipeline for mapping forest structure and composition
Based on beta-testing and Advisory Team feedback, Ecotrust modified the forest attributes to be mapped by predictive models across the State of Oregon to include canopy cover, canopy height, quadratic mean diameter, live tree basal area, and aboveground biomass/carbon stocking. With the development of open-source code and workflows to fit several models to these data, we have been able to rapidly adjust the target variables for the model, such as replacing Stand Density Index as a target variable with live tree basal area, and enable more recent satellite imagery to be fetched and used to make predictive models. We updated the maps to be served through the Landmapper web application based on 2022 satellite imagery and expanded the geographic scope of the Landmapper web application to the State of Washington.
With the preparation of a reproducible data-fetching and predictive modeling pipeline, we are able to download and prepare satellite and related input data using pre-existing scripts with minor modification across both of Oregon and Washington over the course of ~24 hours. The generation of predictive maps of forest attributes covering each state is also scripted and requires ~24 hours as well. Although more distributed computation and parallelization options could be pursued to shorten these processing periods further, the data science team is very happy with this performance given the fact that these maps are only intended to be updated on an annual interval.
Automated stand delineation
The implementation of simplified SCRM approach is displayed below. Instead of segmenting directly from raw reflectance values in high-resolution aerial imagery, we performed segmentation of "rough stands" by clustering the forest attributes predicted in each pixel into larger objects. This workflow to generate the first pass at delineating forest stands is illustrated below.
After the first pass of stand delineation was completed, the average canopy cover and tree diameter are calculated and then binned into canopy and diameter classes. Similarly, the most common land cover and forest community type in each stand are also calculated.

Adjacent stands that share the same combination of canopy cover class, diameter class, and forest community type are then merged to produce a final stand layer.
Reducing time and expense for forest assessments and planning
User-centered design and engineering
By March 2021, interviews had been conducted with all (8) members of the SARE Advisory Team. These interviews were originally intended to be analyzed in 2021 and for the team to advance to Phase II interviews later that year, but complications due to COVID and a family medical emergency by PI Diaz that included four months of medical leave caused significant delays to these plans. Phase I interviews transcribed in Summer-Fall 2021 and coded by the Interview Team in Winter-Spring 2021-2022. After reviewing several software applications to conduct interview coding (and an aborted attempt using the free and open-source Taguette software), the Project Team identified and used the Delve web application, which was deemed to better match the needs for collaborative coding of transcripts by multiple researchers.
From Fall-Winter 2022, with consultation with our Advisory Team, the Project Team decided to focus our remaining user engagement and qualitative research efforts on beta-testing and refinements to the Landmapper web application rather than completion of the originally-intended interview analysis and clustering. We developed a simple assignment for beta-testers to find a property and generate a report using the Landmapper app and gathered feedback using a short survey. We completed beta-tests with 12 participants including in-person and Zoom videoconferencing with screen-sharing. Six of these beta-testers had never used the app, one has used Landmapper once, and five had used Landmapper more than once.
Survey results from beta-testers are displayed in the tables below.
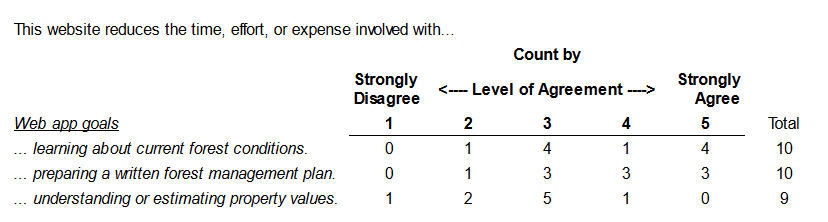
Through this beta-testing process, we also gathered open-ended comments and feedback. We received particular interest and enthusiasm from beta-testers who had never used Landmapper that were forestry professionals that support the development of management and stewardship plans with family forest owners. While there were several areas where important room for improvement (and specific guidance) were identified, particularly the depiction of forest type maps and tables, every consulting forester and professional plan-writer that we interviewed clearly saw and communicated interest in the potential for Landmapper to offer a drop-in replacement to generate maps in a few minutes to replace their current workflows that require them to spend several hours for each forest landowner they support.
Research Outcomes
Co-production process planning and evaluation
We set out to employ an equitable and inclusive process to co-produce actionable science. We looked to spearhead a process where diverse stakeholders are engaged through the entirety of project implementation to ensure science-based outcomes and products that are credible and legitimate. Ultimately, we found the process to be successful, resulting in a collaboration that leveraged the expertise of a wide variety of individuals to create a product that is user-friendly and serves a wide variety of audiences including Tribes, consulting foresters and family forest owners. However, coproduction is an iterative process and requires intention throughout. Several lessons learned throughout this process that are outlined below.
1. Clear communication is essential. We found that effective communication is essential to successful coproduction. Defining and creating a shared understanding of goals, expectations, and timelines that are understood by all participants allowed for shared visioning of our work. We found hosting regular meetings with the advisory team to discuss progress, challenges, and next steps was an effective way to foster engagement and keep everyone up to date. During these meetings and throughout the process, we worked to actively seek feedback from all participants, employing a series of surveys, zooms calls, and one-on-one interviews to capture input. Once we came to a decision as a team, it was helpful to document agreements and the process involved in arriving at that decision to ensure transparency and alignment.
2. Trust and collaboration is key. The coproduction process is a collaborative environment where all participants feel comfortable sharing ideas, concerns, and feedback. We found that members of our advisory team had different levels of comfort in sharing out opinions with the larger group, so allowed for capture of feedback and input through email and surveys. Additionally, after working together for some time we were able to build trust with each other, which stems from participants feeling like their opinions are being considered and that the feedback they offer can affect change within the scope of work and project vision.
3. Remain flexible. We found that coproduction can often involve dealing with unforeseen challenges. Upon project inception, we envisioned casting a wider net with a our coproduction process, by hosting public input sessions and workshops to gather feedback from interested parties outside of our advisory team. Due to the COVID pandemic, we had to significantly scale back our public engagement plans due to social restrictions. As a team, we remained flexible and adjusted to the changing circumstances by hosting additional remote working sessions as a team and conducting one-on-one interviews with forest managers, service providers, and woodland owners.
4. Honor those who have come before. Acknowledge and build upon the knowledge, efforts, and products of others who have already contributed significant time and energy to these topics. Do not reinvent their products or needlessly duplicate their work.
5. Establish common goals and objectives. One key component of our coproduction process was the creation of a shared vision and goals. We spent a significant amount to time working as a project team to define the scope of the project, cultivating a shared vision of success, and clearly articulating goals for our work together. This alignment helped to maintain focus and synergy throughout the process, while allowing for an agreed upon measures of success. It was also critical to our success that we allowed for regular review and adjustment of our goals and working agreements based on changing circumstances, feedback, and/or new information. It also helped that our shared goals and objectives often aligned with the individual objectives of our advisory team. For example, we had small family forest owners who were interested in using a tool such as the one we were co-creating. We had educators that were looking for a way to engage with woodland owners and get them interested in becoming stewards for their land. Aligning our shared goals with the individual goals our our project team allowed for greater motivation and engagement.
6. Continuous evaluation and improvement. Part of the coproduction process was being intentional and self-aware of the process itself. We worked to regularly assess the coproduction process and its outcomes by consistently gathering feedback and using that feedback to identify areas of improvement. Regular check-ins as a team, allowed us to identify potential issues and make the necessary adjustments in a timely manner.
Forest Classification
Stand Delineation
One of the stated objectives of this project was to establish a reproducible pipeline for generating actionable maps and supporting data delineating and characterizing forest stands throughout Oregon and Washington. Based on facilitated discussion and survey work with our advisory team and application users, we decided to step back from the goal of providing forest stand delineation. We found that the first generation of forest stand maps resulting from our reproducible pipeline of predictive models, left substantial room for improvement from both the accuracy and aesthetic perspectives.
Anecdotal reports from consulting and Extension foresters were mixed, and also raised an intriguing question as to whether the delineation of stands is actually the most suitable goal for a process like this. These service providers working with landowners have described that the delineation of forest management units on a property involves knowing not just about the forest conditions across a property, but also the interests and capacity of a landowner that will shape their management outlook. In practical terms, this means a forester would delineate a forested property differently based on their consultations with the landowner.
Taking a step back and setting aside the blocky nature of the automated stand boundaries and the overall accuracy of stand typing, this feedback has indicated that precursor data layers to the automated stand boundaries may actually be more useful for a forester or landowner who is going to ultimately draw their own stands anyways. In this vein, while we continued to explore the validity of these stand-level estimates of forest conditions, we decided to offer the raw values for predicted forest structure attributes, binned into meaningful classifications for predicted forest structure attributes (canopy cover, dominant height, etc.) and forest composition as their own map layers that foresters and landowners can download and work with. Instead of providing stand attributes in a map form within automated stand boundaries, one Extension agent, for example, suggested that a tabular summary indicating the area of each combination of forest type, cover class and diameter class on a property might be a preferable alternative which we plan on integrating into our application over the next year.
Model Selection
A significant amount of work went into establishing a reproducible pipeline for generating fundamental attributes of forest structure across the landscape, including attributes such as species composition, size class, stocking level, and other forest structure attributes. During this process, we compared the performance of Lidar models with satellite models for predicting forest structure attributes. The predictive performance of these models is described in detail in the Research section of this report. In short, we found that Lidar models consistently outperformed satellite models for predicting forest structure attributes. However, we observed that although the best-performing global lidar model provides a better fit for each of the forest structure attributes than the best-performing global satellite model, the satellite model generated predictions within a suitable level of tolerance for predicting forest conditions within a single canopy cover class or diameter class used in prepare forest type maps for Forest Management Plans used by non-industrial forest owners. For that reason, we developed our pipeline to utilize satellite based models, rather than lidar based models, due to the greater availability of current data and truncated processing time required.
Benchmarking Dataset
As an outcome of this project, we wanted to produce a dataset that contains data from several remote sensing sources alongside the forest inventory plot data we compiled from USFS, BLM, and Washington DNR. We developed a SpatioTemporal Asset Catalog (STAC) as a way to share these data in a standardized format that can readily be applied for machine learning applications. The resulting TreeForCaSt STAC can be browsed, queried, and data can be downloaded by users for use in creating new predictive forest models. The inclusion of field inventory and remote sensing data for multiple ecoregions provides a comprehensive and diverse dataset for training machine learning models to predict forest composition and structure attributes. Leveraging the STAC specification offers the following advantages: 1) temporal and spatial queries are easy to implement. 2) The portability of the STAC specification makes it a low-cost alternative for sharing metadata and data assets. And 3) We can plug-and-play TreeForCaSt to existing STAC technologies like the RadianEarth stac-browser. TreeForCaSt is open source and relies on public datasets for both field inventory and remote sensing data, ensuring the reproducibility and accessibility for researchers and practitioners. Future work could focus on expanding TreeForCaSt to include more years, acquire LIDAR data for all plots, and potentially incorporating data from other regions to enhance the applicability and generalizability of the models trained on the benchmarking dataset. In addition, more work is needed to understand and address co-registration errors over time-series and between sensors.
Education and Outreach
Participation Summary:
On December 8, 2020, the beta version of the web app Landmapper was debuted in at Tree School Online, an online version of the annual event organized by Oregon State University Extension. The webinar was recorded and is available online here: https://www.youtube.com/watch?v=uVWIU3K7_0I.
Over Q3-4 2020, Ecotrust's Director of Forestry Technology, Natural Resources Data Scientist, and Director of Design also facilitated several activities with the members of a Landscape Management Planning committee comprised of representatives from the Oregon Tree Farm System, Oregon Small Woodlands Association, and OSU Extension. These efforts included activities to elaborate on the use cases and desired functionality for stewardship planning that go beyond the first offering of maps and tables offered in the version of Landmapper that was released in December 2020.
In 2022, Ecotrust staff presented Landmapper at the Tree School Online event and at the Oregon Family Forest Convention in Corvallis. During the month of March 2022 (surrounding Tree School Online), more than 600 new users came and utilized the Landmapper web app. At the Family Forest Convention, we presented Landmapper to approximately 250 attendees, most of whom were family forest owners. In 2023, Ecotrust staff presented Landmapper as part of short-courses such as "Introduction to Forest Planning" at regional Tree School events organized by OSU Extension in Clackamas (~40 participants), Waldport (10 participants), and Baker City (15 participants).
In early November 2023, Northwest Natural Resource Group (NNRG) hosted a Landmapper workshop with 35 small woodland owners in Washington, resulting in 10 registered users of the application. They also released a blog post discussing the utility and context for Landmapper which has received over 100 views to date.
Based on Google Analytics tracking of website usage, the Oregon Landmapper web application supported 1,300 new users in 2022 and 1,200 new users in 2023, supporting an average of 100-115 users per month. The largest single month of new users (625) was reported in March 2022 surrounding the presentation of Landmapper as part of Tree School Online. We expanded Landmapper to include the state of Washington in October 2023 but didn't start tracking user analytics until December. For the month of December, the Washington Landmapper web application supported 45 new users. Users spend an average of 3-6 minutes on the Landmapper website, which corresponds roughly to the amount of time typically involved with finding a property and generating and downloading a report with property maps and tables.
In total, 1,313 unique properties have been mapped using the application, totaling over 1.3 million acres throughout Oregon and Washington.
In early March 2023, Ecotrust incorporated additional features into the Landmapper web application including user experience feedback options, a free user registration option, and follow-up surveys for registered users to gather additional information about whether and how the use of Landmapper has supported forest owners to make or follow-through on new stewardship plans.
Education and Outreach Outcomes
User-centered design
One of the activities during the first year of this project was to scope use cases for an effective and simple open-source tool that could serve Tribes, forestry professionals, Technical Service Providers, and family forest owners with actionable forestry information. To start, we interviewed each of our Advisory Team members individually, transcribing the results for future analysis. After reviewing several software applications that could be used to conduct interview coding (and an aborted attempt using the free and open-source Taguette software), the Project Team identified and used the Delve web application, which was deemed to better match the needs for collaborative coding of transcripts by multiple researchers.
After designing a prototype of the application based on these interviews, we released a beta-version of the Landmapper application and focused our remaining user engagement and qualitative research efforts on beta-testing and refinements to the application rather than completion of the originally-intended interview analysis and clustering.
We found that focused questions about use cases and deploying an over-the-shoulder approach to interviews, resulted in actionable and specific feedback we were able to address and integrate into the application. Watching a user interact with the tool in real-time allowed researchers to identify areas of confusion and sticky points for users.
Outreach Events
Over the course of this project we hosted 6 workshops demonstrating use of our Landmapper web application and reviewing specific use cases and tool utility. The majority of these workshops (5) were held in person at events and conferences geared toward small woodland owners in the Pacific Northwest. We hosted one online workshop where participants joined the session remotely from a personal computer during the COVID pandemic as part of Tree School Online. We found that workshops in which participants had access to a computer during the presentation, allowing them to interactively map a property that they personally owned or managed, resulted in greater engagement and repeat visitations to the site from participants. After the online presentation of Landmapper, we saw the single largest month of new visitors (625) reported to date. Workshops held in front of a live audience where personal computers were not available for use by participants resulted fewer site visits afterward, with little or no peaks in site visits in the weeks after the session.
User Surveys
In early March 2023, Ecotrust incorporated additional features into the Landmapper web application including user experience feedback options, a free user registration option, and follow-up surveys for registered users to gather additional information about whether and how the use of Landmapper has supported forest owners to make or follow-through on new stewardship plans.
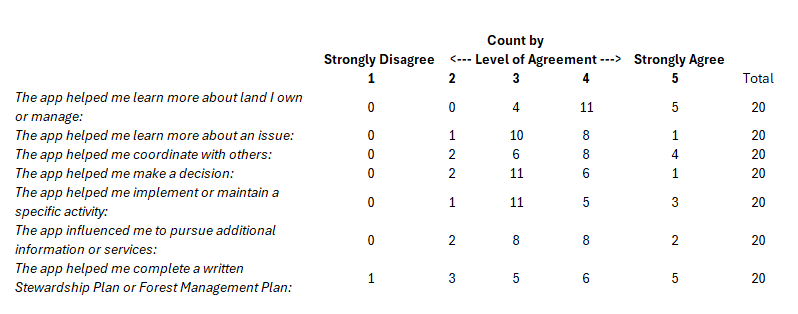
Since implementing free user registration in October of 2023, we have had 187 users create a user account in either Oregon (167) or Washington (22). In an effort to capture the impact Landmapper had on user behavior, we sent out a follow-up survey to registered users two weeks post-registration, asking them to rate their level of agreement with a series of 8 statements. Statements centered around Landmapper's success in providing access to information, catalyzing management action, and facilitating forest management planning and decision making. We had a total of 20 responses to the survey, compiled below. Overall, the level of impact varies by individual, but we found the application was most broadly successful in helping users to learn more about land they own or managed, coordinate with others, and complete a written Stewardship Plan or Forest Management Plan. Survey results are presented in the table below.
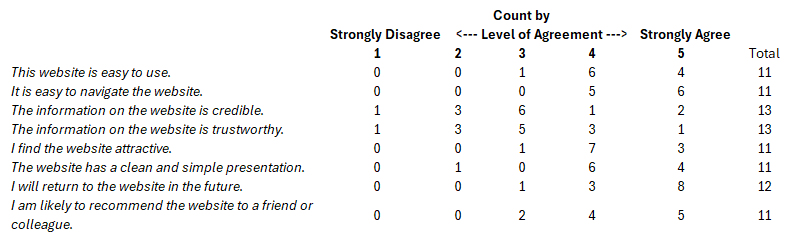
In addition to our post-registration survey, we offered the opportunity for feedback by providing an in-application option for users to self-select. Upon implementing the survey in this way, we hypothesized that feedback would be more critical from users who self-select in this way, in that they might have run into an issue or question during application use which led to the decision to provide feedback. We were surprised to find that this was not the case, as the results from our in-app survey mirrored general response trends we received via other survey platforms. Users were prompted to rate their level of agreement to a series of statements regarding application utility, design, credibility, and ease of use. We had a total of 13 respondents that had varying levels of agreement to our prompts. Based on this small sample of users, it appears we were most successful in creating a tool that is easy to use and navigate and has a clean and simple presentation. Additionally, the majority of users agreed that they would return the the website in the future and/or recommend the website to a friend. Results indicate there was less agreement about the information provided by the website being credible and trustworthy. It is important to note that these survey results were received before we updated the forest attribute layers served in the application, after iterating and refining our predictive models. Many of the comments we received from users that indicated a lack of trust in Landmapper data specifically referred to misclassifications present in the forest type data, which has since been improved. Survey results are presented in the table below.
- Increase awareness and use of time- and cost-saving tools to accelerate the learning curve, completion of Forest Management Plans, and adoption of sustainable forest management and conservation practices.
- Increase landowner interest, preparedness, adoption, and participation in programs that support practices to improve forest health, wildlife management, and mitigate and adapt to climate change,.
- Reducing the time and expense for forest assessments and planning.
- Deploy user-friendly open-source technology for landowner engagement and management planning.
Learning about current forest conditions.
Preparing a written forest management plan.
Understanding or estimating property values.