Final Report for SW11-116
Project Information
Strawberry/vegetable producers in coastal California face soilborne disease, nutrient, and weed management challenges. Non-fumigant solutions for controlling soilborne diseases and weeds are becoming increasingly crucial for both conventional and organic growers. Objectives of the project were 1): to test the effects of anaerobic soil disinfestations (ASD), broccoli residue incorporation, mustard cake (MC) application, alone and in combination, on crop yields, Verticillium. dahliae suppression, weed suppression, N provision, production costs, and net returns in strawberries and lettuce grown in typical crop rotation systems on organic and conventional farms with high V. dahliae pressure, 2): to optimize MC application procedures for improved yields, weed and disease suppression and N provision in strawberries and Romaine lettuce, and 3) to disseminate results to growers and agricultural professionals in coastal CA and beyond.
For Objective 1, we conducted two replicated trials; one at an organic farm (Org) and the other at a conventional farm (Conv). Main plots were crop rotations (broccoli, cauliflower or fallow – strawberries – winter cover crop*–Romaine lettuce*. * Org only) and sub plots were ASD, MC, ASD+MC, untreated control (UTC), and fumigant (Pic-Clor 60. Conv only) applied prior to strawberry. Yield was measured for each crop. Weed density and disease level were monitored during the strawberry season and soil inorganic N dynamics for the entire period. Partial net returns of each crop rotation were examined. For strawberries, ASD+MC produced greater fruit yield than UTC and MC at both sites and ASD at Org site. At Conv site, ASD+MC and ASD produced similar fruit yields as fumigant. MC and rice bran applied with the ASD treatment released high concentrations of soil inorganic nitrogen for two months after application. This resulted in increased early fruit yield, especially at the Org site where no pre-plant fertilizer was added. On the other hand, a large amount of N was lost during the winter rainy season from ASD and MC plots in both sites, ranging from 116 to 223 kg-N/ha at the Org. site and from 75.2 to 134 kg-N/ha at the Conv. site. Optimization of N management in these treatments warrants further studies. Infection of strawberry plants with V. dahliae at the end of the season in the Org site was reduced by ASD and ASD+MC. Weed suppression by ASD and MC was limited. The effect of broccoli rotation on V. dahliae and weed suppression was also limited and no synergistic effect of broccoli rotation with ASD and MC was observed. Nonetheless, the highest net return was recorded from the broccoli ASD+MC treatment despite higher treatment costs, mainly due to the high yields of strawberry and lettuce crops. Overall, ASD improved net returns for all rotations. Importantly, at the Org site, the number of V.dahliae microsclerotia in the soil after the lettuce crop, two years after ASD treatment, were still lower in the ASD plots than the UTC, indicating a lasting suppressive effect of this treatment.
For Objective 2, we conducted a field trial to optimize MC application procedures for transplant Romaine lettuce. A split-split plot experiment with four replicates was initiated with: mustard cake (MC. Brassica juncea: Sinapis alba,1:1 by weight) 0.5 ton/acre, MC 1ton/acre, and pelleted organic fertilizer (OF. Perfect Blend 4-4-2. Chicken manure-based) 0.5 ton/acre (grower’s standard) as main plots; plant back period ( 1, 2, 3 and 4 weeks) as split plots; and with and without plastic mulch (clear TIF film) as split-split plots. MC 1 t/ac with TIF and three week plant back time produced the highest yield. Without TIF, however, there was no difference in head weight between any plant back time period indicating even one week is sufficient. MC application did not show any effect on weed density of either monocots or dicots regardless of application rate, use of TIF or not, and plant back period.
For Objective 3, a non-replicated demonstration trial with the same design as the Org trial was established in ALBA, Salinas in 2012. Strawberry plants started to show wilt symptom caused by V. dahliae in April 2013, and by May significant plant mortality occurred. For main plots, mortality was highest in the broccoli plots, followed by the fallow plots, and the lowest in the cauliflower plots. For sub plots, UTC and MC plots had higher mortality compared to ASD and ASD+MC plots. Cumulative fruit yield reflected the mortality of the plants. Unexpectedly, broccoli plots resulted in higher mortality than the cauliflower and fallow plots. A multi-cut broccoli variety De Cicco was used in this broccoli treatment suggesting that the effect of broccoli residue incorporation on V. dahliae suppression may be variety dependent. Using this demonstration trial, a field day/workshop on soilborne disease management in organic strawberry production was conducted at ALBA on 7/9/13 and again on 9/25/14. Each workshop was attended by 14 to 15 people and simultaneous Spanish translation was provided. Both events were well received. Outcomes of this project were also presented at multiple extension and academic meetings.
Objective 1: To test the effects of ASD, broccoli residue and mustard cake (MC) incorporation, alone and in combination, on: crop yields, V. dahliae suppression, weed suppression, N provision, production costs, and net returns in strawberries and lettuce grown in typical crop rotation systems on organic and conventional farms with high V. dahliae pressure. (Shennan, Muramoto, Koike, Klonsky, Milazzo, Tanimura, Noma and Kimes. Years 1-3, Santa Cruz, Salinas).
Objective 2: To: 1) establish the optimum time between MC application and lettuce planting; 2) test the effects of MC application rate, depth of incorporation and level of preplant fertilizer on yields, disease and weed suppression in lettuce production; 3) as for goal 2 but for strawberries, and 4) assess the economic feasibility of MC use in lettuce and strawberries. (Shennan, Muramoto, Koike, Klonsky, Pedersen and Kimes. Years 1-3, Watsonville).
Objective 3: To disseminate results to growers and agricultural professionals in coastal California and beyond through a variety of approaches including workshops, a field demonstration (at an NGO farm that works with low resource Hispanic organic farmers), field trips, YouTube, eOrganic, and written materials (All team members. Years 2 and 3).
California strawberry production accounts for more than 80% of total US production with an annual farm gate value of $1.8 billion in 2015 (USDA, 2015). Rising production costs and regulatory restraints are increasingly undermining growers’ profit, resulting in reduced acres planted for 2016 production (CSC, 2016). Restrictions in the use of fumigants for pathogens and weed control, together with nutrient management, are among the main challenges conventional strawberry growers are facing today. Since the phase out of methyl bromide as a pre-plant soil treatment, other fumigants such as chloropicrin (Pic) and 1,3-dichloropropene (1,3-D), among others, have been adopted by conventional strawberry growers. 1,3-D alone controls nematodes and some soilborne insects but has limited activity against soilborne plant pathogens and weeds (Noling and Becker, 1994). Pic controls pathogens but is less effective in controlling weeds and nematodes than MB (Noling and Becker, 1994; Wilhelm, 1999).
Organic growers, on the other hand, lack tools to control soilborne diseases and weeds. Crop rotation is the main tool used to prevent soilborne diseases. However, long crop rotations can reduce revenues and often are inadequate for preventing diseases. Verticillium dahliae is a pathogen commonly present in California farmed soils. Its ability to infest the root systems of a large spectrum of crops represent a great challenge for organic farmers and their ability to maintain economic crop rotations. Broccoli residue incorporation has been demonstrated to be effective in suppressing Verticillium wilt on strawberry (Subbarao et al., 2007; Muramoto et al., 2014) and cauliflower (Subbarao et al., 1994) in California, possibly due to hydrolysis of glucosinolates. Many organic strawberry growers in central coastal California use a broccoli-strawberry rotation, though it may not be feasible for all growers due to market limitations and the effect on disease is limited. A soil disinfestation method using anaerobic decomposition of organic matter was developed in the Netherlands (Blok et al., 2000; Goud et al., 2004, Lamers et al., 2010) and Japan (Shinmura, 2000; Momma et al. 2013) independently as an ecological alternative to methyl bromide fumigation. ASD works by creating anaerobic soil conditions by incorporating readily available carbon-sources into topsoil that is irrigated to saturation (not flooded) and subsequently covered with a plastic tarp. The tarp is then left in place to enable anaerobic decomposers to respire using the added carbon and produce anaerobic by-products that are toxic to pathogens. Changes in soil Eh, pH and microbial community composition are all thought to contribute to disease suppression (Momma et al, 2013; Shennan et al., 2014).
Weed management is one of the greatest challenges in organic production (Sooby et al., 2007). Although opaque plastic mulch application, a common practice in organic strawberry production in California, suppresses weed pressure to some degree, it still requires manual weeding which can cost more than $2,000/acre annually (Bolda et al., 2014). Mustard seed cake (MC), a residue product of the seed oil extraction process, is high in glucosinolates and can provide disease control and weed suppression as well as supplemental nutrients (Handiseni et al., 2011). Although such materials were commonly viewed as effecting disease control through “biofumigation,” specific elements of the soil biological community have also been shown to contribute to disease or weed control (Cohen et al., 2005; Mazzola et al., 2007; Hoagland et al., 2008). It is likely that the modes of action may vary from pathogen to pathogen (Mazzola et al., 2007) and that the source of the product can also modulate disease control efficacy (Mazzola and Brown, 2010).
To address the need for alternatives to fumigation and disease and weed control for both conventional and organic growers, we tested the efficacy of crop rotation, broccoli residue incorporation, mustard cake (MC) and anaerobic soil disinfestation (ASD), alone and in combination, in suppressing V. dahliae and weeds. We also studied the effect of MC and ASD on N dynamics given the high N content of MC (6%) and rice bran (2.5%, a common carbon source for ASD).
Cooperators
Research
Objective 1
Field trials and yield survey:
A field trial was established at the UCSC organic farm (Elkhorn sandy loam) in June 2012. Prior to the trial, a legume/cereal mixed cover crop was grown during the winter and mowed and disked in the spring. Based on a preliminary V. dahliae population test, the site with the highest baseline V. dahliae population was selected (5 microsclerotia/gram soil). A randomized block split-plot experiment with crop (broccoli, cauliflower, and fallow) as main plots and strawberry treatments ASD, MC, ASD+MC, and untreated check (UTC) as sub plots with 4 replicates. Sub plots were established before planting strawberries. Each main plot was 25’ x 24’ and subplot 25’ x 6’. The trial continued for 3 years as described below. Broccoli (cv. Gypsy) and cauliflower (cv. Snow crown) were transplanted in designated plots on 6/16/2011. Broccoli served as a “V. dahliae suppressive” crop, whereas cauliflower served as a “neutral” crop since it hosts a strain of V. dahliae that does not infest strawberries. Fallow plots were kept bare and cultivated periodically to suppress weeds. Broccoli and cauliflower were harvested at maturity from 8/15/11 till 8/31/11 (6 times). The broccoli and cauliflower residues were sampled for biomass determination and mowed on 8/31/1, and incorporated into the soil on 9/2/11. On 9/20/11, strawberry beds were listed. Split plot treatments were established on 9/21/11 as follows; for the ASD treatment, 9 t/A of rice bran was applied to the bed surface and rototilled to 6” depth. For the mustard cake (MC. Brassica juncea: Sinapis alba = 1:1 by weight. Farm Fuel, Inc, Freedom, CA) treatment, MC was applied at 1.5 t/A, and incorporated into 6” of the bed, then covered with plastic mulch (green). For the ASD + MC treatment, 7.5 t/A of rice bran and 1.5 t/A of MC (total 9 t/A) were applied and incorporated in the same manner. Drip tapes were laid and plastic mulch applied on the same day at all plots. Drip irrigation was applied to ASD and ASD+MC plots on 9/26, 9/27, and 10/10 (total 4.3 ac-in) to maintain soil water conditions above field capacity. Strawberry plants (cv. Albion) were transplanted into all plots on 11/16/11. 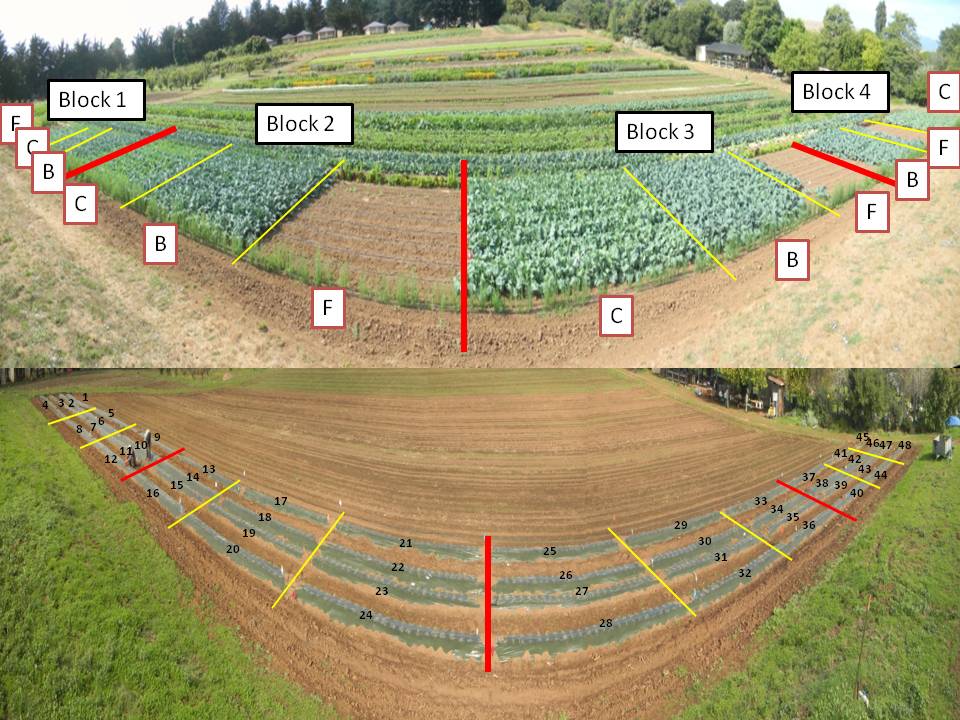 Strawberry fruits from a harvest station with 20-marked plants in each plot were harvested and weighed for marketable and unmarketable fruits twice per week from 4/9 to 9/27/12. Soil pH was measured at the end of strawberry season (9/28/12) and 4t/ac of dolomite was applied to all plots to correct acidity based on the pH buffer curve developed using the plot soil. At the end of the strawberry season, plants were mowed and the field carefully disked and spring tooth cultivated to
 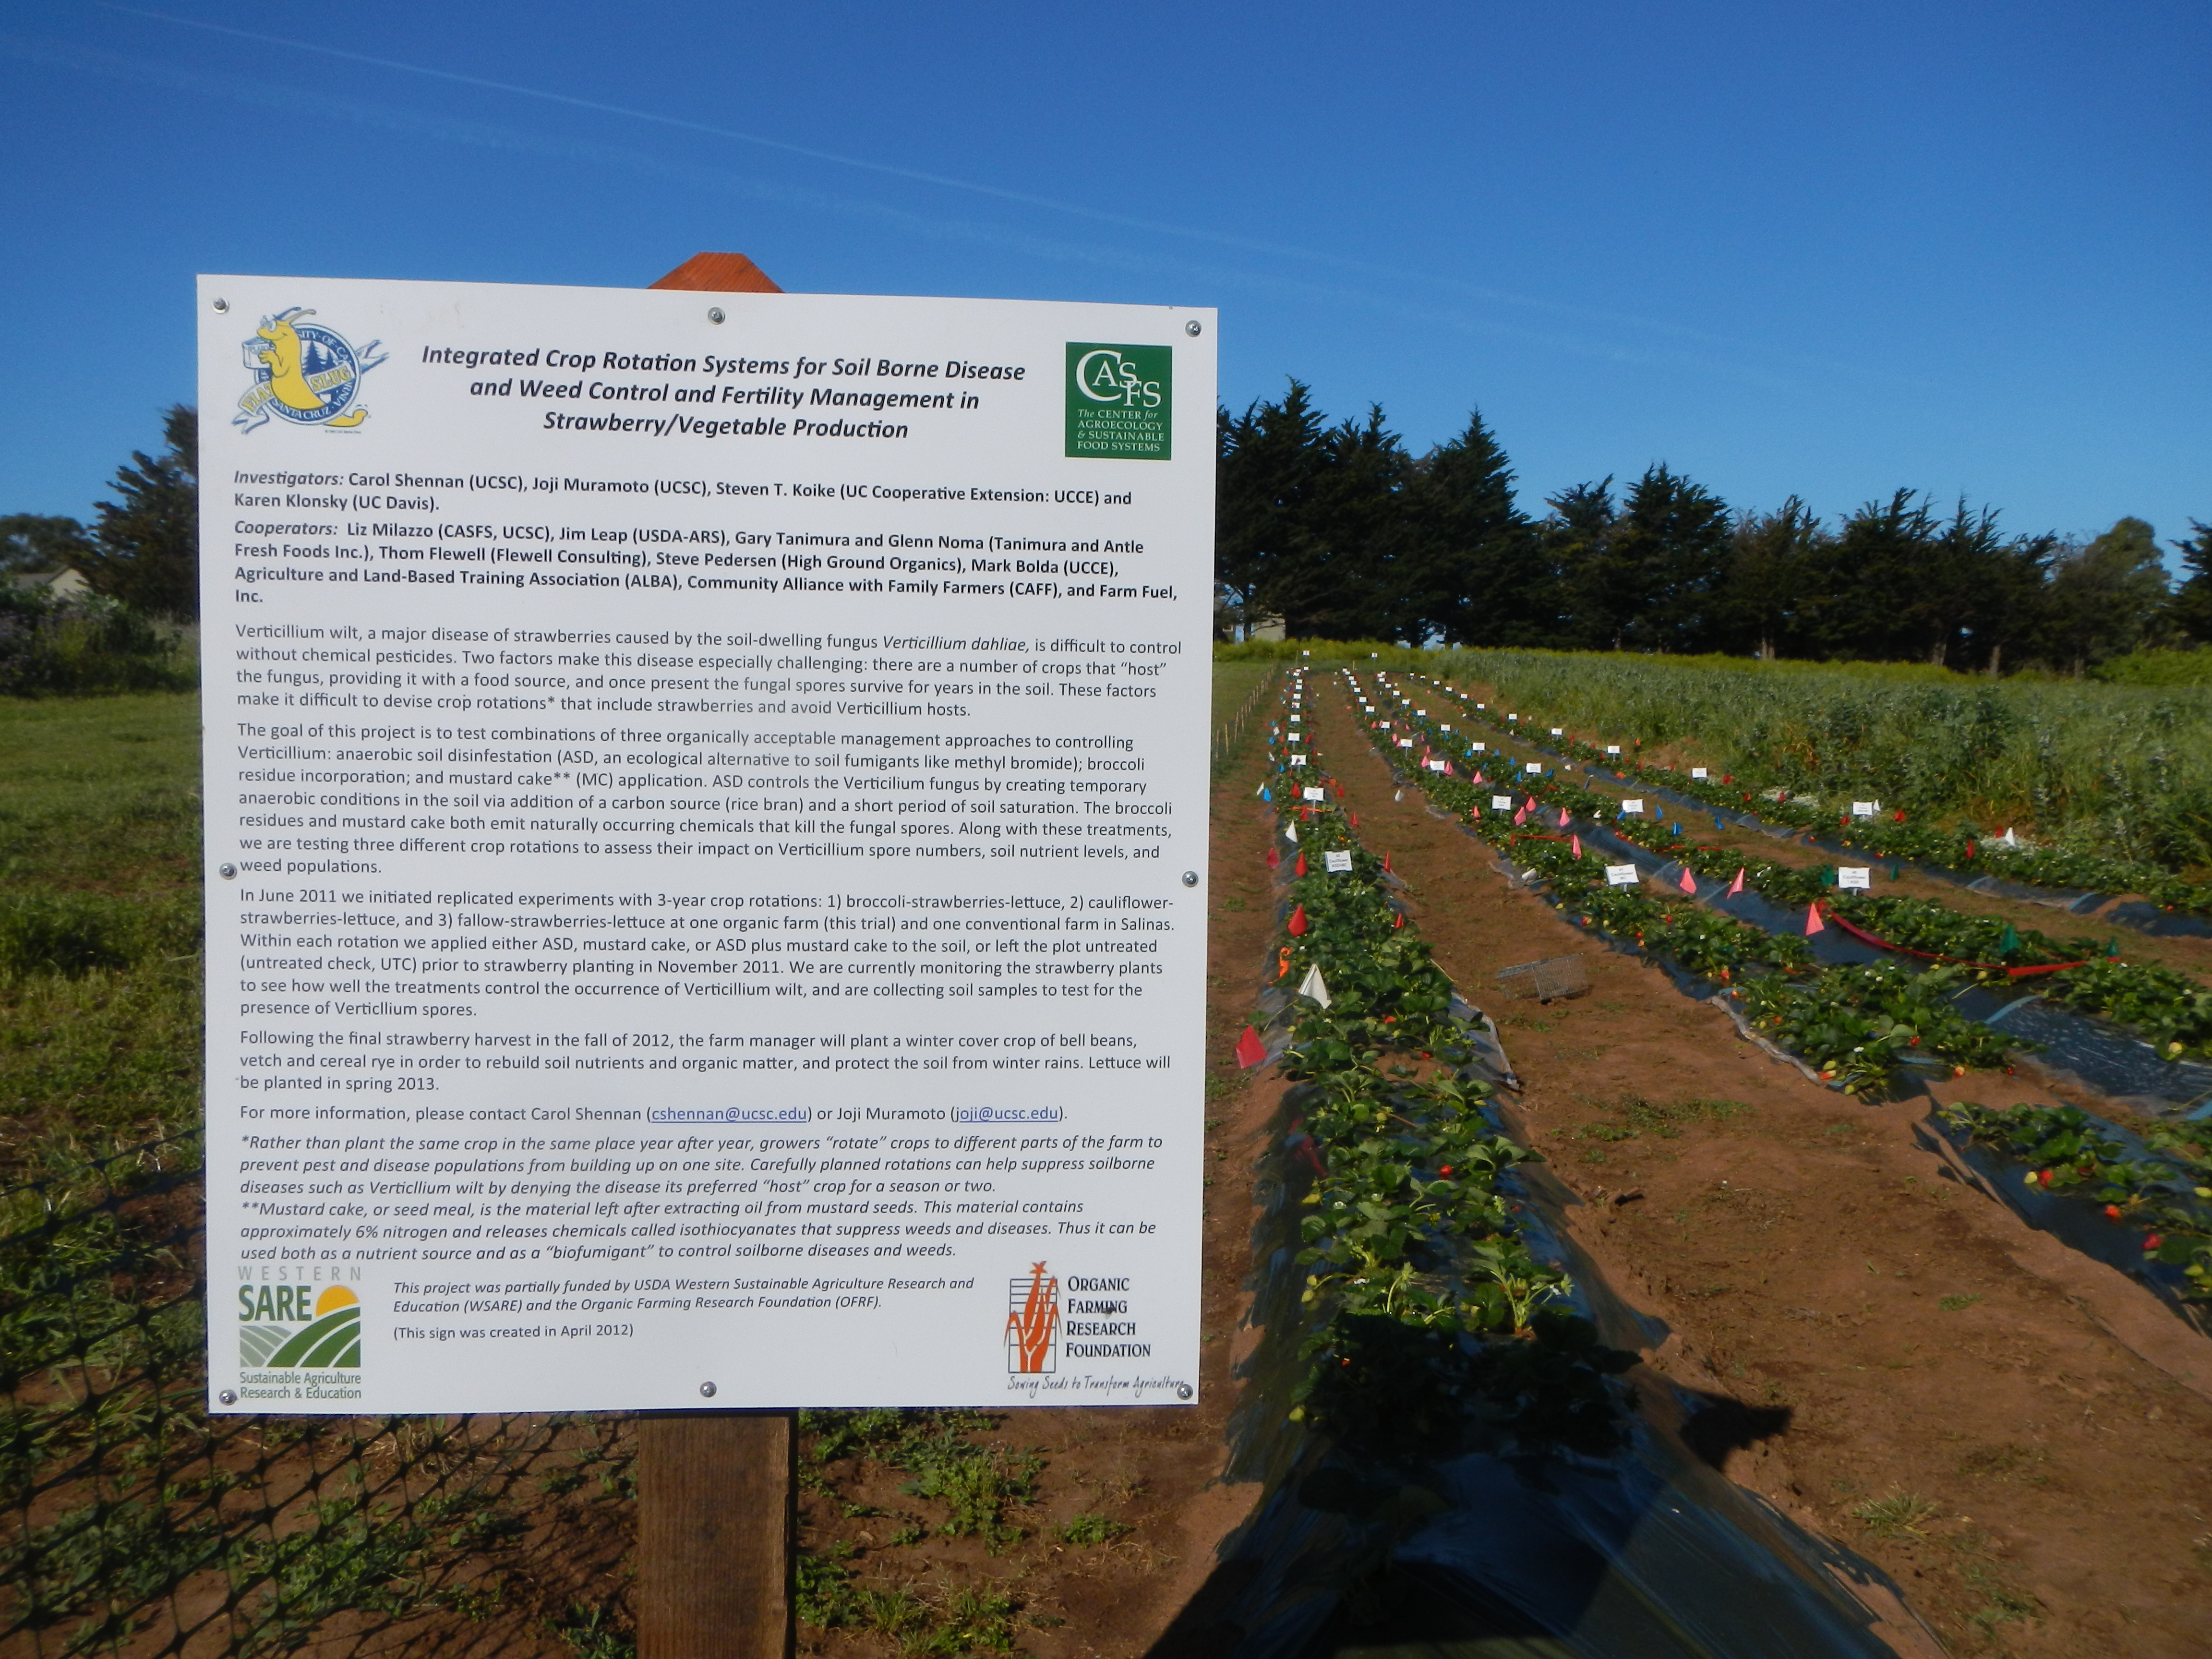 maintain integrity of each plot. A mixed cover crop (45% bell beans, 45% purple vetch, 10% AGS104 rye) was direct sown in all plots at a rate of 300 lbs/A on 11/6/12. Between 3/20 and 3/27/13, the cover crop was mowed and incorporated using a spader. At the end of July 2013, the field was springtooth cultivated and 36” wide beds were listed. On 7/30/13, Romaine lettuce transplants (cv. Salvius) were planted to all plots. Lettuce was harvested on 9/10/15 in block 3-4 and on 9/13/13 in block 1-2. Marketable head yield and total biomass of lettuce was recorded.
A similar field trial was established in a conventional field (Pacheco clay loam; a V. dahliae count of 12 microsclerotia/gram soil) in Salinas, CA. The experimental design was the same as the UCSC site except for fumigation as an additional split plot treatment. Broccoli (cv. Patron) was direct seeded and cauliflower (cv. 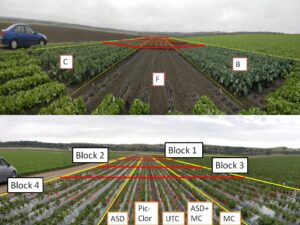 Absolute) transplanted to assigned plots on 6/21/11. Broccoli and cauliflower were mowed and incorporated before plants reached full maturity due to conflicts with land preparation for the following strawberry crop. Strawberry beds were listed on 9/16/11. On the same day, ASD, MC, and ASD+MC split plots were established as for the UCSC site. Drip tapes were laid and plastic mulch applied on 9/17/11. Drip irrigation was applied to ASD and ASD+MC plots on 9/28, 9/30, 10/8 and 10/17 (total 3.2 ac-in). Fumigation with Pic-Clor 60 at 300 lb/A was drip applied to fumigation plots on 10/2/11. Strawberry plants (cv. Monterey) were transplanted to all plots on 11/11/11. Strawberry fruits were harvested and weighed from 4/30 to 7/30/12 twice weekly, twice in August and then terminated due to the labor shortage of the collaborating grower. Thus the yield data reflect the early yield over a 3 month period. The original plan was to plant lettuce in the spring of 2013. However, the grower was unable to complete the trial and it was terminated in Oct. 2012.
N dynamics and N loss during rainy winter:
For Santa Cruz site, soil samples for inorganic N (0”-6” and 6”-12” depth) tests were taken on 9/1/11, 9/20/11(post-broccoli incorporation /pre-ASD treatment), 10/31/11 (post-ASD/MC treatment), 12/2/11, 1/17/12, 2/22/12, 4/13/12, 6/20/12, 8/7/12, (strawberry season). 10/4/12 (post-strawberry harvest season/pre-cover crop planting), 12/13/12, 1/17/13, 3/11/13 (post-cover crop), 7/29/13 (pre-lettuce planting), 9/10/13, and 9/13/13 (post-lettuce harvest). Nitrate and ammonium in soil samples were extracted using 2M KCl and analyzed by a flow injection analyzer. Strawberry biomass samples were taken on 1/10, 2/24, 4/20, and 9/28/12 and total N content was determined using a CN analyzer. For the Salinas site, soil samples for inorganic N were collected and analyzed on 8/24/11, 9/16/11 (post-broccoli incorporation /pre-ASD treatment), 10/25/11 (post-treatment), 11/22/11, 1/5/12, 2/15/12, 4/6/12, 5/18/12, 7/25/12 (strawberry season), and 10/12/12 (post strawberry). Strawberry biomass samples were taken on 1/6/12, 2/17/12, 4/6/12 and 10/19/12 and total N content determined. N loss was estimated for the winter raining season after sub treatment were applied and strawberries transplanted in November 2011. The amount of N loss was calculated from the changes in soil inorganic N content in the top 12 inches of soil and strawberry plant N uptake for each sub treatment for a 20 week period from the day of strawberry transplanting to 20 weeks after transplanting. We used changes in soil inorg-N concentration between 10/31/11(T0) and 4/13/12 (T1) for the UTC plots and 12/2/11 (T0) and 4/13/12 (T1) for all other treatments at the Santa Cruz site. For the Salinas site we used changes in soil inorg-N concentration between 11/22/11 (T0) and 4/6/12 (T1) for MC, Pic-Clor and UTC plots and 1/5/12 (T0) and 4/6/12 (T1) for ASD and ASD+MC. The first date (T0), correspond to the highest inorg-N peak for each sub treatment. The formula used to calculate N loss is:
N loss = (Inorg-N T0-Inorg-NT1)-(N plant uptakeT1-N plant uptakeT0)
where N plant uptakeT1 = biomass N of whole plants at 20 weeks after treatment application (4/20/12), N plant uptakeT0 = biomass N of transplants.
The loss estimated does not account for any N mineralization from soil organic matter taken place between sampling points, and is therefore a conservative estimate. This loss represents the sum of leaching, surface run off, and denitrification, but also includes any immobilization by microorganisms in the soil.
Wilt score evaluation and V. dahliae soil and plant test:
At the Santa Cruz site, disease symptoms were visually evaluated for plants in the harvest station on 5/29, 7/16, and 9/6/12 using subjective wilt scores as follows: 1 = healthy plant, 2 = moderately stunted, 3 = moderately stunted and slight outer rosette of dead leaves, 4 = moderately stunted and moderate outer rosette of dead leaves, 5 = significantly stunted and slight outer rosette of dead leaves, 6 = significantly stunted and moderate outer rosette of dead leaves, 7 = significantly stunted and significant rosette of dead leaves, and 8 = dead plant. Four entire plant samples were removed from each plot on 9/27/12 and crown tissues tested for V. dahliae infection. Soil samples to estimate the numbers of V. dahliae microsclerotia in the soil were taken from the top 6” of soil at each plot. Baseline soil samples were taken on 6/15/11. Post broccoli/cauliflower samples were collected on 9/1/11 and pre ASD/MC treatments application on 9/20/11. Post ASD/MC treatments soil samples were taken on 10/31/11 and post strawberries on 9/28/12. The last set of samples were collected post lettuce on 9/10/13. Soils were air dry in a controlled temperature (23 °C ±2 °C) greenhouse. After drying soils were mixed and pulverized using a mortar and pestle and passed through a 0.5mm sieve. With the Anderson sampler, 0.5 g of pulverized soil from each sample were distributed over six Petri dishes containing selective medium. Plates were incubated in the dark at 22 to 24 °C for 3 weeks. After incubation Petri dishes were examined for V.dahliae microsclerotia cluster and the count was expressed as microsclerotia g-1 dry soil. Similarly, for the Salinas site, degree of plant wilt was visually evaluated for plants in the harvest station on 10/19/12 and 3/9/12. Topsoil from 06/08/11 (baseline), 08/24/11 (broccoli/cauliflower harvest), 09/16/11 (pre-treatment), 10/25/11(post treatment) and 10/12/12 (post strawberries) were tested for viable V. dahliae populations.
Weed density and weeding time:
In Santa Cruz site, a clear plastic window (1m x 0.5m) for weed density measurement was created in each plot on 12/12/12 and the density measured on 1/30, 2/24, 4/5, 5/17 and 8/2 in 2012. In addition, weeding time for bed area was measured for each plot on 1/30, 4/5, 5/17 and 8/2/12. For Salinas, site, a weed observation window was established in each plot on 12/19/11 and weed density measured on 2/10, 3/9, 5/4, 6/12 and 7/25/12. Weeding time was measured on 2/10, 5/4, 6/12 and 7/25/12.
Objective 2
A replicated field trial was established in an organic farm (Arnold loamy sand) in Watsonville, CA. A split-split plot experiment with 4 replicates was initiated with: mustard cake (MC. Brassica juncea: Sinapis alba,1:1 by weight) 1,000 lbs/acre, MC 2,000 lbs/acre, and pelleted organic fertilizer (OF. Perfect Blend 4-4-2. Chicken manure-based) 1,000 lbs/acre (grower’s standard) as main plots; plant back periods of 1, 2, 3 and 4 weeks as split plots; and with and without plastic mulch (clear TIF film) as split-split plots. Each plot was 4’ x 5’. On 3/14/12, after taking soil samples (0”-6” depth) for inorganic N analysis, MC and OF were applied to assigned plots, incorporated into ~1” depth with rakes, and a half of each plot was covered by clear TIF film for the 4 week treatment. The process was repeated on 3/22 for the 3 week treatment, on 3/28 for the 2 week treatment, and on 4/4 for the 1 week treatment. On 4/11/12, after removing the plastic mulch, weed density was counted, soil samples for inorganic N analysis were taken, and 12 Romaine lettuce transplants (cv. Salvius) were planted at 10” spacing at each plot. Weekly weed density monitoring was continued until 5/16/12. A 1,000 lbs/acre of OF was top dressed on 5/7/12 and 12 gallons/acre of AgroThrive LF (2.5-2.5-1.5) was sprinkler applied on 5/22/12 to all plots as in-season N applications. On 5/30/12, 8 mature Romaine lettuce plants in the middle of each plot were harvested and fresh biomass measured. To evaluate residual inorganic N, soil samples (0”-6” depth) were taken on 5/31/12. Soil inorganic N was analyzed as described above.
Objective 3
See "Publication/outreach" section.
Objective 1
Santa Cruz Site
Broccoli and Cauliflower Yield: Head yield of broccoli and cauliflower averaged 6.4 t/A and 4.2 t/A, respectively. Residue biomass (dry weight) of broccoli was 3.5 t/A, and of cauliflower was 4.0 t/A. For head yield and residue biomass, no significant differences were found between plots assigned to different sub-treatments for either crop (P<0.8) showing good uniformity of production across the field.
Strawberry Growth and Yield: From December 2011 to January 2012, salt burn damage on strawberry leaves was observed in all plots but was slightly higher in MC. In February, plant biomass was highest in ASD and lowest in MC (P=0.007**). In April, ASD, ASD+MC and MC had greater biomass than UTC (P=0.0007***) (Fig. 1).
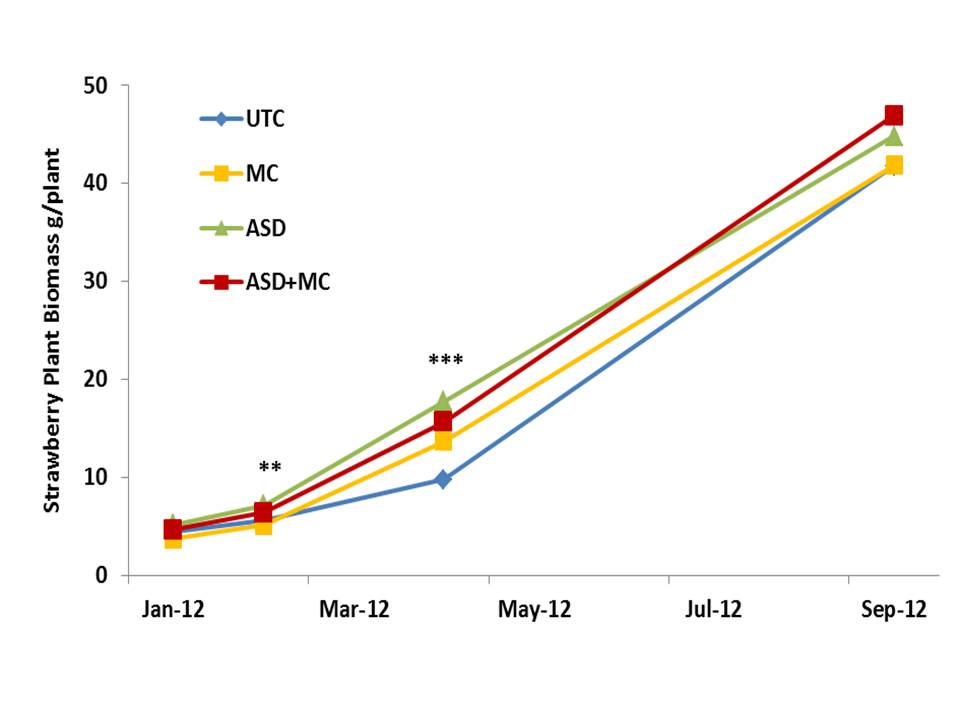 Figure 1. Changes in strawberry plant biomass at the Santa Cruz site. Sub plot averages are shown. UTC; untreated check, MC; mustard cake, ASD; anaerobic soil disinfestation. **, ***; significant at 1% and 0.1%, respectively.
Some plants started to show wilt symptoms in May and the symptom progressed as plants senesced. At the end of the season, UTC had the highest wilt score and ASD the lowest (P=0.043*). This coincided with the plants from UTC having higher V. dahliae infection rates than ASD and ASD+MC (P=0.006**. Fig. 2).
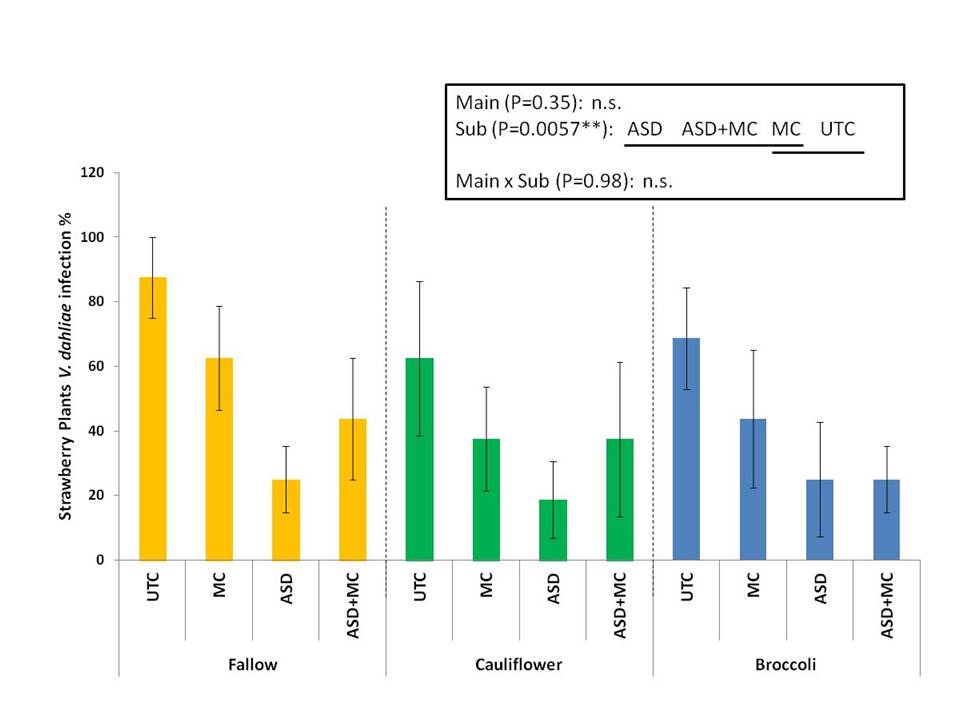 Figure 2. Verticillium dahliae infection level on strawberry plants at the Santa Cruz site. Main plots are fallow, cauliflower and broccoli. Sub plots are UTC (untreated check), MC (mustard cake), ASD (anaerobic soil disinfestation) and ASD+MC. Treatments on the same line are not significantly different according to Tukey’s HSD test at P < 0.05.
No differences in biomass, wilt scores and V. dahliae infection rate were found between main plots (broccoli, cauliflower or fallow in preceding year). Throughout the harvest season, fruit yield was higher in ASD+MC and ASD treatments than UTC and MC (Fig. 3).
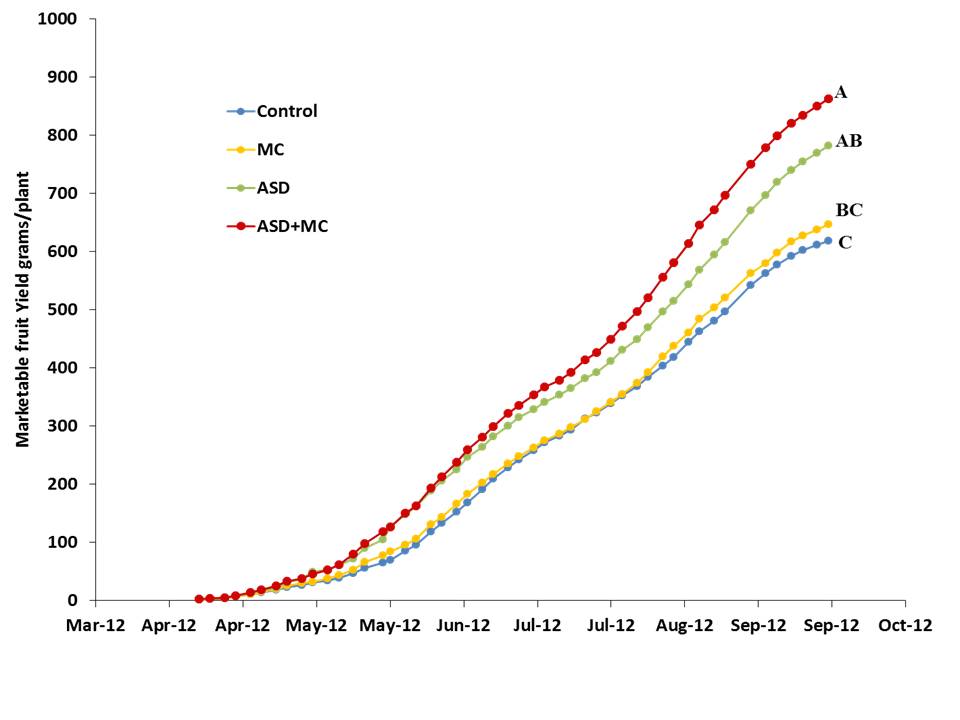 Figure 3. Changes in cumulative marketable fruit yield at the Santa Cruz site. Sub plot averages are shown. UTC; untreated check, MC; mustard cake, ASD; anaerobic soil disinfestation. Treatments with the same letter are not significantly different according to Tukey’s HSD test at P=0.05.
Cumulative marketable fruit yield at the end of the harvest season (September 12) was greatest in ASD+MC (averaged 862 g/plant), followed by ASD (781 g/plant), MC (646 g/plant), and lowest for UTC (618 g/plant) (P=0.0001***, Fig. 3). There was no difference in cumulative marketable fruit yield between main plots (P=0.58). The high inorg-N availability at ASD+MC and ASD plots due to RB and MC mineralization might have caused the early boost in yields recorded from these plots (Fig. 4).
The higher yields recorded towards the end of the strawberries season might, on the other hand, be due to disease suppression shown by ASD+MC and ASD treatments.
Cover crop biomass: Cover crops grew uniformly across treatments. No significant differences were found between any treatments on total dry above ground cover crop biomass. Similarly, uniformity across treatments was observed on each cover crop species biomass. No difference was found among main treatments and the only significant difference among split treatments was between ASD and UTC; ASD plots had a higher bell bean biomass compare to UTC (P=0.008**).
Romaine lettuce yield: Romaine marketable yield showed no significant difference either in main (P=0.43) or split plots (P=0.18). No difference occurred in total yield (heads and residue) where values in main and split plots averaged around 1 ton/acre.
V. dahliae microsclerotia population in soil: Viable V. dahliae microsclerotia population in topsoil prior to the strawberry planting was rather low: it averaged 1.5 per gram of soil pre-ASD/MC application. Post-ASD/MC application, viable V. dahliae microsclerotia was completely eliminated by ASD and ASD+MC whereas it was 0.3 to 0.5 for MC and UTC (P=0.15). At the end of the strawberry season, V. dahliae was below the detection limit in all plots. However, at lettuce harvest, it increased to 2.8 per gram of soil in the UTC but remained significantly lower in the ASD (0.3) and ASD+MC (0.7) treatments (Table 1).
Table 1. Changes in V. dahliae count in soil at Santa Cruz site. Statistical analysis was performed for log-transformed data. Numbers in the table show the back-transformed populations of viable V. dahliae microsclerotia/gram soil. Averages with the same letter do not have significant difference at the P=0.05 by Tukey-HSD test.
|
Treatment |
Sampling Date |
|||||||
|
Baseline |
Post- Broccoli/ Cauliflower |
Pre-ASD/MC |
Post-ASD/MC |
Post- Strawberries |
Post- Lettuce |
|||
|
6/15/2011 |
9/1/2011 |
9/20/2011 |
10/31/2011 |
9/28/2012 |
9/10/2013 |
|||
|
Main plot |
||||||||
|
Fallow |
0.6 |
0.0 |
1.5 |
0.5 |
0.0 |
1.3 |
||
|
Cauliflower |
0.4 |
0.4 |
2.1 |
0.0 |
0.0 |
0.9 |
||
|
Broccoli |
0.5 |
0.3 |
1.0 |
0.1 |
0.0 |
1.8 |
||
|
ANOVA (P) |
0.81 |
0.24 |
0.51 |
0.35 |
- |
0.37 |
||
|
Sub plot |
||||||||
|
UTC |
1.2 |
0.7 |
1.5 |
0.5 |
0.0 |
2.8 a |
||
|
MC |
0.0 |
0.2 |
1.7 |
0.3 |
0.0 |
1.3 ab |
||
|
ASD |
0.5 |
0.0 |
1.3 |
0.0 |
0.0 |
0.3 b |
||
|
ASD+MC |
0.3 |
0.0 |
1.7 |
0.0 |
0.0 |
0.7 b |
||
|
ANOVA (P) |
0.06 |
0.08 |
0.99 |
0.15 |
- |
0.019* |
||
Goud et al. (2004) showed that ASD’s Verticillium suppression lasted for four years in tree nurseries where soil disturbance is none to minimal during the growth period. This data shows ASD’s ability to suppress V. dahliae’s re-infestation even after 2 years from the treatment in strawberry/vegetable production systems involving major soil disturbances. Future study should examine the mechanism of this phenomenon.
Soil inorganic N dynamics: At the beginning of the trial about 20 mg/kg of soil NO3-N was detected at both top and sub soil. By harvest in Sept., broccoli and cauliflower had depleted NO3-N at both depths whereas in fallow plots the initial NO3-N level remained. As crop residues were incorporated, at the beginning of Sept, and rice bran and MC applied, at the end of Sept, soil inorganic N in the top and sub soil rapidly increased and peaked in Nov. to Dec. when NO3-N and NH4-N reached 60-120 mg/kg and 10-50 mg/kg, respectively in the top soil (Fig. 4).
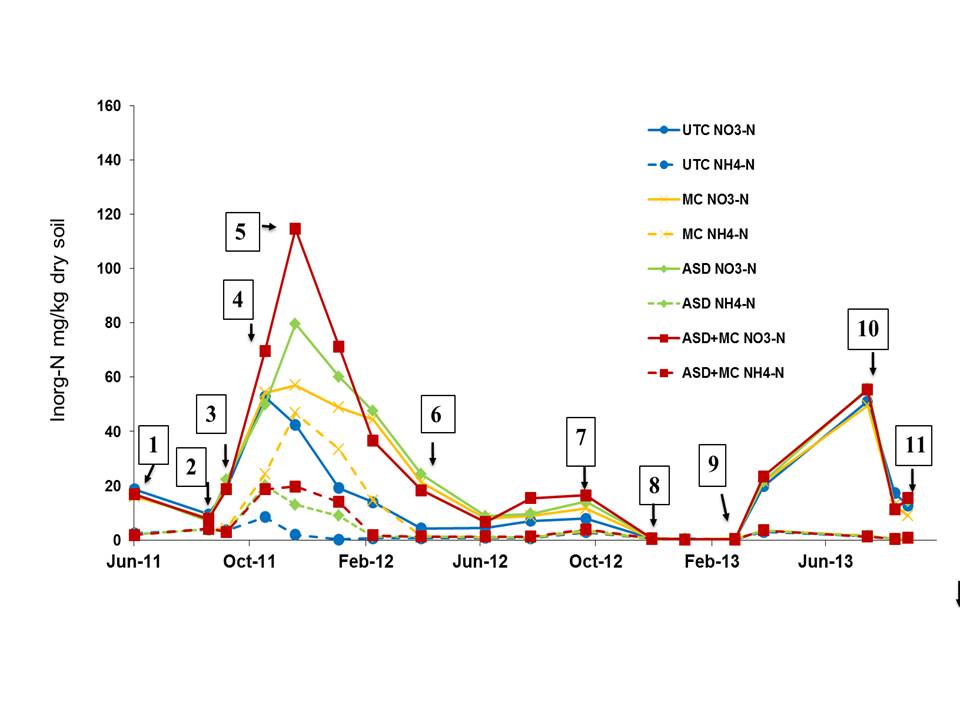 Figure 4. Soil inorganic N dynamics at 0”-6” depth at the Santa Cruz site. Sub plot averages are shown. UTC; untreated check, MC; mustard cake, ASD; anaerobic soil disinfestation. NO3-N solid lines; NH4-N dashed lines. 1.Broccoli /Cauliflower transplant; 2. Broccoli/Cauliflower harvest; 3. Pre treatments; 4. Strawberry planting; 5. Post treatments; 6. First strawberry harvest; 7.Last strawberry harvest; 8. Cover crop planting; 9. Cover crop incorporation; 10. Lettuce transplant; 11. Lettuce harvest.
Similar peaks were recorded in the sub soil where NO3-N peaked at 40-70 mg/kg. NH4-N concentration in the sub soil stayed lower at all treatments and peaked at 15 mg/kg at MC plots. Cauliflower residues appeared to be decomposed and release inorganic N faster than broccoli residues; NO3-N in cauliflower plots peaked in Nov. versus Dec. for the broccoli plots. The NO3-N peak in Dec was highest for fallow, followed by broccoli and cauliflower for main plots (P=0.007**). For sub plots, it was highest in ASD+MC, followed by ASD, MC, and UTC (P=0.0001*** Fig. 4). After that, soil inorganic N concentration gradually decreased at all plots regardless of treatment. MC, ASD, and ASD+MC treatment received approximately 180 lb/ac, 360 lb/ac, and 480 lb/ac of total N, respectively, from MC or rice bran for ASD. Soil inorganic N dynamics at ASD, ASD+MC, and MC showed rapid mineralization of rice bran (ASD plots) and MC within 2 to 3 months from incorporation and it continued for 5 to 6 months. The high NO3-N concentration in Dec to Jan raised soil salinity and caused salt burn to the strawberry plants, a widespread phenomenon in the region, including our Salinas trial, due to the dry and warm winter. At the end of the strawberry season NO3-N and NH4-N concentration were very low for both top and sub soil. NO3-N at both top and sub soil ranged from 7.9 mg/kg at UTC to 16.5 mg/kg at ASD+MC plots. NO3-N concentration increased after cover crop incorporation in March 2013 and peaked in July 2013 with values around 50 mg/kg for all sub plots at both depths. After lettuce in Sept 2013 values of NO3-N decrease to around 30 mg/kg at all plots at both depths.
N loss during raining season: High soil nitrate in winter rainy season raises a concern of potential N losses via leaching and run off particularly given the shallow and undeveloped strawberry’s root systems during that time. The amount of N loss was estimated from the changes in soil inorganic N (Inorg-N) content in top 12” soil depth and strawberry plant N uptake for a 20 week period from the transplanting day in Nov. Cauliflower, broccoli, and fallow main plot had estimated N-loss of 124, 209, and 197 kg-N/ha, respectively, but no statistical difference was observed between treatments (P=0.16). Among sub plots, ASD+MC plots showed the highest N loss with 223 kg-N/ha, followed by MC plots (218 kg-N/ha) and UTC (150 kg-N/ha) and ASD plots showed the least N loss (116 kg-N/ha) despite the high N input (P=0.003. Table 2).
Table 2. Estimated N loss during the winter rainy season at the Santa Cruz site. Data are in kg-N/ha.
|
Treatment |
N soil T0 |
N soil T1 |
Δ Inorg-N Soil |
Plant N T0 |
Plant N T1 |
Δ Plant N uptake |
N loss |
||
|
10/31/11 |
12/2/11 |
4/13/12 |
10/31/11 |
12/2/11 |
Transplant |
4/20/12 |
As of 4/13/12 |
||
|
UTC |
181 |
15.5 |
165 |
3.2 |
18.4 |
15.2 |
150 |
||
|
MC |
301 |
59.9 |
241 |
3.2 |
26.8 |
23.6 |
218 |
||
|
ASD |
223 |
73.9 |
149 |
3.2 |
36.3 |
33.1 |
116 |
||
|
ASD+MC |
315 |
62.0 |
253 |
3.2 |
32.6 |
29.4 |
223 |
||
The lowest N loss in ASD plots might be due to slower mineralization of rice bran compared to MC and higher plant N uptake. By 12/2/11, 81% of the MC applied to the MC only plots was mineralized contrapose to only 26% mineralization of the RB applied to the ASD only plots. This slower release of plant available nutrients especially ammonium as first step of the mineralization process, might play an important role in reducing nutrients leachate and at the same time enhance plant growth.
Weed density and weeding time: Cauliflower plots had lower weed density than broccoli and fallow plots among main plots (P=0.046), but no difference was found between subplots (P=0.17, Fig. 5). Although weeding time showed a similar trend with the weed density, there was no difference between the main plots and UTC (average 34 hrs/acre) had longer weeding time than ASD (average 20 hrs/acre).
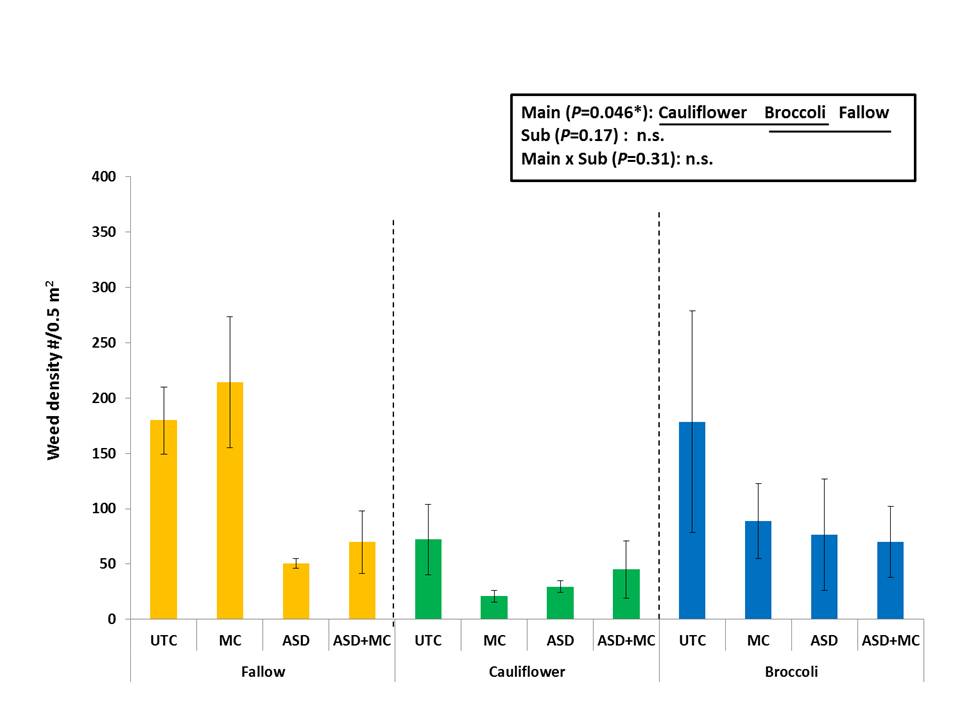 Figure 5. Weed density during strawberry production at the Santa Cruz site. Total # of weeds/0.5 m2 from Jan 2012 to Aug 2012. Main plots are fallow, cauliflower and broccoli. Sub plots are UTC (untreated check), MC (mustard cake), ASD (anaerobic soil disinfestation) and ASD+MC. Statistical analysis was performed for log-transformed data. Each bar shows mean ± SEM (n=4) of the original data. Treatments on the same line are not significantly different (Tukey’s HSD test (P=0.05)).
Salinas Site
Broccoli and cauliflower yield: Broccoli and cauliflower grew well, but the grower decided to mow and incorporate before plants reached full maturity due to conflicts with land preparation for the following strawberry crop. Fresh biomass of broccoli and cauliflower was 16.2 tons/acre for both crops.
Strawberry growth and yield: Strawberries experienced rather severe salt burn damage in Dec to Jan due to the dry and warm winter and resulting high soil EC. 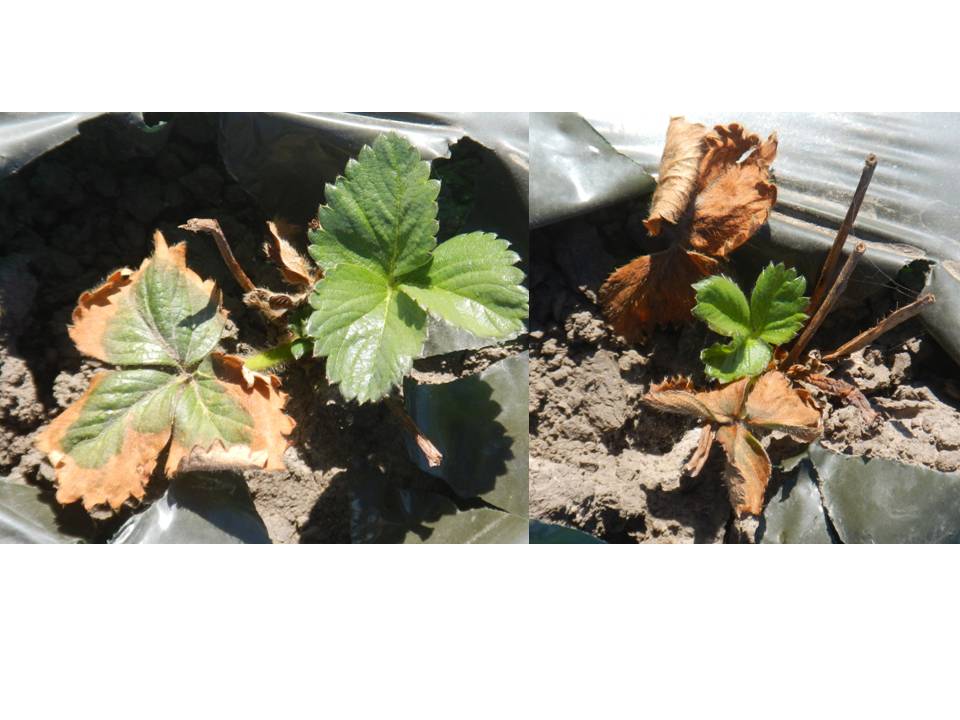 Damage was especially severe in ASD and ASD+MC plots where soil EC exceeded the threshold for salt sensitive crops such as strawberries. Cumulative early to mid season marketable fruit yield of strawberries in ASD+MC and ASD treatments was similar to Pic-Clor, and ASD+MC and Pic-Clor had a significantly higher yield than UTC. (P=0.01. Fig. 6). No difference in marketable yield was found between main plots (P=0.58).
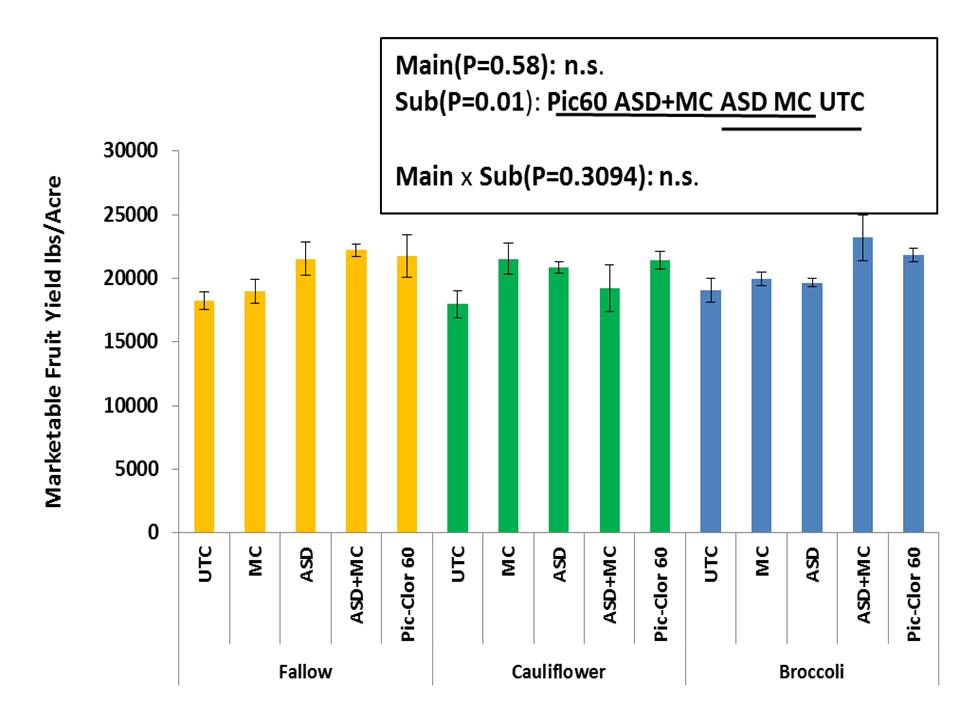 Figure 6. Cumulative marketable fruit yield of strawberries at the Salinas site. Main plots are fallow, cauliflower and broccoli. Sub plots are UTC (untreated check), MC (mustard cake), ASD (anaerobic soil disinfestation) and ASD+MC. Treatments on the same line are not significantly different (Tukey’s HSD test (P=0.05)).
V. dahliae microsclerotia count in soil: Baseline viable V. dahliae microsclerotia in topsoil averaged 16 per gram soil. At broccoli/cauliflower harvest, the number decreased to 5.5. It dropped to 0.46 pre-ASD/MC due probably to dilution with subsoil after chiseling. The count was further decreased to 0.1 after ASD/MC treatment and no difference was found between any treatment (P=0.12). At the end of the strawberry season, V. dahliae microsclerotia counts for soil samples slightly increased to 0.2 but no significant difference was found between any treatment (P=0.67). The plant wilt score at the end of the season, averaged 3.3, much lower than the 4.8 found at the Santa Cruz site; no differences were observed between plots (P=0.22).
N dynamics and N loss in winter: Soil inorganic N dynamics showed a similar pattern as at the Santa Cruz site but overall inorganic N concentration was much higher due to pre-plant chemical fertilizer application (Fig. 7). After broccoli and cauliflower residue incorporation and ASD/MC application in Sept., nitrate concentration peaked in Dec. at 70-150 mg/kg in 0”-6” depth and in Jan. at 70-100 mg/kg in 6”-12” depth in the clay loam soil. Significant differences in both main plots (P=0.05) and subplots (P=0.001) were observed in Dec., indicating N mineralization from crop residues, rice bran and MC was greatest about 3 months after incorporation. Pic-Clor appears to have slowed down nitrification rate in the topsoil: with 20-40 mg/kg of NH4-N from Dec. 11 till April 2012, a much higher level than all other plots (P=0.001 in Jan), and only 30-40 mg/kg of NO3-N from Sep to Feb, much lower than other plots including UTC (Fig. 7).
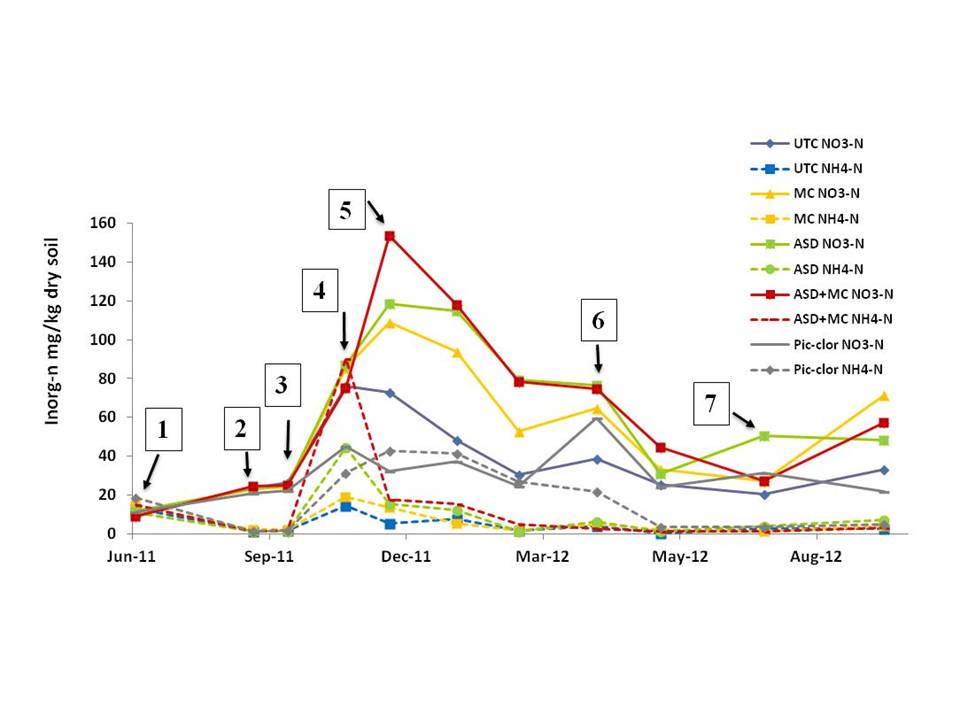 Figure 7. Soil inorganic N dynamics at 0”-6” depth at the Salinas site. Sub plot averages are shown. UTC; untreated check, MC; mustard cake, ASD; anaerobic soil disinfestation. NO3-N solid lines; NH4-N dashed lines. 1.Broccoli /Cauliflower transplant; 2. Broccoli/Cauliflower harvest; 3. Pre treatments; 4. Strawberry planting; 5. Post treatments; 6. First strawberry harvest; 7.Last strawberry harvest.
N loss during raining season: Among main plots, estimated N loss from broccoli plots, cauliflower plots, and fallow plots were 118, 107, and 43.0 kg-N/ha, respectively, and no statistical difference was observed between any treatments (P=0.40, Kruskal-Wallis Nonparametric ANOVA). For the sub plots, ASD, MC, UTC, and ASD+MC plots had estimated N loss of 134, 128, 91.5, and 75.2 kg-N/ha, respectively (Table 3), and again no statistical difference was found between any treatments (P=0.25, Kruskal-Wallis Nonparametric ANOVA).
Table 3. Estimated N loss during the winter rainy season at the Salinas site. Data are in kg-N/ha.
|
Treatment |
N soil T0 |
N soil T1 |
Δ Inorg-N Soil |
Plant N T0 |
Plant N T1 |
Δ Plant N uptake |
N Loss |
||
|
|
11/22/2011 |
1/5/2012 |
4/13/2012 |
11/22/2011 |
1/5/2012 |
Transplant |
4/20/2012 |
As of 4/13/2012 |
|
|
UTC |
205.5 |
112.7 |
85.1 |
120.4 |
3.2 |
25.0 |
21.8 |
91.5 |
|
|
MC |
292.1 |
221.5 |
134.9 |
157.3 |
3.2 |
23.8 |
20.6 |
128.3 |
|
|
ASD |
322.3 |
159.1 |
163.2 |
3.2 |
28.0 |
24.8 |
134.2 |
||
|
ASD+MC |
298.0 |
193.8 |
104.1 |
3.2 |
27.5 |
24.3 |
75.2 |
||
|
Pic-clor |
189.9 |
153.0 |
144.2 |
45.7 |
3.2 |
28.8 |
25.6 |
16.8 |
|
Generally soil inorganic N contents in this trial remained higher and more variable compared to Org trial due to the addition of slow release pre plant fertilizer (Fig. 7). From Nov to March 2012, 145 kg-N/ha were added to the trial. This provided a steady N supply throughout the growing season resulting in still high level of inorganic N recorded at the beginning of April (28.4-64.6 mg-N/kg). Therefore, this N loss estimate may be greatly underestimated.
Weed density and weeding time: Generally weed density in the Salinas site (Fig. 8) was about 1/10 of the Santa Cruz site (Fig. 5). Pic-Clor had lower weed density compared to all other plots (P=0.002. Fig. 8). Main plot treatments did not have any effect on weed density (P=0.22).
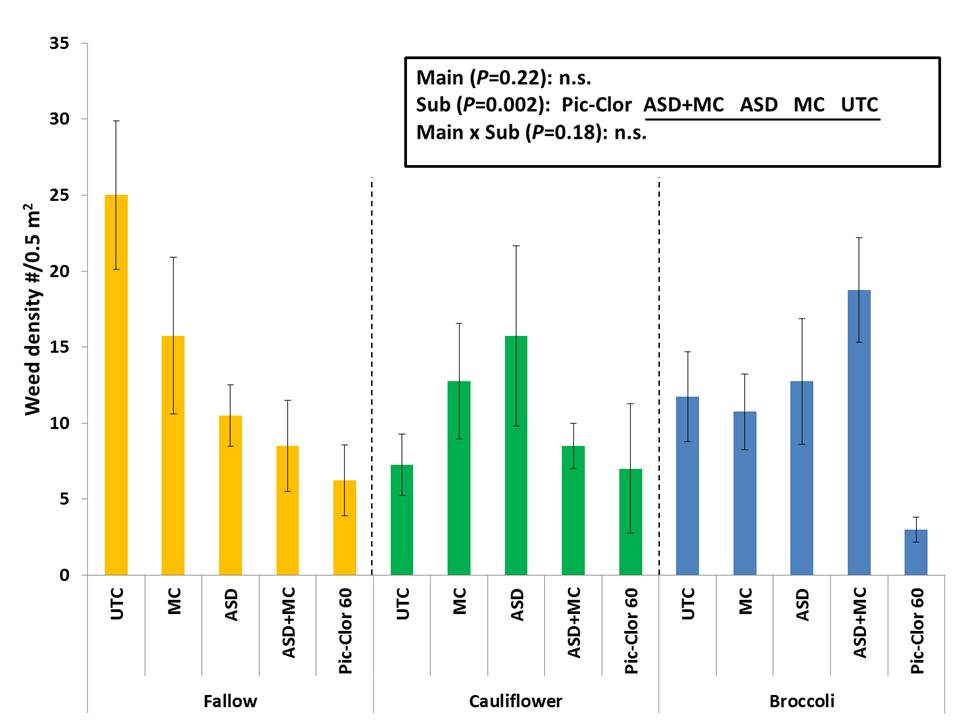 Figure 8. Weed density during strawberry production at the Salinas site. Total # of weeds/0.5 m2 from Jan 2012 to Aug 2012. Main plots are fallow, cauliflower and broccoli. Sub plots are UTC (untreated check), MC (mustard cake), ASD (anaerobic soil disinfestation), ASD+MC and Pic-clor 60. Statistical analysis was performed for log-transformed data. Each bar shows mean ± SEM (n=4) of the original data. Treatments on the same line are not significantly different (Tukey’s HSD test (P=0.05)).
Objective 2
Mustard Cake Plant Back Time Trial for Transplanting Romine Lettuce
Lettuce head weight in the MC 1 t/ac treatment was higher than grower’s standard, but 0.5 t/ac was not (P=0.05. Fig. 14). Use of clear TIF increased lettuce head weight (P<0.0001***. Fig. 9). More specifically, when used with TIF, a 3 week plant back time yielded higher head weight than 1 week at the 1 t/ac rate (P=0.047*), though for 0.5 t/ac rate 1 week seemed sufficient (P=0.52). Without TIF, however, there was no difference in head weight between any plant back time periods indicating that even 1 week is sufficient. Lettuce head weight of MC-applied plots showed a positive linear correlation with inorganic N content in the topsoil on the day of transplanting (R2=0.243***. n=62). This suggests that besides MC phytotoxicity the optimum plant back time also relates to the amount of mineralized N from MC at the time of transplanting. Although MC 1 t/ac with TIF and 3 week plant back time produced the highest head weight, the price of lettuce versus costs of MC and TIF need to be considered to determine the most cost effective option. MC application did not show any effect on weed density of either monocots or dicots sampled from 4/11/12 to 5/16/12 regardless of application rate, use of TIF or not, and plant back period (P>0.10).
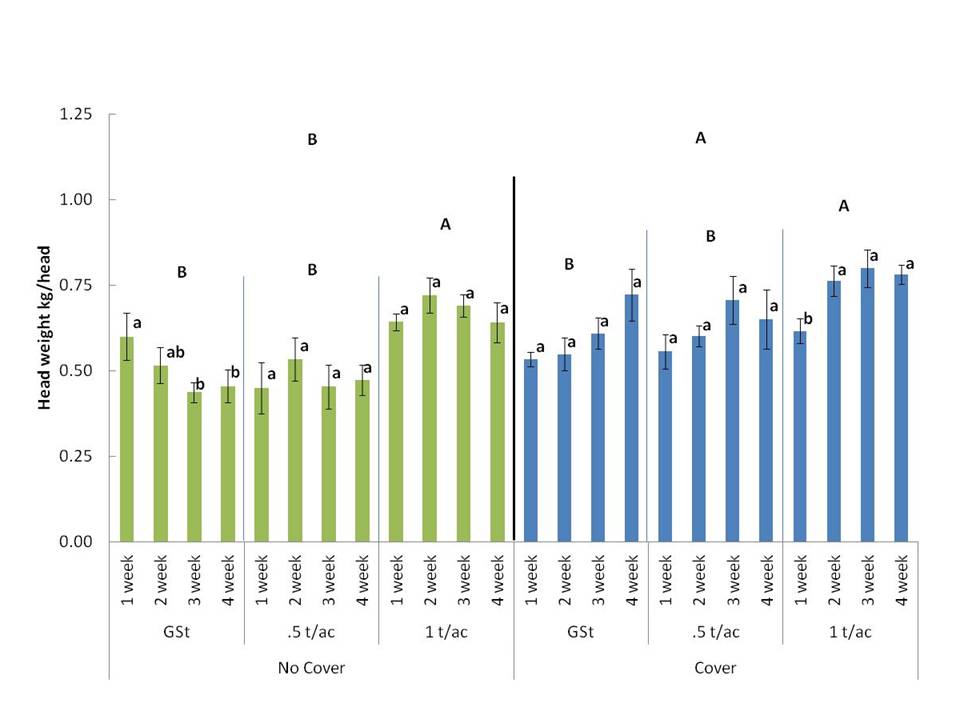 Figure 9. Lettuce fresh head weight at the mustard cake plant back time trial, Watsonville, CA. Main plots are GSt: Grower’s standard method using commercial pelleted organic fertilizer, .5t/ac, and 1 t/ac of mustard cake (MC). Split plots are 1, 2, 3, and 4 weeks of plant back time. Split-split plots are No cover: without plastic mulch, and Cover: with clear TIF film. Treatments with the same letter within main plots, split plots, or split-split plots do not have significant difference by Tukey’s HSD test (P=0.05). Each bar shows mean ± SEM (n=4).
Objective 3
See "Publication/outreach" section.
For objective 1 overall, ASD+MC and ASD produced similar early-mid season fruit yields as Pic-Clor at the Salinas site. ASD+MC produced greater fruit yield than UTC and MC at both sites and ASD at the Santa Cruz site. The yield of ASD and ASD+MC in the Salinas site may, however, have been reduced by the salt damage during early growth. At both sites, when strawberries were transplanted, V. dahliae population in soil was not as high as expected. However, V. dahliae infestation on strawberry plants at the end of the harvest season in the Santa Cruz site was reduced by ASD and ASD+MC (Fig. 2) suggesting that the mechanisms of yield increase by ASD involves disease suppression. At the Org site the number of microsclerotia in the soil after the lettuce rotation, two years after treatments, were still lower at ASD plots than UTC, indicating a lasting suppressive effect of this treatment (table 1). Studies indicate that ASD increases total soil bacteria and fungal populations which may enhance soilborne pathogen suppression due to a highly competitive environment. This has important implications for organic farmers and their ability to reduce the time in between strawberry crops, and to include high profitability crops like strawberry and lettuce.
Weed suppression by ASD and MC appears to be limited. Interestingly, ASD and ASD+MC lowered weed densities more in fallow plots in both sites (Fig. 5 and Fig. 8). The effect of broccoli rotation and MC application in V. dahliae and weed suppression was limited in this study. No synergistic effect of broccoli rotation with ASD and MC was observed. This may be partially due to the unexpectedly low Verticillium pressure of the trial sites. Other studies also suggest that disease suppression from broccoli residues might be species specific.
Research outcomes
Education and Outreach
Participation summary:
Demonstration trial at ALBA
A non-replicated demonstration trial (0.1 acre) with the same design with the Santa Cruz trial in Objective 1 was established in ALBA, Salinas in 2012. Prior to establishing the trial, tomatoes were planted at the site to increase Verticillium dahliae population. Broccoli (cv.De cicco) and cauliflower were grown on 1/3 o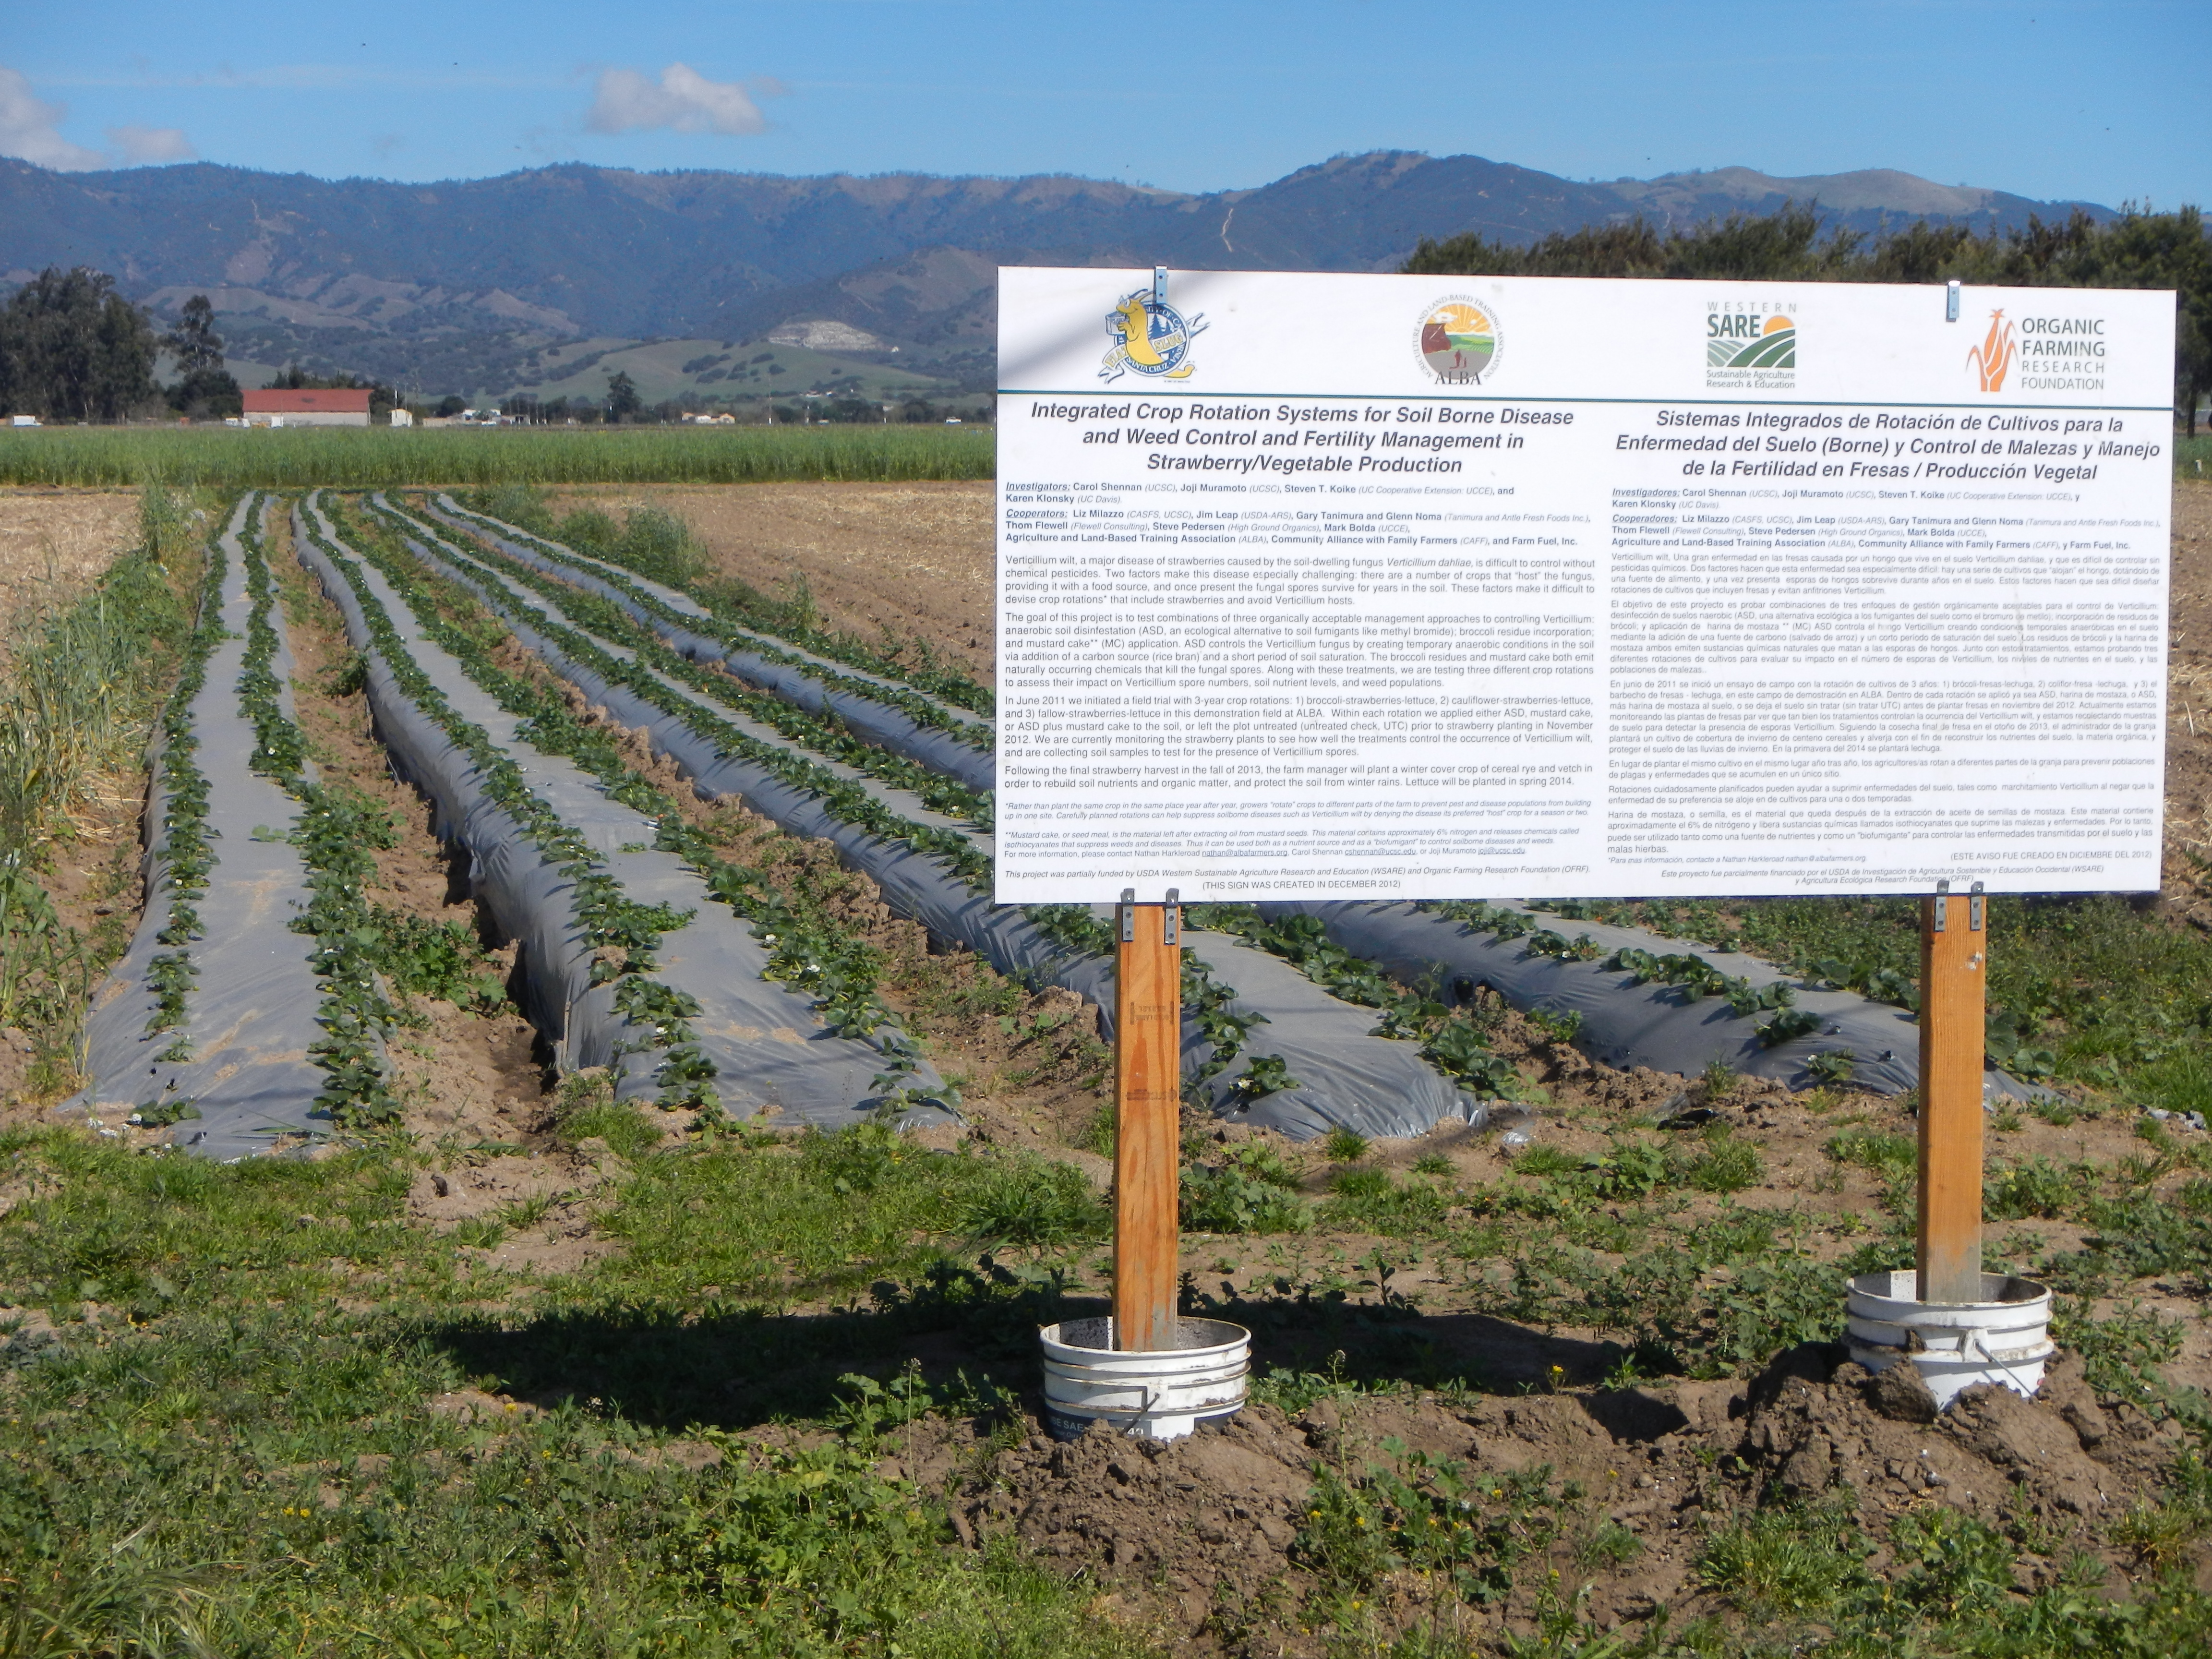 f the site in the summer 2012 as main plots. After harvest, crop residues from broccoli and cauliflower were mowed and incorporated. Split plots of ASD, MC, ASD+MC, and UTC were created as described before transplanting strawberries. Strawberries (cv. Albion) were transplanted to all plots on 11/13/12. A wooden sign in Spanish explaining the goals, approaches, and funding sources of the trial was established at the demo site in January 2013. Strawberry fruit yield from each plot were monitored throughout the harvest season in 2013.
Strawberry plants started to show wilt symptom in April 2013 and, by May, significant plant mortality occurred. For main plots, mortality was highest in the broccoli plots, followed by the fallow plots, and the lowest in the cauliflower plots. 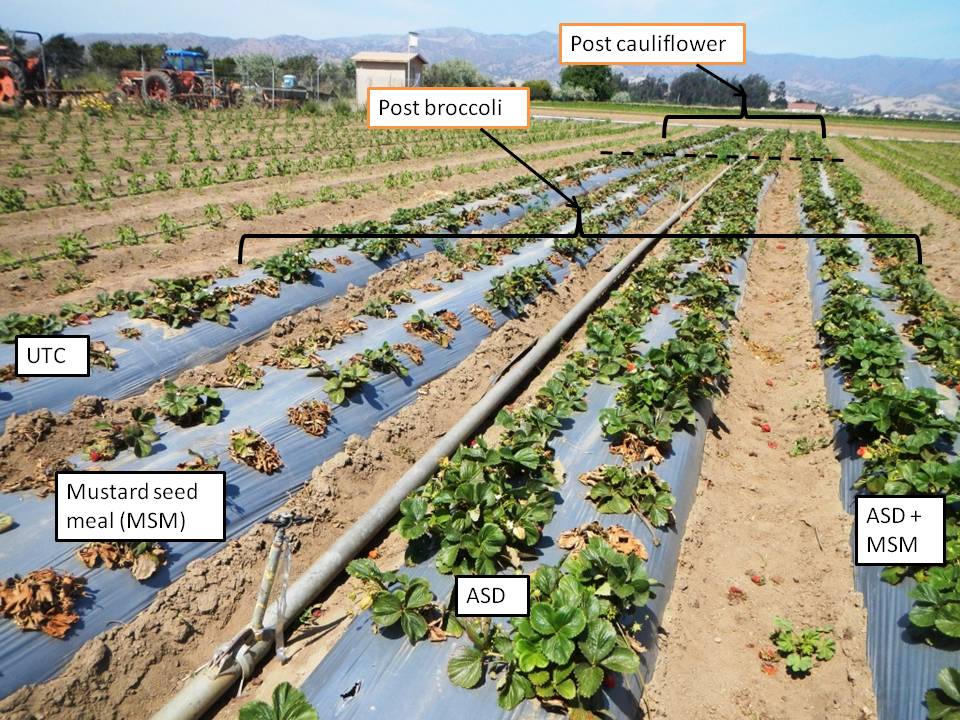 For sub plots, UTC and MC plots had higher mortality compared to ASD and ASD+MC plots. The disease plants were taken to the UCCE diagnostic lab and V. dahliae alone was identified as the pathogen.
Cumulative fruit yield reflected the mortality of the plants; for main plots, the cauliflower plots had the highest yield, followed by the fallow plots, and the lowest in the broccoli plots. For sub plots, the order was ASD > ASD+MS > MC > UTC. There was a strong negative correlation between mortality and cumulative fruit yield (P=0.0001***).
Using this demonstration trial, a field day/workshop on soilborne disease management in organic strawberry production was conducted at ALBA on July 9, 2013 (power point). The workshop mainly targeted Latino growers. We had 14 participants and simultaneous Spanish translation was provided. According to the post-workshop survey, the event was well received by the most participants.
Table 11. A summary of evaluations for the field day/workshop held at ALBA on 7/9/2013. Numbers are %.
| For Everyone | Yes | No | N/A | No Answer |
| Improved my awareness of the topics covered | 90 | 0 | 0 | 10 |
| Provided new knowledge | 90 | 0 | 0 | 10 |
| Provided new skills | 90 | 0 | 0 | 10 |
| Modified my opinions and/or attitudes | 90 | 0 | 0 | 10 |
How many people do you estimate you will share some aspect of this project within the next 12 months?
| 3 | 4 | 5 | 10 | 100s | As Many As Possible | No Answer |
| 10 | 20 | 10 | 10 | 10 | 30 | 10 |
In the next year I am likely to use some aspect of this project to:
| For Producers | Yes | No | N/A | No Answer |
| Adopt one or more of the practices shown | 90 | 0 | 0 | 10 |
| Increased the operation's diversifications | 70 | 10 | 0 |
20 |
| Reduce my use of purchased off-farm inputs | 40 | 10 | 30 |
20 |
| Increase my networking with other producers | 60 | 10 | 10 |
20 |
| Incorporate value-added into some aspect of my operation | 60 | 10 | 10 |
20 |
A similar workshop was held again at ALBA on September 25, 2014 (power point). There were 15 participants and the seminar was well received.
Table 12. A summary of evaluations for the field day/workshop held at ALBA on 9/25/2014. Numbers are %.
| For Everyone | Yes | No | N/A | No Answer |
| Improved my awareness of the topics covered | 100 | 0 | 0 | 0 |
| Provided new knowledge | 100 | 0 | 0 |
0 |
| Provided new skills | 100 | 0 | 0 |
0 |
| Modified my opinions and/or attitudes | 93 | 0 | 7 |
0 |
How many people do you estimate you will share some aspect of this project within the next 12 months?
| 3 | 4 | 6 | 10 | 12 | 20 | No Answer |
| 7 | 7 | 7 | 21 | 7 | 14 | 36 |
In the next year I am likely to use some aspect of this project to:
| For Producers | Yes | No | N/A | No Answer |
|
Adopt one or more of the practices shown |
93 | 0 | 7 | 0 |
|
Increased the operation's diversifications |
79 | 0 | 7 | 0 |
|
Reduce my use of purchased off-farm inputs |
57 | 7 | 14 | 21 |
|
Increase my networking with other producers |
64 | 14 | 7 | 14 |
|
Incorporate value-added into some aspect of my operation |
71 | 7 | 7 | 14 |
The outcomes of the project was also presented at the Second International Organic Fruit Research Symposium, Leavenworth, WA, June 2012 (abstract, poster), the Eighth International Symposium on Chemical and Non Chemical Soil and Substrate Disinfestation, Torino, Italy, July 2014 (power point, paper) and 2015 Irrigation and Nutrient Management Meeting organized by UC Cooperative Extension, Salinas, CA, February 2015 (power point). Below is the list of published papers and another one including the economic analysis is forthcoming.
Publications:
Zavatta, M., C. Shennan, J. Muramoto, G. Baird, S.T. Koike, M.P. Bolda, and K. Klonsky. 2014. Integrated Rotation Systems for Soilborne Disease, Weed and Fertility Management in Strawberry/Vegetable Production. Acta Horticulturae (ISHS), 1044:269-274.
Shennan, C., J. Muramoto, G. Baird, M. Zavatta, L. Toyama, M. Mazzola, and S.T. Koike. 2016. Anaerobic soil disinfestation (ASD): a strategy for control of soil borne diseases in strawberry production. Acta Horticulturae (ISHS), In review.
Education and Outreach Outcomes
Areas needing additional study
Other studies found that C-sources type affected ASD disease control efficacy and effects of low cost C-sources such as grape pomace, almond hulls, grass hay alone and in combination are being investigated. Further grower adoption of ASD will require improvement in consistency and breadth of disease control, improved N management and increased and water use efficiency. Also, effect of different broccoli species on soilborne disease suppression merits further study.