Final report for LS22-364
Project Information
Demand for organic rice has led to an almost six-fold increase since 1995 in organic rice production in the US. Texas and California are the largest organic rice producing states, accounting for more than 76% of the acreage. Most conventional and organic rice growers in Texas produce a second crop, also known as a ratoon crop, as a result of the relatively low input costs and high profitability. Previous research has led to improvements in main crop organic rice production, but data on how to optimize ratoon crop organic rice nutrient management and assess sustainability are sorely lacking. Developing economically and environmentally sustainable practices is critical to further expansion of organic rice production in the US. We propose to conduct comprehensive field experiments to assess the effects of cultivars, cover crops, and nitrogen rates on ratoon crop rice yields, milling quality, pest pressures, environmental sustainability, and economic viability. On-farm demonstrations with collaborating organic and conventional rice producers will compare economic and environmental metrics achieved using current grower practices with those achieved using recommended best management practices (BMPs) developed through the proposed research. The outcome of this project will improve the economic and environmental sustainability of organic rice production by providing tested and verified BMPs for the southern US. This project addresses two SARE high priority Project Areas ‘Organic Farming Systems’ and ‘Environmentally Sound Practices’.
The overall goal of this proposal is to evaluate effects of cultivars, cover crops and ratoon N fertilizer rates on organic ratoon rice production in the Southern US. Environmental sustainability through integrated life cycle analysis of organic rice ratooning will also help growers to fine tune their best management practices, which will improve the environmental quality. The proposal has four specific objectives
-
- Determine the effects of cultivars, cover crops and ratoon N rates on organic main and ratoon crop rice yields, milling quality, and pest pressures.
- Evaluate environmental sustainability and soil health of organic main and ratoon crop production systems compared to that of conventional rice production.
- Develop best management practices (BMPs) for main and ratoon crop organic rice production systems.
- Disseminate BMPs on the production potential and economic viability through on-farm demonstrations, field day tours and workshops.
Cooperators
Research
Experimental Site:
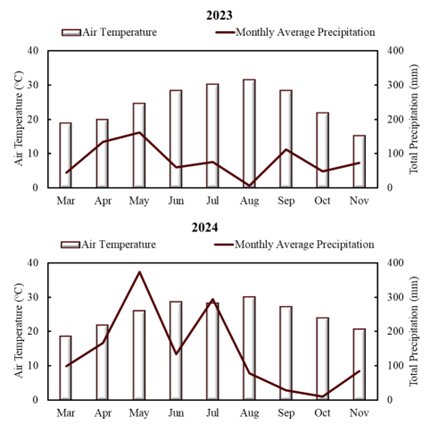
In 2023 and 2024, field experiments were conducted in Beaumont, TX (30.07°N, 94.28°W). The experimental site was characterized by heavy clay soil and high annual average rainfall (> 1,600 mm) suitable for rice cultivation. The monthly mean air temperature and total rainfall during the cropping seasons were presented in Fig. 1. Briefly, monthly mean air temperature ranged from 18.8 to 31.5 °C for 2023 and 18.6 to 30.1 °C for 2024. Total precipitation in 2023 and 2024 was 716 mm and 1267 mm, respectively. The field soil is classified as Morey silt loam (fine-silty, siliceous, superactive, hyperthermic Oxyaquic Argiudolls) and contains an average of 680, 156, and 116 g kg-1 for clay, sand, and silt, respectively. The soil has a pH of 6.7 (1:2 soil/water), an electrical conductivity of 12.63 µS cm-1.
Experimental Design:
The factorial experiment was arranged in a randomized complete block design (RCBD) with four replications. The three main experimental factors are rotation (white clover vs winter fallow as a control), rice cultivar [an inbred, Presidio and a hybrid, XP753 (RiceTec, Inc., Alvin, TX)] and N fertilization rate for ratoon crop (untreated control, 30, 60, 90, 120 kg N ha-1) applied using Nature Safe. Cover crop treatments were applied as main plots with two rice cultivars as subplots. Ratoon N rates were applied as sub-sub-plots.
Cover Crop and Rice Culture:
In the fall of 2022 and 2023, the rice field was prepared through repeated cultivation and laser leveling with pulling the levees and cross levees subsequently to establish four blocks. On October 12th, 2022, white clover (Trifolium repens) seeds were manually spread using a belly spreader at a rate of 7 kg ha-1. The seeds were pre-inoculated with rhizobium strains that were specific to white clover. Despite our efforts, including repeated planting on December 6th, 2022, and January 4th, 2023, the growth and establishment of the cover crop was poor due to the wet and cold winter conditions. To simulate the effects of the cover crop, alfalfa (Medicago sativa) hay was applied to half of each block on March 6th, 2023. The hay was applied at a rate of 7 Mg ha-1 on a matter basis. After the hay application, each block was cultivated several times to either incorporate the hay into the soil or to eliminate the emerging weeds. In 2023, Austrian winter pea (Pisum sativum), was planted by a drill seeder at a rate of 30 kg ha-1 with a 0.76 m row spacing. The cover crop growth in 2023-2024 season was moderate and acceptable to continue rice phase of the experiment without additional hay application. Cover crop was terminated with cultivation on March 3rd, 2024.
Fig 1: Monthly average air temperature (oC) and total precipitation (mm) at the experimental site during the growing season in 2023 and 2024.
Plots were drill-seeded on 31st March and 4th April in 2023 and 2024, respectively. Immediately after seeding, plots were irrigated for 24 h to promote uniform seedling emergence, and then drained to allow oxygen permeation and emergence. After full emergence, the field was reflooded to 8 to 10 cm (to allow 1/3 to 1/2 of the seedling height to remain above the water) and the flood was maintained throughout the growing season for plant growth and weed suppression. Organic N fertilizer (13.0% N, 0% P2O5, 0% K2O; Nature Safe) was manually applied at a rate of 140 kg N ha-1 to each plot at the 4-leaf stage on May 5th and May 21st in 2023 and 2024. Due to the breakdown of machine harvester, plots were hand harvested during July 26-28, 2023. In 2024, main crop was harvested on August 8th. After main crop harvesting, five different rates of N though Nature Safe® organic fertilizer were applied in both years before establishing the permanent flood for ratoon growth. Permanent flood was established on 8th August in 2023 and 21st August in 2024. Ratoon crop N rates were untreated control, 30, 60, 90, 120 kg N ha-1. Ratoon crop was harvested on October 25th in 2023 and 11th November in 2024.
Observations and Measurements:
In this study, several agronomic traits, soil fertility, weed, diseases and insect pressure were assessed, including plant height, grain yield, milling quality, grain nitrogen (N) content, soil nitrogen availability, soil microbial biomass, greenhouse gas emission weed pressure, diseases, and insect incidents.
Plant Height:
Plant height was measured from the ground to the tip of the flag leaf. Measurements were taken for ten randomly selected plants from four inner rows for both the main and ratoon crop.
Grain Yield and Moisture Content:
For rice harvested, grain moisture content was determined using a GAC® 2100 grain analyzer (DICKEY-john Corporation, Auburn, IL). Grain yield (kg ha-1) was adjusted to a storage moisture content of 12%.
Grain Milling Quality:
Rough grain samples (100 grams) were processed using a rice mill (Industrias Machina Zaccaria S/A, São Paulo, Brazil) for 74 seconds to separate hulls and grains, and to distinguish whole milled grains from broken ones. Total grain milling yield (%) was calculated as the weight of whole and broken milled grains divided by the total weight of rough rice, while whole grain milling yield (%) was determined as the weight of whole grains divided by the total weight of whole and broken grains.
Grain Nitrogen Content:
Total grain nitrogen was estimated from 120 mg subsamples using the Dumas complete combustion thermal conductivity method (LECO FP-528, St Joseph, MI, USA) [Horneck and Miller, 1998].
Weed Pressure:
Weed pressure was estimated visually and reported as a percentage of the plot area infected by weed biomass.
Soil Nitrogen Availability:
Surface soil samples (0-25 cm) were collected and extracted with 0.5 K2SO4. The soil extract was used to extractable mineral N using a discreate analyzer (AQ300, Seal Analytical, Inc. Wisconsin) (Li et al., 2012).
Greenhouse gas emission measurements:
In situ static (closed-chamber) flux systems were installed in respective treatments in 2023 and 2024 after establishing permanent flood. Each chamber consisted of a base, an extension, and a lid. Bases were inserted 10 cm into the soil and surrounded by wooden boards and cement blocks to provide stability and access. Before sampling, chambers were assembled and sealed with a rubber gasket to ensure airtight conditions. Gas samples were collected from each chamber between 9:00 and 11:00 AM at 0, 20, 40, and 60 minutes using 30 mL syringes, transferred to 12 mL glass vials, and headspace temperature was recorded at each interval. Samples were then transported to the lab for GHG analysis using Shimadzu GC 2014 equipped with Flame ionization and electron capture detector.
Greenhouse gas (GHG) fluxes were calculated using the ideal gas law, assuming a constant emission rate. Flux (F) was expressed as g CH₄ ha⁻¹ d⁻¹ or kg CO₂ ha⁻¹ d⁻¹, where ρ is gas density (ρCO2 ¼ 1.816 kg m− 3, ρCH4 ¼ 0.714 kg m− 3, and ρN2O¼ 1.964 kg m− 3 at 273 K and 760 mmHg) at standard conditions, V is chamber volume, and Δc/Δt is the change in gas concentration over time. Chamber temperature (T) and atmospheric pressure (P) were used for corrections. Cumulative CO₂, CH₄, and N₂O emissions were determined by integrating daily fluxes, converted from hourly measurements, over the growing period.
Diseases and Insect Incidents:
Narrow brown leaf spot and brown leaf spot infestation were assessed on a scale from 0 to 9, with 0 indicating no effect and 9 indicating maximum impact. Rice water weevil infestation was assessed by counting white heads on a whole-plot basis.
Data Analysis:
The PROC GLM procedure of SAS 9.4 (SAS Institute Inc., Cary, NC) was used for data analysis. Rotation and rice cultivar were considered as categorical variables; nitrogen rates for ratoon crop were considered as a continuous variable; and replication was considered as a random factor. All significant treatment effects were determined using the Differences of Least Squares Means (LSMEANS) at p ≤ 0.05. The CORR procedure was used to calculate Pearson’s Correlation (r) between variables, and p ≤ 0.05 was considered as significant.
Main Crop
Agronomic traits:
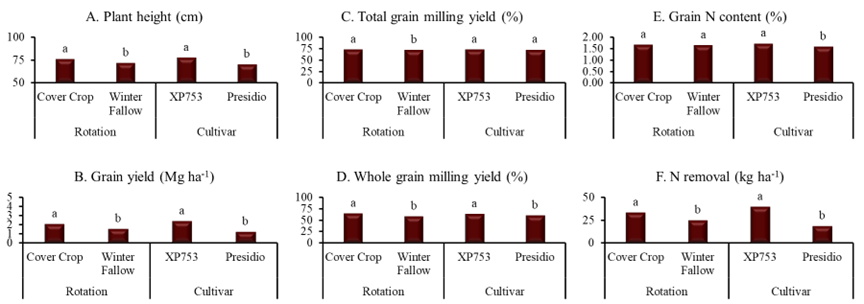
The analysis of variance (ANOVA) for key agronomic traits including plant height, grain yield, total and whole grain milling yield, grain N content, and total N removal, is summarized in Table 1. Results from both 2023 and 2024 revealed that rotation and cultivar significantly affected plant height, grain yield, and total N removal. Cultivar had a strong influence on the milling quality of the main crop in 2023, while in 2024, only whole grain milling yield was significantly influenced by both rotation and cultivar. Grain N content and N removal were consistently affected by rotation across both years, indicating that the inclusion of cover crops or organic residue contributed to enhanced N dynamics in the soil. Cultivar differences also played a notable role in determining total N removal, reflecting variation in nutrient uptake efficiency between hybrid and inbred varieties. Despite these main effects, no significant interaction was observed between rotation and cultivar for any of the measured agronomic traits.
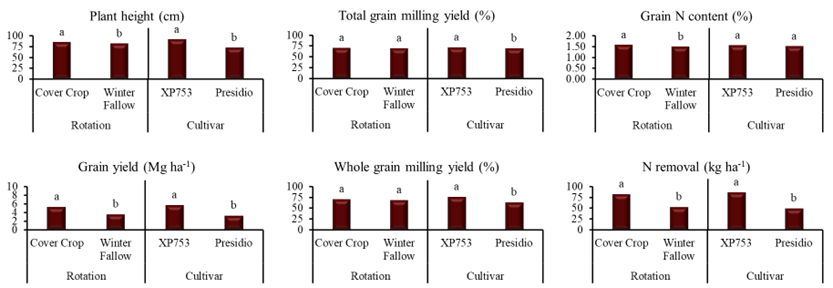
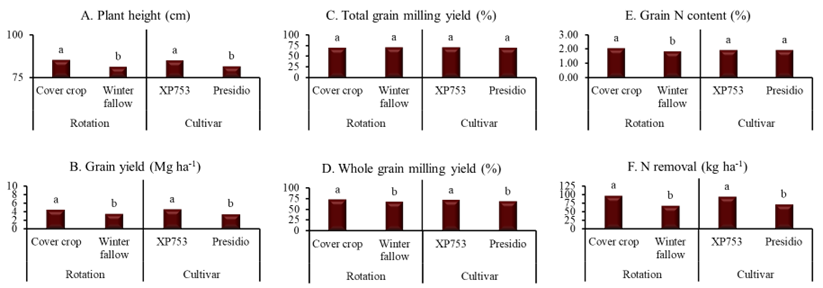
Across both 2023 and 2024, cover cropping and cultivar selection significantly influenced plant growth, yield, and nitrogen dynamics in the organic rice system. In 2023, cover cropping increased plant height by 3.8% and grain yield by an impressive 46%, while in 2024, the corresponding increases were 4.9% and 26% (Fig. 2A–B, 4A–B). The hybrid cultivar XP753 consistently outperformed the inbred Presidio, exhibiting 26% and 4.2% greater plant height and 75% and 32.5% higher grain yield in 2023 and 2024, respectively. In terms of milling quality, XP753 had 3.2% higher total and 20% higher whole grain milling yield in 2023, while in 2024, the hybrid advantage persisted with a 4% improvement in whole grain milling yield (Fig. 2C–D, 4D). Although cultivar differences did not significantly affect grain nitrogen (N) content in either year, cover cropping enhanced grain N concentration by 5% in 2023 and 10% in 2024 (Fig. 2E, 4E). Total N removal, calculated as the product of grain yield and N content, reflected these combined effects. In 2023, cover cropping and XP753 removed 54% and 73% more N than winter fallow and Presidio, respectively, while in 2024, the corresponding increases were 42.3% and 23.7% (Fig. 2F, 4F).
Overall, these results highlight the importance of both cultivar selection and rotation management in optimizing productivity and nitrogen utilization in organic rice systems. The consistent effect of rotation on grain N content and N removal further emphasizes the potential of cover cropping and residue incorporation in improving soil fertility and sustaining long-term crop performance.
Table 1: Results of analysis of variance (ANOVA) for agronomic traits of main crop in 2023 and 2024
|
Source |
DF |
Plant Height |
Grain Yield |
Total grain milling yield |
Whole grain milling yield |
Grain N content |
Total N removal |
|
2023 |
|||||||
|
Rotation (R) |
1 |
0.0230 |
0.0002 |
0.3236 |
0.2896 |
0.0030 |
<0.001 |
|
Cultivar |
1 |
<0.0001 |
<0.0001 |
0.0002 |
<0.001 |
0.1271 |
<0.001 |
|
Rotation*Cultivar |
1 |
0.9190 |
0.2266 |
0.7116 |
0.1441 |
0.1537 |
0.1337 |
|
2024 |
|||||||
|
Rotation (R) |
1 |
0.0163 |
0.0481 |
0.6060 |
0.0158 |
0.0016 |
0.0044 |
|
Cultivar |
1 |
0.0402 |
0.0177 |
0.5407 |
0.1234 |
0.9992 |
0.0233 |
|
Rotation*Cultivar |
1 |
0.9903 |
0.3113 |
0.4835 |
0.2895 |
0.1251 |
0.0785 |
Fig 2. Effect of rotation (Cover crop vs winter fallow) and cultivar (XP753 vs Presidio) on main crop’s plant heigh (A), grain yield (B), total grain milling yield (C), whole grain milling yield (D), grain N content (E) and N removal (F) in 2023. Columns with different letters indicate significant difference at P<0.5 for the mean effect of either rotation or variety.
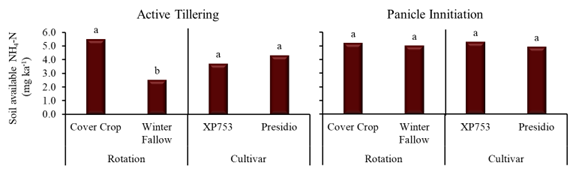
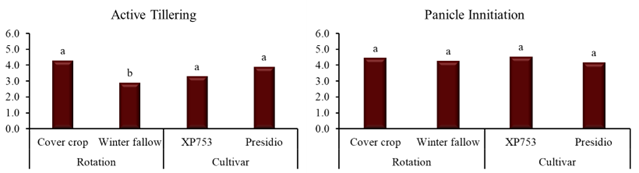
Fig 3. Effect of rotation (Cover crop vs winter fallow) and cultivar (XP753 vs Presidio) soil ammonium nitrogen (NH4-N) during active tillering and panicle initiation stage in 2023. Columns with different letters indicate significant difference at P<0.5 for the mean effect of either rotation or variety.
Fig 4. Effect of rotation (Cover crop vs winter fallow) and cultivar (XP753 vs Presidio) on main crop’s plant heigh (A), grain yield (B), total grain milling yield (C), whole grain milling yield (D), grain N content (E) and N removal (F) in 2024. Columns with different letters indicate significant difference at P<0.5 for the mean effect of either rotation or variety.
Fig 5: Effect of rotation (Cover crop vs winter fallow) and cultivar (XP753 vs Presidio) soil ammonium nitrogen (NH4-N) during active tillering and panicle initiation stage in 2024. Columns with different letters indicate significant difference at P<0.5 for the mean effect of either rotation or variety.
Soil N availability:
Soil N availability was assessed during the active tillering and panicle initiation stages in both 2023 and 2024. In both years, a similar trend was observed—cover cropping increased soil N availability during the early growth stage compared to winter fallow plots. However, this positive effect diminished as the crop advanced to the panicle initiation stage. The lack of a consistent difference in N availability later in the season can be attributed to the blanket application of 145 kg N ha⁻¹ to all plots, irrespective of treatment, using Nature Safe®, which likely masked the influence of the cover crop on soil N dynamics (Fig. 3 and 5). Cultivar differences did not significantly affect soil N availability at either growth stage in either year, suggesting that rotation management played a more prominent role than cultivar selection in regulating soil N dynamics under organic production systems. However, the hybrid cultivar XP753 tended to show slightly lower soil N availability during the early growth stage, likely due to its greater early-season N uptake and vigorous growth compared to the inbred Presidio.
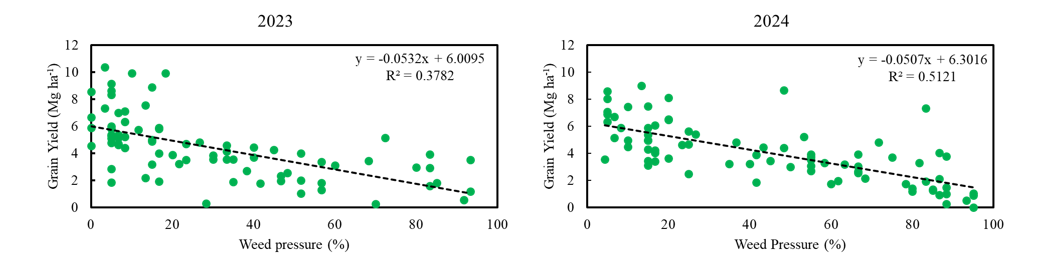
Fig 6. Relationship between weed pressure and rice main crop grain yield in 2023 and 2024.
Weed pressure:
In organic cultivation, effective weed management is crucial, presenting a formidable challenge. This is especially pronounced in organic rice cultivation, where weed control is pivotal for crop success. Weed infestation levels during the main rice crop phase exhibited significant variability, ranging from minimal occurrences to extensive infestations across the plots. Consistent with findings in existing literature, the present study also underscores a notable negative correlation between weed pressure and organic rice main crop grain yield (Fig 6). This correlation highlights the importance of implementing effective weed management strategies to mitigate adverse impacts on crop productivity. By recognizing and addressing the detrimental effects of weed pressure, organic rice farmers can enhance the likelihood of achieving optimal yields and ensuring successful crop outcomes. This emphasizes the critical role that weed management plays in the context of organic rice cultivation.
Greenhouse Gas Emissions:
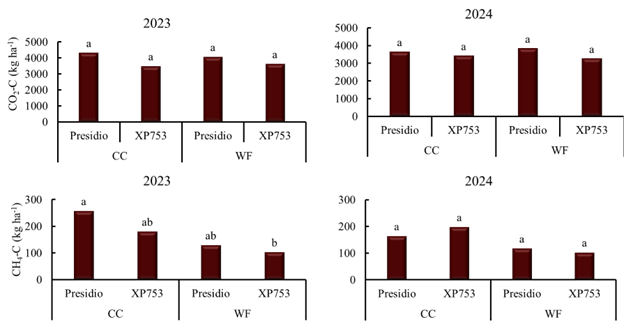
Fig 7. Grwing season emissions of carbon dioxide (CO2) and methane (CH4) for rice main crop in 2023 and 2024. Columns with different letters indicate significant difference at P<0.5 for the interaction effect of rotation and cultivar.
The GHGs emitted from rice production were CO₂ and CH₄, whereas N₂O emissions were negligible. In both growing years, CO₂ emissions were similar across the different rotation and cultivar combinations. CO₂-C emissions ranged from 3,487 to 4,320 kg ha⁻¹ in 2023 and from 3,255 to 3,830 kg ha⁻¹ in 2024, indicating slightly lower emissions in 2024 compared to 2023. In contrast, methane emissions in 2023 differed significantly among rotation–cultivar combinations. The Presidio cultivar under cover cropping produced the highest CH₄ emissions (258 kg ha⁻¹), while XP753 under winter fallow had the lowest (103 kg ha⁻¹). In 2024, however, there were no significant differences among treatments due to high variability within replications, with CH₄ emissions ranging from 198 kg ha⁻¹ for XP753 under cover cropping to 100 kg ha⁻¹ for XP753 under winter fallow.
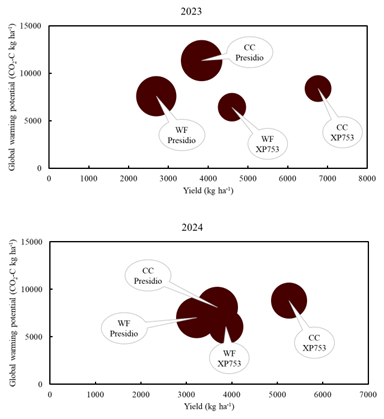
To assess the climate impact of these emissions, growing season GHG emissions were converted to global warming potential (GWP) and global warming intensity (GWI). GWP was calculated by converting methane emissions to CO₂-equivalents and adding them to the CO₂ emissions. GWI was calculated by dividing GWP by the grain yield and expressed as kg CO₂-C per kg of grain. In 2023, the lowest GWI (1.24 kg CO₂-C per kg of grain) was observed for the highest-yielding system—hybrid rice under cover cropping—indicating that this combination is the most climate-friendly compared to inbred rice under winter fallow (Fig 8). A similar trend was observed in 2024, though GWI was slightly higher due to lower grain yields that year (Fig 8). Nevertheless, XP753 under cover cropping consistently showed the lowest GWI, suggesting that this cultivar and management system represents the most climate-friendly option for organic rice production across both years.
Fig 8. Bubble plot reveals the means of global warming potential (GWP) and greenhouse gas intensity (GHGI) of rice main crop in 2023 and 2024. The x-axis represents grain yield, y-axis indicates the GWP level, the size of the bubble is proportional to the GHGI.
Ratoon Crop
Agronomic traits:
The ANOVA results revealed that during the 2023 growing season, rotation had a pronounced effect on several measured traits (Table 2). Rotation significantly influenced plant height, grain yield, total grain milling yield, whole grain milling yield, and total nitrogen removal, with the strongest effects observed for plant height and whole grain milling yield. However, rotation did not significantly affect grain N content (p = 0.6960), suggesting that while crop rotation improved growth and yield performance, it did not alter the N concentration in the harvested grain. Cultivar differences were also highly significant for plant height, grain yield, grain N content, and total N removal, indicating that genetic variability strongly influenced plant performance and nutrient uptake. Although cultivar affected whole grain milling yield, its influence on total grain milling yield was not significant. Nitrogen rate effects were generally modest, with only grain N content and total N removal responding significantly to different N fertilization levels, implying that N primarily influenced grain nutritional quality rather than yield or milling traits. The interaction terms among factors were largely non-significant, showing limited evidence of combined or synergistic effects among rotation, cultivar, and N rate treatments in 2023.
In contrast, during the 2024 growing season, the effects of rotation, cultivar, and N rates displayed somewhat different patterns (Table 2). Rotation continued to significantly affect plant height, grain yield, total grain milling yield, and total N removal, confirming its consistent influence on growth and productivity. Cultivar differences were also evident for grain yield, whole grain milling yield, and total N removal, though not for plant height or total milling yield, indicating that genotypic differences were more pronounced for yield-related and quality traits in 2024. Nitrogen rate effects were significant for grain yield, grain N content, and total N removal (p < 0.0001), suggesting a yield response to N fertilization. Among interactions, the cultivar × rotation term significantly affected grain yield and total N removal. All other interaction terms remained non-significant, suggesting that main effects rather than interactions predominantly governed the response of rice growth, yield, and N dynamics in both seasons.
Table 2: Results of analysis of variance (ANOVA) for agronomic traits of ratoon crop in 2023 and 2024
|
Source |
DF |
Plant Height |
Grain Yield |
Total grain milling yield |
Whole grain milling yield |
Grain N content |
Total N removal |
|
2023 |
|||||||
|
Rotation (R) |
1 |
<0.0001 |
0.0007 |
0.0311 |
<0.0001 |
0.6960 |
0.0007 |
|
Cultivar (C) |
1 |
<0.0001 |
<0.0001 |
0.1113 |
<0.0084 |
0.0003 |
<0.0001 |
|
N Rates (N) |
4 |
0.6466 |
0.0526 |
0.8016 |
0.8939 |
0.0021 |
0.0049 |
|
C * R |
1 |
0.0181 |
0.8572 |
0.4827 |
0.3505 |
0.1751 |
0.6721 |
|
C * N |
4 |
0.6193 |
0.8703 |
0.5095 |
0.9611 |
0.9644 |
0.9200 |
|
R * N |
4 |
0.9673 |
0.7818 |
0.5035 |
0.3584 |
0.8009 |
0.4654 |
|
C * R * N |
4 |
0.8786 |
0.6969 |
0.4587 |
0.5984 |
0.3266 |
0.5602 |
|
2024 |
|||||||
|
Rotation (R) |
1 |
0.0426 |
<0.0001 |
0.0002 |
0.1942 |
0.6441 |
<0.0001 |
|
Cultivar (C) |
1 |
0.9075 |
0.0005 |
0.5707 |
0.0114 |
0.5640 |
0.0003 |
|
N Rates (N) |
4 |
0.3620 |
<0.0001 |
0.6812 |
0.3869 |
<0.0001 |
<0.0001 |
|
C * R |
1 |
0.2128 |
0.0137 |
0.9761 |
0.7972 |
0.8742 |
0.0176 |
|
C * N |
4 |
0.8576 |
0.8696 |
0.2044 |
0.6042 |
0.4181 |
0.8374 |
|
R * N |
4 |
0.5512 |
0.3353 |
0.3378 |
0.8504 |
0.4124 |
0.4250 |
|
C * R * N |
4 |
0.9035 |
0.1606 |
0.4405 |
0.3198 |
0.1742 |
0.1696 |
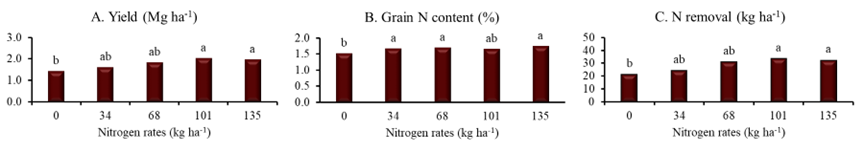
Cover cropping and cultivar significantly influenced plant growth, grain yield, grain milling yield, and N dynamics in both 2023 and 2024, though the magnitude of responses varied between years. In 2023, cover cropping increased plant height by 6.1% and grain yield by 34% (Fig. 9A and 9B), while the hybrid cultivar XP753 showed an 11% increase in height and a striking 97% increase in grain yield compared to the inbred cultivar Presidio. Cover cropping also resulted in a modest 1.0% increase in total grain milling yield. Consequently, XP753 achieved a higher whole grain milling yield (5.5%) than Presidio, and cover cropping increased whole grain milling yield by 11% (Fig. 9C and 9D). Rotation had no significant effect on grain N content; however, XP753 exhibited an 8.4% higher grain N content than Presidio (Fig. 9E). Correspondingly, cover cropping and XP753 removed 34% and 115% more N, respectively, compared to winter fallow or Presidio (Fig. 9F).The response to nitrogen (N) rates in 2023 indicated that increasing N application led to higher ratoon yields, with the peak achieved at 101 kg N ha⁻¹ and 135 kg N ha⁻¹ after stabilizing from 0 to 68 kg N ha⁻¹ (Fig. 10A). The highest yield of 2.0 Mg ha⁻¹ occurred at 101 kg N ha⁻¹, followed closely by 135 kg N ha⁻¹; both were significantly higher than the 0 kg N ha⁻¹ treatment. Grain N content at 101 kg N ha⁻¹ was slightly lower than at other N rates but was statistically similar. Nitrogen removal followed the pattern of grain yield, peaking at 101 kg N ha⁻¹ at 34 kg N ha⁻¹ (Fig. 10B and 10C).
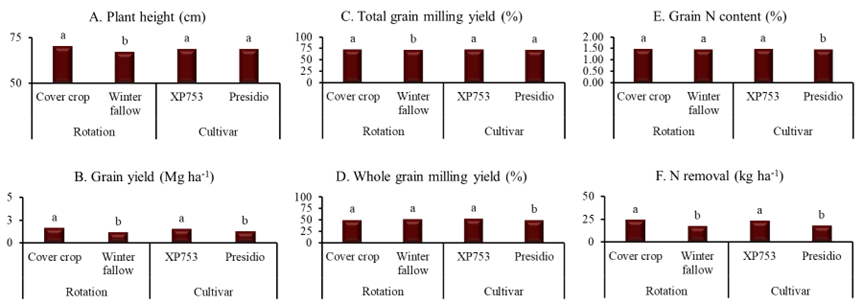
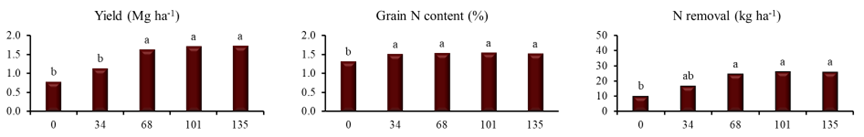
In 2024, cover cropping continued to enhance growth and yield, though the magnitude differed. Plant height increased by 5%, and grain yield rose by 54% with cover cropping (Fig. 11A and 11B). XP753 showed a 25% increase in grain yield compared to Presidio. Total grain milling yield increased slightly by 1.3% under cover cropping, and XP753 exhibited an 8.1% higher whole grain milling yield than Presidio (Fig. 11C and 11D). Unlike 2023, grain N content was not significantly affected by rotation or cultivar (Fig. 11E). Nonetheless, cover cropping and XP753 still achieved greater N removal, with increases of 35.3% and 22.2%, respectively, compared to winter fallow or Presidio (Fig. 11F). Nitrogen rate effects in 2024 mirrored those of the previous year. Ratoon yield increased with higher N application, peaking at 101 kg N ha⁻¹ and 135 kg N ha⁻¹ (Fig. 12A). The highest yield of 1.7 Mg ha⁻¹ occurred at 101 kg N ha⁻¹, followed by 135 kg N ha⁻¹, both significantly exceeding the 0 kg N ha⁻¹ yield. Grain N content was lowest at 0 kg N ha⁻¹, while N removal closely followed the yield trend, peaking at 26 kg N ha⁻¹ for the 101 kg N ha⁻¹ treatment (Fig. 12B and 12C).
Overall, both years demonstrated that cover cropping and the hybrid cultivar XP753 consistently improved plant growth, grain yield, whole grain milling, and N removal, although the absolute gains varied between years. The response to N application was also consistent, with peak performance observed around 90-100 kg N ha⁻¹, highlighting optimal management strategies for organic rice production.
Fig 9. Effect of rotation (Cover crop vs winter fallow) and cultivar (XP753 vs Presidio) on ratoon crop’s plant heigh (A), grain yield (B), total grain milling yield (C), whole grain milling yield (D), grain N content (E) and N removal (F) in 2023. Columns with different letters indicate significant difference at P<0.5 for the mean effect of either rotation or variety.
Fig 10. Effect of nitrogen rates on ratoon crop’s yield, grain N content and N removal in 2023. Columns with different letters indicated significant difference at P<0.05.
Fig 11. Effect of rotation (Cover crop vs winter fallow) and cultivar (XP753 vs Presidio) on ratoon crop’s plant heigh (A), grain yield (B), total grain milling yield (C), whole grain milling yield (D), grain N content (E) and N removal (F) in 2024. Columns with different letters indicate significant difference at P<0.5 for the mean effect of either rotation or variety.
Fig 12. Effect of nitrogen rates on ratoon crop’s yield, grain N content and N removal in 2024. Columns with different letters indicated significant difference at P<0.05.
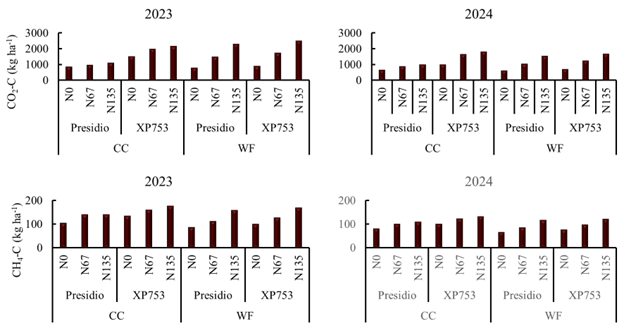
Greenhouse gas emissions:
The GHGs emitted from ratoon rice production were primarily CO₂ and CH₄, whereas N₂O emissions were negligible, similar to the main crop. In both growing years, CO₂ emissions were consistent across rotation, cultivar and N rate combinations, ranging from 878 to 2,312 kg ha⁻¹ in 2023 and from 632 to 1,820 kg ha⁻¹ in 2024, indicating slightly lower emissions in 2024. Methane emissions were generally unaffected by rotation, cultivar, or N application rates due to high variability within replications. The highest CH₄ emission was observed in XP753 under cover cropping with 135 kg N ha⁻¹ (178 kg ha⁻¹), while the lowest occurred in Presidio under winter fallow without N application (86 kg ha⁻¹) in 2023. In 2024 CH₄ emissions ranged between 131 kg ha⁻¹ for XP753 under cover cropping with 135 kg N ha⁻¹ to 66 kg ha⁻¹ for Presidio under winter fallow without N. Overall, there was a general trend in both years indicating that increasing N rates corresponded with higher CO₂ and CH₄ emissions.
Fig 13. Grwing season emissions of carbon dioxide (CO2) and methane (CH4) for rice ratoon crop in 2023 and 2024. Due to large iter replication variation no significant difference was detected.
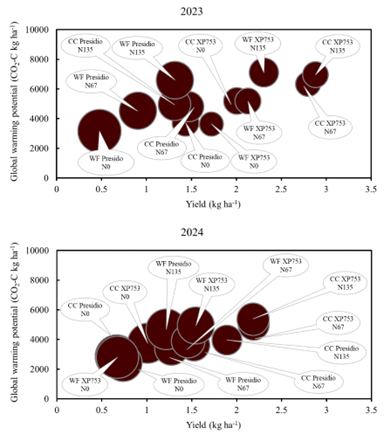
To evaluate the climate impact of ratoon rice production, growing season GHG emissions were converted to GWP and GWI similar to main crop. In 2023, the lowest GWI (2.11 kg CO₂-C per kg of grain) was recorded for XP753 under winter fallow without nitrogen application (Fig. 14). In 2024, the lowest GWI (2.09 kg CO₂-C per kg of grain) was observed for Presidio under cover cropping with 135 kg N ha⁻¹. Conversely, the highest GWI in 2023 (6.64 kg CO₂-C per kg of grain) occurred in Presidio under winter fallow without nitrogen, while in 2024 the highest value (4.30 kg CO₂-C per kg of grain) was observed in Presidio under cover cropping without nitrogen (Fig. 14). Among nitrogen rates, the 67 kg N ha⁻¹ treatment consistently exhibited lower GWI values across both rotation and cultivar combinations compared to other N rates, suggesting that moderate N input may optimize productivity while minimizing the carbon footprint of ratoon rice systems.
Fig 14. Bubble plot reveals the means of global warming potential (GWP) and greenhouse gas intensity (GHGI) of rice ratoon crop in 2023 and 2024. The x-axis represents grain yield, y-axis indicates the GWP level, the size of the bubble is proportional to the GHGI.
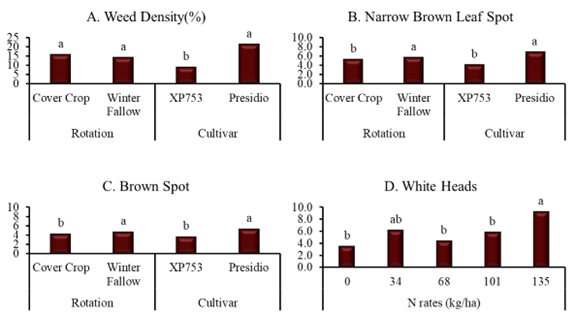
Pest pressure:
In the ratoon crop, cultivar exerted a significant influence on weed density, with the occurrence of Narrow Brown Leaf Spot (NBLS) and Brown Spot (BS) being further impacted by rotation and cover cropping. Additionally, nitrogen (N) rates also played a role in affecting BS incidence. Notably, only N rates showed significance concerning the occurrence of white heads, as depicted in Table 3. Due to its higher tillering ability, the hybrid cultivar XP753 exhibited lower weed density compared to the inbred cultivar Presidio (Fig 7 A). This trait allows XP753 to effectively compete for space, sunlight, and resources with weeds. Furthermore, cover cropping led to an 8.6% reduction in NBLS and an 8.9% reduction in BS. XP753 also demonstrated a notable reduction in NBLS (39%) and BS (30%), as shown in Figures 7 B and C, respectively. Interestingly, the highest N rate of 135 kg ha-1 resulted in the greatest number of white heads (Fig 7 D). These findings underscore the multifaceted interactions between cultivar selection, agronomic practices such as cover cropping and rotation, and nutrient management in influencing weed dynamics and pest incidence in ratoon rice cultivation.
Table 3: Results of analysis of variance (ANOVA) for pest incidence in ratoon crop
|
Source |
DF |
Probabilities |
||
|
|
|
Narrow Brown Leaf Spot |
Brown Spot |
Number of White heads |
|
Rotation (R) |
1 |
0.0107 |
0.0092 |
0.1078 |
|
Cultivar (C) |
1 |
<0.0001 |
<0.0001 |
0.1233 |
|
Nitrogen rate (N) |
4 |
0.0884 |
0.0408 |
<0.0001 |
|
R*C |
1 |
0.1611 |
0.3732 |
0.3887 |
|
R*N |
4 |
0.8607 |
0.3854 |
0.3168 |
|
C*N |
4 |
0.4392 |
0.5695 |
0.0253 |
|
R*C*N |
4 |
0.0943 |
0.3789 |
0.6555 |
Fig 15. Effect of rotation, cultivar and N rates on pest pressure in ratoon rice crop. Columns with different letters indicate significant difference at P<0.5 for the mean effect of either rotation, cultivar or N rate.
Education
This project has received additional funding from the SSARE James Harrison Hill, Sr. Young Scholar Enhancement Grant Program (YES) for the year 2023 and 2024. This funding has been allocated to support the educational component of the project, which aims to investigate the effects of cover crop, genotype, and nitrogen fertilizer on ratoon rice yield in organic rice cultivation. With this funding, we have been able to train two student assistants in organic ratoon rice production systems, providing them with both specific knowledge on this topic and a broader understanding of sustainable agriculture practices in general.
As a result of their training, the student assistants have contributed significantly to the project. Two PowerPoint presentations showcasing their work have been previously submitted to Southern SARE. Additionally, the student assistants presented their findings at the 2024 International Temperate Rice Conference and Rice technical working group meeting in 2025 both held in New Orleans, LA.
This educational initiative not only enhances the research outcomes of the project but also fosters the development of the next generation of professionals in sustainable agriculture.
Educational & Outreach Activities
Participation summary:
Learning Outcomes
Critical for Winter Cover Crop Establishment: Successful cover crop establishment is pivotal for effective weed management during the subsequent rice growing season. Excessive weed presence not only hinders cover crop growth but also interferes with rice production.
Benefits of Cover Crop on Rice Yield and Quality: Implementing a cover crop can offer numerous advantages to rice cultivation. It has the potential to enhance rice yield and improve grain quality by providing additional organic matter to the soil, increasing nutrient availability, and improving soil structure. Additionally, cover crops can help suppress weed growth and reduce the incidence of diseases, further contributing to overall crop health and productivity.
Optimal N Application Rate for Ratoon Rice Yield: Based on the findings of the present research conducted in southeastern Texas, it is being suggested that applying a rate of 90 lbs/ac N through Nature Safe (R) fertilizer could be optimal for achieving the greatest economic yield in ratoon rice cultivation. This carefully calibrated N application rate ensures adequate nutrient supply for crop growth while minimizing environmental impacts and production costs.
Project Outcomes
This project has been approved to receive additional funding from the SSARE James Harrison Hill, Sr. Young Scholar Enhancement Grant Program (YES) for the year 2023.