Final report for GW19-199
Project Information
Agricultural ecosystems comprise roughly half of the global land surface and are faced with competing tasks of feeding a growing population and conserving global biodiversity. While agriculture has been widely critiqued as a primary driver of habitat fragmentation and biodiversity loss, recent studies have found positive relationships between habitat heterogeneity and biodiversity in agricultural landscapes. Thus, on-farm conservation practices that enhance habitat heterogeneity have the potential to increase biodiversity while having neutral or positive effects on crop production. To test this idea, ecological refugia (defined as uncultivated patches in production fields) were identified on three farms and assessed for their capacity to support biodiversity, enhance ecosystem services, and increase crop yield and crop quality. The research approach included plant surveys, insect collection, seed predation experimentation and grain sampling on each farm. In addition, precision agriculture and remote sensing data were obtained from combine-mounted yield sensors and Google Earth Engine. For data analysis, linear and nonlinear regression were used to analyze plant diversity, insect diversity, seed predation, crop quantity and crop quality as a function of distance from the center of each ecological refuge. Results from fields with ecological refugia were compared to those without refugia to test for a significant difference between field types. Lastly, a random forest model was built using field survey data and remote sensing variables to clarify what explanatory variables were driving responses in crop yield and crop quality.
Crop fields that had ecological refugia tended to support higher plant diversity than fields without refugia. Furthermore, crop fields with refugia hosted higher levels of native plant diversity than nonnative diversity. On Farms 1 and 2, plant diversity declined significantly with distance from naturally occurring refugia into the crop field. On Farm 3, plant diversity declined significantly with distance from a recently restored refuge by the third year of data collection. On all farms, insect diversity declined significantly with distance from refugia. A higher abundance of beneficial insects was found in crop fields with naturally occurring refugia, while a higher abundance of pest insects was found in the crop field with a newly created refuge and in control fields without refugia. Seed trap data indicated that beneficial weed seed predation services were higher on organic farms while crop seed predation disservices were higher on a conventionally managed farm. Divergent trends for crop yield indicated that yield declined significantly with distance from a naturally occurring refugia on Farm 2 while crop yield increased with distance from a created refuge on Farm 3. A variable importance plot indicated that distance from refuge was the most importance predictor of yield and raised the R-squared value of the yield model from 0.57 to 0.70. Lastly, grain protein concentration had an inverse relationship with grain moisture content and grain phenolic compounds tended to increase with distance from the refuge, suggesting that crops growing near an ecological refuge may be less stressed than plants growing far from one.
These results highlighted potential tradeoffs of implementing ecological refugia in agroecosystems and demonstrated how habitat heterogeneity impacts crop yield and biodiversity whether heterogeneity is created intentionally or occurs naturally. Encouraging adoption of ecological refugia as an on-farm conservation practice will depend on site-specific evidence that refugia can maintain or increase crop yields, decrease farm inputs, increase beneficial biodiversity, enhance ecosystem services, and increase farm net return. To do so, future research must empirically test the relationship between on-farm biodiversity and habitat fragments at multiple scales, clarify the association between functional groups and ecosystem services, and apply on-farm technology to collect site-specific data that guides on-farm experimentation. One participating farmer planted pollinator strips in an additional field on their farm in attempt to maximize beneficial ecosystem services associated with habitat heterogeneity. Other applications of on-farm habitat conservation planning could enable farmers to identify low-producing areas in their fields and strategically remove them from production, potentially resulting in reduced input costs and enhanced conservation habitat in agricultural landscapes.
The project objectives were to quantify the biodiversity, agronomic, and economic impacts of habitat heterogeneity in dryland small grain production in the Northern Great Plains. Specifically, we quantified the effects of ecological refugia on biodiversity, ecosystem services and crop production on three farms in Montana.
- First, we aimed to quantify the biodiversity trends associated with ecological refugia on farms. To do so, we measured and compared differences in plant diversity, insect diversity, and insect functional groups between fields with and without ecological refugia. We also quantified how biodiversity trends changed with distance from each refuge.
- Second, we aimed to determine what ecosystem (dis)services were provided by ecologial refugia. To do so, we measured seed predation rates for crop and weed species in fields with and without ecological refugia and analyzed how seed predation changed with distance from each refuge.
- Third, we aimed to quantify the costs and benefits that ecological refugia brought to crop production. To do so, we compared differences in crop yield and crop quality between fields with and without ecological refugia and analyzed how crop yield changed with distance from each ecological refuge.
- Fourth, we aimed to share findings on ecological refugia and biodiverse farming practices with farmers, undergraduate students and the general public through participation in academic conferences, farmer-led workshops, university courses, public seminars and online formats.
Objective 1: Crop Quality and Yield Maps
Previous precision agriculture data from our 3 producers will be researched in spring 2019. Yield and profit maps will be generated in the spring for all 6 fields from 2019-2021. Results and field prescriptions will be presented at the PARA meeting in November. Grain samples will be collected in summer 2019 and 2020 and sent for trace element analysis at the UC Davis Lab. All crop quality and profit maps of will be analyzed, shared with participating producers and submitted for publication by spring 2021.
Objective 2: Biodiversity Surveys
Biodiversity monitoring methods will be researched and prepared in spring 2019. Field surveys of pollinators, mammals, vegetation, and insects will be conducted across 6 fields in summer and fall 2019-2021. Data analysis will be ongoing following summer 2019. Results will be shared continuously with participating producers and presented to PARA members at the November meeting in 2019 and 2020. Results will be submitted for publication by spring 2021.
Objective 3: Producer Adoption
Preliminary surveys of PARA producers’ willingness to adopt wildlife friendly farming techniques will be prepared and conducted in spring 2019 and 2020. Post surveys of producer willingness to adopt wildlife friendly farming techniques will be conducted in winter 2021. Amoeba diagrams of producer perceptions of on-farm biodiversity and ecosystem services will be prepared and completed in spring 2019 and 2020. Ongoing evaluations of producer satisfaction, adoption of agroecological methods and mastery of precision agriculture technology will be designed and completed by Pheasants Forever-associated producers in the spring of 2019 and 2020. Data analysis will be ongoing following the first spring of surveys. Results will be shared during farmer field tours July 2019-2020 and annual PARA meeting November 2019-2020, with journal submissions spring 2021.
Cooperators
- - Producer (Researcher)
- - Producer (Researcher)
- - Producer (Researcher)
Research
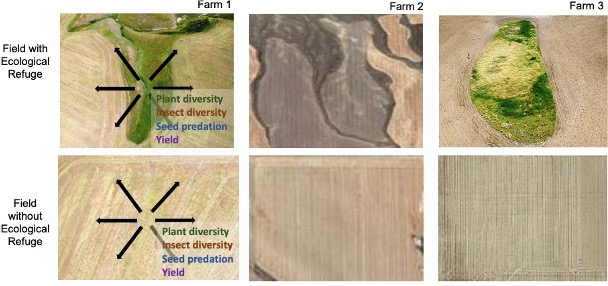
This study evaluated the potential for implementing ecological refugia as a viable habitat conservation strategy and farm management practice. To do so, three fields with an ecological refuge and three fields without an ecological refuge were selected from three farms across Montana for a total of six study sites. The selected ecological refugia varied in location, acreage, management type, and whether they were naturally occurring or intentionally created (Table 1). Farm 1 included a naturally occurring ecological refuge of 2 acres within a 73-acre crop field. Farm 2 had a naturally occurring ecological refuge of 28 acres within a 156-acre crop field. Farm 3 had a recently created ecological refuge of only 0.5 acres within a 241-acre crop field. Field surveys, precision agriculture data and remote sensing data were used to compare biodiversity trends, ecosystem services, crop yield and crop quality between homogeneous fields (control fields without ecological refugia) and heterogeneous fields (fields with ecological refugia).
|
Table 1: Farm and Ecological Refuge Size and Type |
Farm 1 |
Farm 2 |
Farm 3 |
|
Crop Field Area (acres) |
73 |
156 |
241 |
|
Refuge Area (acres) |
2 |
28 |
0.5 |
|
Refuge Type |
Naturally occurring |
Naturally occurring |
Created |
|
Management Type |
Organic |
Conventional |
Organic |
Table 1. Crop field and refuge size vary in acreage, years since establishment and management type.
The USDA National Agricultural Statistics Service Cropland Data Layer (USDA Cropscape, 2021) was used to classify functional land cover types and characterize land cover type heterogeneity at the landscape scale. Cropland cover types included barley, spring wheat, winter wheat, alfalfa, non-alfalfa hay, sugar beets, potatoes, chick peas, lentils, and peas. Non-crop cover types in 2021 included fallow/idle cropland, open water, developed space (low, medium and high intensity), barren land, evergreen forest, shrubland, grass/pasture, woody wetlands, and herbaceous wetlands. Concentric rings of 1, 2, 5, 10, 15, 20, 25, 30, 35, 40, 45, 50, 60, 70, 80, 90 and 100-kilometer radii were created around each ecological refuge using the buffer tool in QGIS. Then, landcover type richness and diversity were calculated within each buffer using the vegan: Community Ecology Package in RStudio (Version 1.1.453 – © 2009-2018 RStudio, Inc.). Land cover type richness was calculated using the species richness function and landcover type diversity was calculated using Shannon’s index. Each land cover type was regarded as a species type while pixel abundance was used as a measurement of species abundance.
Methods for Objective 1: Quantifying Biodiversity
First, plant and insect surveys were conducted on 100-meter transects in a radial design in all six fields (Figure 1). Six 100-meter transects were established in a radial design from the center of each refuge and extended out to the cropped area. In the case that a transect was still within the refuge at the 70-meter mark, the transect was extended to 140 meters to include balanced samples of the crop field. In fields without a refuge, the center of the transect was placed randomly in the field at least 150 meters from any field boundary to avoid edge effects.
Vegetation monitoring plots were used to compare plant diversity between homogeneous and heterogeneous fields. Vegetation data was also used to analyze plant diversity as a function of distance from the refuge in heterogeneous fields. To assess plant diversity, one quarter-meter squared sampling frames were placed at ten-meter increments along each transect for a total of sixty plant sampling frames per field. Occurrence of all grasses, forbs and shrubs were recorded at all frames during July of 2020-2022. In addition to recording plant species presence, ocular percent cover estimates were used to quantify plant abundance within each frame. For example, rather than counting individual plants as a measure of local abundance, two researchers estimated the percent cover, or area, of each plant species in the sampling ring and average their two estimates. For plant diversity analysis, species richness was defined as the total number of plant species encountered in a sampling frame or in a field type. Plant diversity was calculated using Shannon's Diversity Index. Both measures were assessed using the vegan: Community Ecology Package in RStudio (Version 1.1.453 – © 2009-2018 RStudio, Inc.).
Next, sweep nets were used to collect insects in twenty-meter increments along each transect during July of 2020-2022. One sweep consisted of one step taken as the net was swept in a 180-degree arc, as low as possible to the vegetation, with a total of 100 sweeps per 100-meter transect. All collected insect specimens were then bagged by 20-meter increment groups, stored in dry ice, moved to freezers in the lab and weighed and identified in the following months. In July of 2021, pitfall traps were placed along the same twenty-meter segments of the transects to assess ground-dwelling beetle diversity and abundance. A pitfall trap was set by burying a plastic cup flush to the ground, filling it with soapy water, and leaving it in the field for twenty-four hours before collecting specimen. Insects were collected in four-ounce plastic specimen cups, stored in the freezer, and then counted, weighed and identified in the following months. For analysis, species richness was defined as the total number of insect species collected in twenty-meter segments or per field type. Insect diversity was calculated with Shannon's Diversity Index. Both measures were assessed using the vegan: Community Ecology Package in RStudio ((Version 1.1.453 – © 2009-2018 RStudio, Inc.). In addition, insect samples were classified by insect orders of Araneae, Diptera, Coleoptera, Hemiptera, Hymenoptera, Odonata, Orthoptera and Lepidoptera. Then, insects within each order were grouped into general categories of beneficial insects or pest insects based on associated ecosystem services such as weed seed predation and pest control, or disservices such as crop damage and yield reduction. First, insect abundance data was categorized by insect order and then associated with beneficial insect services or pest insect disservices. For example, native bees and hoverflies in the orders Hymenoptera and Diptera were associated with the beneficial service of pollination. Native wasps, dragonflies, and spiders in the orders Hymenoptera, Odanata and Araneae were associated with the beneficial service of pest predation. Beetles in the order Coleoptera were associated with the service of weed seed predation. Aphids and grasshoppers in the orders Hemiptera and Orthoptera were associated with the disservices of crop damage and yield reduction A pairwise comparison of insect abundance in each order by field type was used to compare whether fields with refugia hosted higher beneficial insect or pest insect abundance than control fields.
Methods for Objective 2: Assessing Ecosystem Services
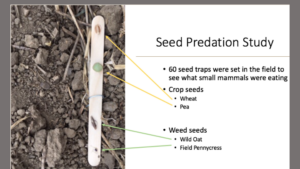
Seed predation experiments were conducted to compare ecosystem services and disservices associated with ecological refugia and agrobiodiversity. Seed traps were used to assess seed predation services provided by small mammals, birds or invertebrates in all six fields. Five seed traps were placed in each field at twenty-meter intervals along the six transects, for a total of thirty seed traps per field. Each seed trap consisted of a wooden popsicle stick with two weed seeds and two crop seeds securely glued to it with a nontoxic glue. Crop seeds were common wheat (Triticum aestivum) and Arvika green pea (Pisum sativum). Weed seeds were field pennycress (Thlaspi arvense) with wild oat (Avena fatua) in 2021, and with kochia (Kochia scoparia) in 2022. To test seed selection preference, each seed trap was anchored in the soil with wire and left in the field for two weeks before collection and analysis. Seed predation outcomes were assessed by counting the number of seeds eaten from each trap. Predation patterns were assessed by examining the proportion of weed predation to crop predation in fields with and without ecological refugia. Crop and weed seed predation were also analyzed as a function of distance from the refuge in heterogeneous fields. An increasing trend in crop seed predation with distance from the refuge was interpreted as a beneficial service provided by the refuge, as less crop seed predation and crop damage occurred near the refuge, perhaps because pest predators near the refuge preyed on crop-eating insects. A decrease in weed seed predation with distance from refuge was interpreted as a beneficial service provided by the refuge, as more insect species preyed on weed seeds near the refuge and reduced the weed seed bank on the farm. A decreasing trend in overall seed predation with distance from the refuge could be interpreted as evidence of more seed predator activity in and near the ecological refuge. Alternatively, a decreasing trend in overall seed predation with distance from the refuge could be interpreted as lack of seed trap predation in the refuge due to an abundance of food sources there, while higher seed trap predation in the crop field was due to a scarcity of food sources available there. Thus, overall seed predation trends were evaluated in consideration of refuge type and farm management style.
Methods for Objective 3: Quantifying Effects on Crop Production
All three participating farmers had access to precision agriculture technology in the form of combine-mounted yield monitors. These monitors produced yield maps of each field during harvest. Additionally, one of the farmers had a combine-mounted protein monitor which collected grain protein content during harvest. These data were used to analyze yield and protein as a function of distance from each ecological refugia and clarify the spatial effects of habitat heterogeneity on crop production. Unfortunately, yield data was not consistently obtained from each participating farmer over the project duration due to challenges such as crop failure from drought or hailstorms, malfunction of yield monitors, or rotation of study field into a fallow year or plow down cover crop. However, using the data that was available, linear regression was used to quantify how crop yield changed with distance from refuge. First, data from the yield monitor was split into 20-meter buffer zones surrounding the refuge using the QGIS buffer tool. Then, the linear regression was defined as:
Yield ~ f {Distance from Refuge}
As Farm 2 was managed conventionally, a logistic function was used to account for the nonlinear relationship between yield and nitrogen rate applied.
The logistic curve function was calculated as:
alpha + ((beta-alpha)/(1+exp(-gamma*(N-delta)))^(1/v))
where alpha was defined as yield with no nitrogen effect, beta was the maximum fertilizer effect, gamma was the fertilizer efficiency, delta was the inflection point on the x-axis, v was the inflection point on the y-axis, and N was the applied nitrogen rate in pounds per acre.
The logistic function was used to derive a nonlinear characterization of yield as:
Yield ~ f{Nitrogen Rate + Distance from Refuge}
Next, a random forest model was built using yield data and remote sensing variables such as topography, normalized difference vegetation index (NDVI), precipitation, and soil characteristics. The QGIS distance matrix tool was used to calculate the distance between the refuge edge and every point in the crop field, thus creating distance from refuge as an explanatory variable in raster form. Yield response was characterized in a random forest model as:
Yield ~ f {Elevation + Slope + Aspect + East Aspect + North Aspect + Topographic Position Index + NDVI + Average Daily Minimum Temperature + Average Daily Maximum Temperature + Soil Percent Clay + Soil Organic Carbon + Mean Annual Precipitation 2019-2020 + Distance from Refuge}
Next, a variable importance plot was used to rank all explanatory variables by their relative importance in explaining crop yield. Relative importance was quantified by calculating the mean decrease in accuracy the model would undergo if a particular variable was removed from the model. R-squared values indicated the proportion of observed variability in yield that the model was able to explain. A multiple linear regression was also used to characterize the relationship between each variable and yield response as significantly positive or negative. Variable inflation factor and model residuals were checked to ensure that the model did not violate any assumptions of normality or independence. AIC selection criterion was used to select the model of best fit. Yield response by multiple linear regression was characterized as:
Yield ~ f {Elevation + Topographic Position Index + East Aspect + NDVI + Average Daily Minimum Temperature + Soil Percent Clay + Soil Organic Carbon + Distance from Refuge}
Lastly, to assess crop quality as a function of distance from refuge, six grain samples were taken at twenty-meter intervals along one transect from each field for a total of 36 grain samples in the summer of 2021. These results were used to assess crop quality as a function of distance from the refuge in a linear regression as well as a pairwise comparison of crop nutrients by field type. However, hail and pest damage reduced the number of viable samples for grain analysis. Thus, an additional 60 grain samples were added to the analysis from WSARE project GW19-190. These 60 samples were taken at randomly assigned locations in the field with a refuge on Farm 1. All grain samples were tested at Montana State University's Barley, Malt & Brewing Lab for moisture, protein, iron and total plant phenols. Plant iron samples followed a protocol dilution of 2.0g flour per 16 mL double-distilled water. Plant polyphenol samples followed a protocol dilution of 0.8g flour per 40 mL double-distilled water. Kriging interpolation was used to interpolate grain protein, iron, and polyphenol content across the field using QGIS. These results were then used to assess crop quality as a function of distance from the refuge using a linear regression.
Overall, significant differences in plant species richness and diversity, insect diversity and abundance, seed predation rates, crop yield and crop quality between homogeneous and heterogeneous fields were analyzed to assess the role of ecological refugia in supporting biodiversity, ecosystem (dis)services and economic (dis)advantages to producers.
Methods for Objective 4: Producer Involvement and Public Outreach
While COVID-19 reduced the number of opportunities to conduct interviews with farmers in person, a long form interview was conducted with Paul and Gary Broyles about their experience with on-farm experimentation and their decision-making process. In addition, results on ecological refugia as a potential on-farm conservation practice were shared at the Montana Organics Association (MOA), Precision Agriculture Research Association (PARA), Alternative Energy and Resources Organization (AERO), Ecological Society of America (ESA), Data Intensive Farm Management (DIFM) and International Society of Precision Agriculture (ISPA) conferences in 2020-2022. These results were received with enthusiasm by farmers especially at farmer-led meetings such as MOA, AERO and PARA. Results of this project were also shared at Montana State University's first Precision Agriculture Bootcamp with a group of undergraduate students. Furthermore, themes of this work were incorporated into a science communication project as part of National Science Foundation's (NSF) STEM Storytelling Fellowship program in 2021. The fellowship focused on communicating science to the public and was presented as part of Montana State University's Honor Presents Lecture Series and the NSF STEM Storytelling event "Good Science, Great Stories" in spring of 2021. Lastly, results of this project were incorporated into a course entitled Food System Resilience (course number SFBS 466) as part of Montana State University's Sustainable Food and Bioenergy Program. The students were highly interested in the results and produced final projects that incorporated on-farm habitat management in their vision of future sustainable food systems.
First, landscape heterogeneity analysis indicated that Farms 1 and 3 had higher land cover type richness and diversity than Farm 2 at all spatial scales ranging from one to 100-kilometer radii (Figure 1). A shortened subset of values ranging from one to 20-kilometer buffer zones are pictured in Figure 1.
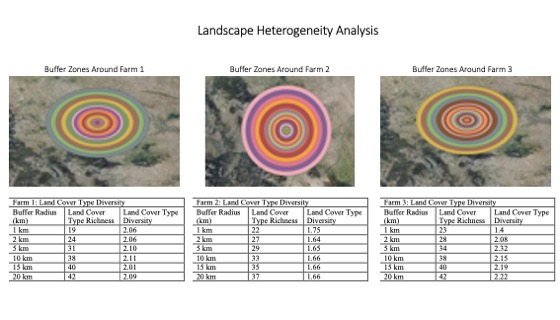
For more detail see the image Landscape Heterogeneity Surrounding Each Farm attached.
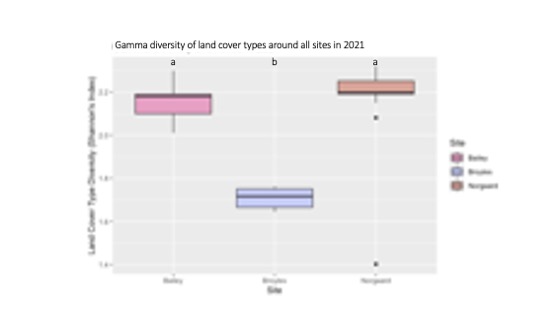
Farms 1 and 3 were surrounded by higher landscape heterogeneity than Farm 2, as indicated by their higher levels of land cover type diversity, while Farm 2 existed in a more homogenous landscape matrix, as indicated by its lower level of land cover type diversity (Figure 2). Land cover type heterogeneity at the landscape scale likely plays a crucial role in supporting biodiversity within ecological refugia through source-sink dynamics. The dynamics between landscape-scale heterogeneity and patch-level biodiversity will be discussed in more depth in future work.
For more details see the image Gamma Diversity of Land Cover Types attached.
Second, observations from vegetative surveys indicated that crop fields with an ecological refuge typically hosted higher plant diversity than fields without a refuge, though diversity trends varied by growing season conditions, farm management type and refuge size. In 2020, observations from Farm 1 and 2 indicated significantly higher plant diversity in the field with a refuge than in the control field (p-value < 0.0001) (Figure 3). In 2021, Farm 1 indicated no significant difference in plant diversity between field types (p-value = 0.11) while Farm 2 indicated significantly higher plant diversity in the field with a refuge (p-value < 0.0001) (Figure 3). In 2022, Farm 1 and 2 indicated significantly higher plant diversity in the heterogeneous field than the homogeneous field (p-value < 0.0001) (Figure 3). The lack of difference between the control and refuge field in 2021 on Farm 1 may have been the severe drought that that summer which resulted in early plant maturation, early senescence, low survival and difficulty identifying plant species in July. As for Farm 3, observations from 2020 indicated significantly lower plant diversity in the field with a refuge than in the control field (p-value = 0.01) (Figure 3). However, in 2021 and 2022, Farm 3 indicated no significant difference in plant diversity between control and refuge field types (p-value = 0.26 and p-value = 0.74) (Figure 3). The lack of diversity in the field with a refuge on Farm 3 may be explained by the small size and recent creation of the refuge. Furthermore, the lack of difference in plant diversity between control and refuge field types on Farm 1 and 3 may have been exacerbated by organic management practices, which tend to facilitate higher plant diversity within crop fields due to the prevalence of volunteers and weedy species, thus reducing any stark differences between field types. Farm management practices and their effect on plant diversity will be discussed in greater detail in the following sections.
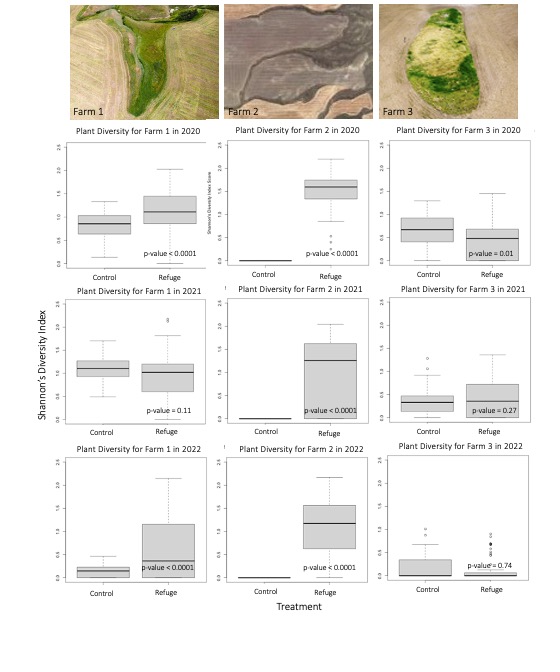
For more detail see the image Plant Diversity Boxplots attached.
Alpha diversity is a common measure of local diversity within a sampling site. Plant alpha diversity was significantly lower on Farm 3 than the other farms over a three-year sampling period (Figure 4). Plant alpha diversity was significantly higher on Farm 2 than the other farms in 2020 and 2022. The fact that Farm 2 had the highest plant diversity, and the largest ecological refuge suggests evidence of the species-area relationship, where larger sampling areas result in higher amounts of species sampled. The consistent trend of lower plant diversity on Farm 3 may have occurred because the ecological refuge on Farm 3 was much smaller and more recently established than the other two refugia, resulting in lower species diversity due to the smaller sampling area and lower level of ecosystem complexity.
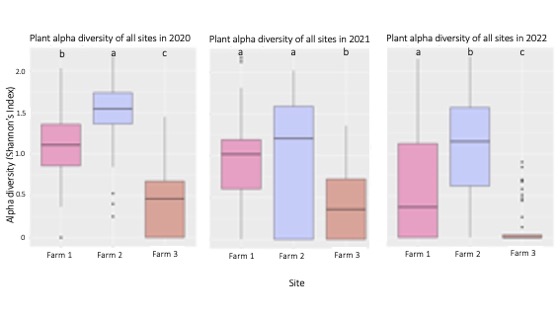
For more detail see the image Plant Alpha Diversity attached.
As general proof of concept that small patch refugia can host biodiversity, a Bayesian Kriging interpolation of sampled plant species indicated that plant species richness was likely to be higher in the refuge than in the crop field for Farm 1 (Figure 5A). With higher plant species richness in and around the ecological refuge, we would expect accompanying ecosystem services such as pollination or pest predation to also occur around the refuge. However, not all biodiversity is beneficial. To decipher between desirable and undesirable on-farm biodiversity, plant diversity was separated into native and nonnative diversity for analysis. A Bayesian Kriging interpolation indicated that native species are likely to have higher species richness in the refuge while nonnative species are likely to have higher species richness in the crop field (Figure 5B and 5C). This suggests that ecological refugia are beneficial sources of native plant diversity and not detrimental sources of weeds in crop fields.
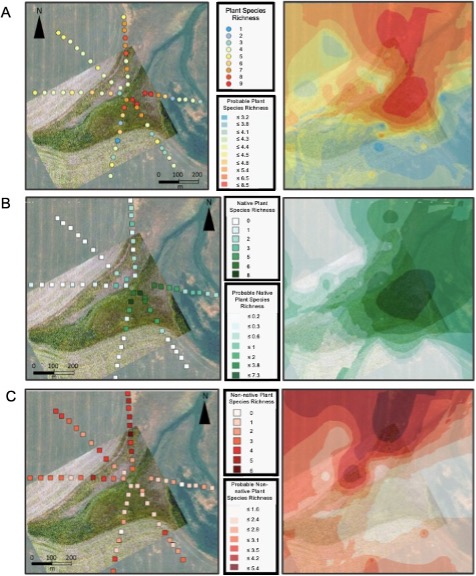
For more detail see the image Plant Species Richness Kriging Interpolation attached.
Next, linear regression of plant diversity by distance from refuge demonstrated that plant diversity was highest within refugia and carried into the surrounding crop field. Plant diversity declined significantly with distance from refugia on Farm 1 (p-value = 0.13, p-value = 0.07, p-value <0.0001) and Farm 2 (p-value = 0.01, p-value < 0.0001, p-value < 0.0001 ) in all years, and did not drop off abruptly at the crop field boundary (Figure 6). However, plant diversity on Farm 3 increased significantly with distance from the refuge in 2020 (p-value = 0.01), decreased insignificantly in 2021 (p-value = 0.87) and decreased significantly in 2022 (p-value = 0.04) (Figure 6). The nonconforming diversity trends for Farm 3 emphasize the important role of ecosystem structure in supporting ecosystem function for refugia, as this refuge is by far the youngest, least established, and least diverse of the three refugia. The three-year trend of increasing plant diversity on Farm 3 indicate that the refuge may increase in plant diversity as it continues to establish. The refuge on Farm 3 was a bare patch of unproductive land that is still in the process of being restored. Thus, the trend in plant diversity should continue declining with distance from refuge as diversity within the refuge is established and enhanced with native plantings. In contrast, Farm 2 consistently demonstrated dramatic differences in plant diversity between fields with and without an ecological refuge. The contrast may be due to the fact that Farm 2 is conventionally managed, meaning that weedy species are managed, and overall plant diversity is reduced within the crop field. The field with a refuge on Farm 1 is organically managed and has the highest overall plant diversity. However, while both Farms 1 and 3 are managed organically, they display different plant diversity trends due to differences in their ecological refugia. The size and age of refugia tend to overpower the farm management style, as the larger and more established refuge on Farm 1 hosted significantly more biodiversity than the organic crop field, while the smaller, younger refuge on Farm 3 only hosted higher plant diversity than the crop field after three years of restoration. This indicates that regardless of organic or conventional farm management practices, ecological refugia may become increasingly beneficial to farmers over time as they undergo restoration and establishment.
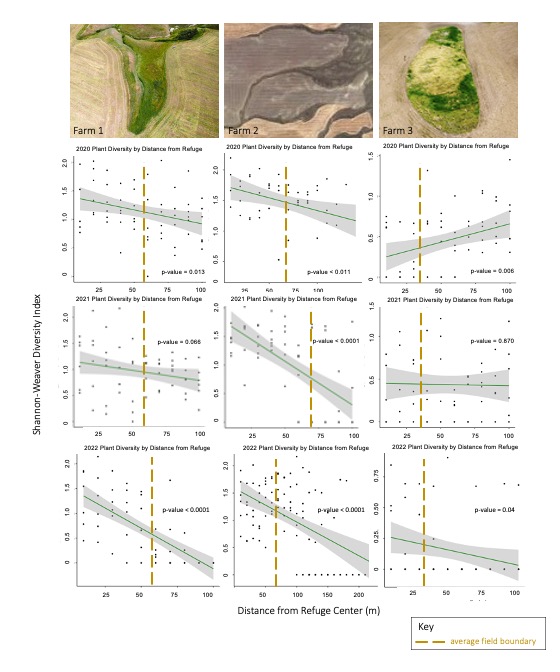
For more detail see the image Plant Diversity Trends attached.
Third, insect sweep net samples indicated that winged insect diversity declined significantly with distance from refuge for all refugia in all years sampled (p-value < 0.0005) (Figure 7). These results suggest a decline in ecosystem complexity and insect habitat with distance from the refuge and into the more homogeneous crop field.
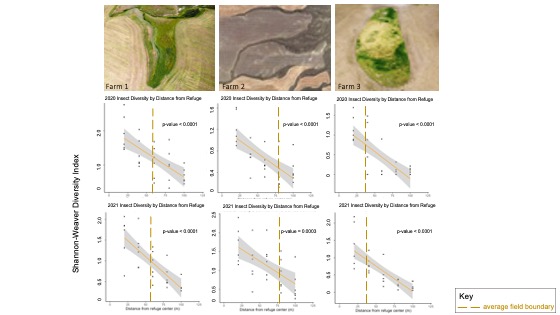
For more detail see the image Insect Sweep Net Diversity Trends attached.
In addition, pitfall samples indicated that ground-dwelling insect diversity declined significantly with distance from refuge for all farms (p-value < 0.001) (Figure 8). Declines in ground-dwelling insect diversity may be accompanied by a reduction of beetle-mediated services such as weed seed predation, soil bioturbation and nutrient cycling.
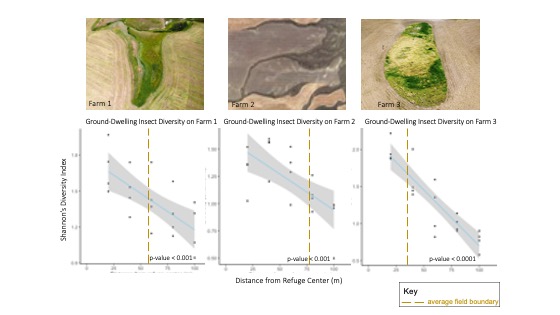
For more detail see the image Pitfall Trap Diversity attached.
However, as stated previously, not all biodiversity is beneficial to crop production. Further insect analysis was conducted to distinguish between beneficial insect and pest insect services associated with ecological refugia. A pairwise comparison indicated that the field with a refuge on Farm 1 had a significantly higher abundance of insects from the orders Hymenoptera, Araneae and Odonata which were associated with the beneficial ecosystem service of pollination and pest predation (p-value < 0.05) (Figure 9A). On Farm 2, the field with a refuge had a higher abundance of insects from the orders Diptera and Hymenoptera, which were associated with beneficial ecosystem services such as pollination and pest predation (p-value < 0.001). In addition, the field without a refuge on Farm 2 had a significantly higher abundance of pest insects from the orders Orthoptera and Hemiptera, which were associated with the disservice of yield reduction (p-value < 0.05) (Figure 9B). The field with a refuge on Farm 3 had a significantly higher abundance of insects from the order Coleoptera, which were associated with beneficial ecosystem services such as weed seed predation and nutrient cycling. However, the same field had a significantly higher abundance of insects from the orders Orthoptera and Hemiptera, which were associated with yield-reducing pest insects like grasshoppers and aphids (Figure 9C). Once again, these results highlight the mixed services provided by the recently created refuge on Farm 3 in contrast to the benefits from well-established, naturally occurring refugia on Farm 1 and 2. These differing results suggest that structural and temporal factors determine the ability of a refuge to host biodiversity and provide ecosystem services.
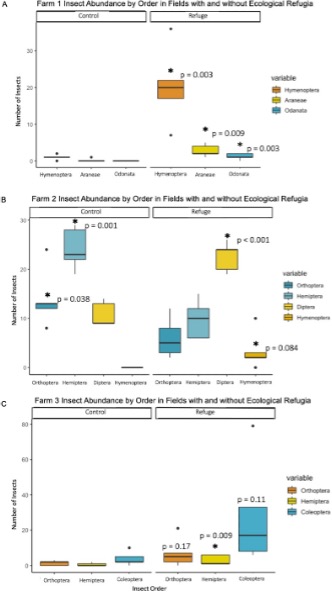
For more detail see the image Insect Abundance by Order and Field Type attached.
To conclude the results from objective one, it is important to reiterate that results from Farm 3 were inconsistent with results from the other two farms. The nonconforming diversity trends on Farm 3 can be explained by two main factors. The first factor is a difference in farm management. Organic management of Farm 1 and 3 explained higher crop field plant diversity due to weeds, cover crops and volunteers not found in high abundance on farms managed with herbicide like Farm 2. Furthermore, organic management is commonly associated with higher insect diversity due to enhanced habitat from higher plant diversity, and lack of insecticide application. The second factor explaining nonconforming diversity trends on Farm 3 was a difference in timescale. The refuge at Farm 3 was recently converted from poor, alkaline soil to a patch habitat, while the other two refugia were pre-existing, relatively undisturbed natural habitat. While plant diversity trends demonstrated a direct relationship between diversity and distance from refuge on Farms 1 and 2, the results were inconsistent on Farm 3. Furthermore, Farms 1 and 2 hosted a higher abundance of beneficial insects in the field with a refuge, while Farm 3 hosted a higher abundance of pest insects in the field with a refuge. These divergent plant and insect trends on Farm 3 emphasize the important role of ecosystem structure in supporting ecosystem function for on-farm refugia, as this refuge is by far the youngest, smallest, least established, and least diverse of the three refugia. This relatively young experiment in small patch habitat restoration should continue to reveal interesting results regarding how plant and insect-mediated ecosystem services change over time as the refuge establishes. Before recommending that farmers remove land from production to convert into on-farm habitat, further research is needed to understand the amount of time, amount of habitat area and amount of biodiversity needed to provide beneficial ecosystem services in on-farm patch habitat.
Transitioning to objective two, seed trap data indicated that seed predators provided a tradeoff in ecosystem services to farmers. In 2021, seed predators equally selected between the two crop seeds, common wheat and Arvika green pea. In terms of weed seeds, seed predators largely preferred field pennycress over wild oat. In 2022, seed predators preferred common wheat over Arvika green pea, and selected kochia over wild oat. Weed seed predation of field pennycress, kochia and wild oat was classified as a beneficial service to famers, while crop seed predation of wheat and pea was considered a disservice to farmers. Therefore, seed predators created a tradeoff for farmers by providing a beneficial service of weed suppression and a disservice of reducing crop yield. Seed predators associated with an ecological refuge provided two beneficial services to Farm 1 in 2021, as weed seed predation was higher and crop seed predation was lower in the field with a refuge than in the control field (Figure 10). However, in 2022, Farm 1 received two disservices of higher crop seed predation and lower weed seed predation in the field with a refuge. In 2021, Farm 2 received two disservices of higher crop seed predation and lower weed seed predation in the field with a refuge (Figure 8). However, in 2022, Farm 2 received mixed services of higher weed seed predation but also higher crop seed predation in the field with a refuge. On Farm 3, the field with a refuge received mixed services as it had higher weed seed predation and higher crop seed predation for both years (Figure 10). Overall, crop seed predation was higher than weed seed predation on all three farms. However, weed seed predation was higher on organic farms than on the conventional farm. Mixed results for seed predation services and disservices suggest that seed predator activity may be explained by differences in farm management practices. Farm 1, which received two beneficial seed predation services, had the advantage of starting with a large, naturally occurring refuge. In addition, organic management practices, including polycropping and lack of chemical inputs, may be another factor contributing to higher biodiversity and seed predation services on this organic farm. In contrast, Farm 2, received only disservices from seed predators, despite having a large, naturally occurring refuge. These disservices may be explained by differences in conventional farm management, as monocropping and application of herbicides and insecticides likely reduced beneficial seed predator activity. Farm 3, which received both seed predation services and disservices, was also under organic management. It experienced higher weed seed predation but also higher crop seed predation. The higher amount of crop seed predation on Farm 3 may be attributed to the lack of seed and other food sources provided by the small and recently established ecological refuge.

For more detail see the image Seed Predation By Seed Type attached.
Additionally, seed predation trends changed with distance from refuge on all three farms. On Farm 1, crop seed and weed seed predation trends were weak and increased insignificantly with distance from refuge (p-value = 0.31 and p-value = 0.18) while overall seed predation increased significantly with distance from refuge (p-value = 0.09) (Figure 11). These results could be interpreted as an indication of lower seed predator activity near and in the ecological refuge. However, due to the fact that Farm 1 is managed organically, has a large ecological refuge and hosts high levels of biodiversity, these results may suggest evidence for the alternative hypothesis, where lower seed predation occurred near the refuge due to its abundance of food sources, and seed trap predation was higher in the crop field due to a lack of food sources typically found there. On Farm 2, crop seed predation, weed seed predation and overall seed predation decreased significantly with distance from refuge (p-value = 0.03, p-value = 0.01 and p-value < 0.01) (Figure 11). Due to the fact that Farm 2 is managed conventionally, the ecological refuge is large and the crop field is a monocrop with little food source diversity, these results indicated a higher abundance of seed predators living near and in the ecological refuge. Seed predation trends on Farm 2 indicated tradeoff for farmers in terms of beneficial weed seed predation but detrimental crop seed predation associated with the refuge. On Farm 3, seed predation trends were weak, as crop seed and overall seed predation decreased insignificantly (p-value = 0.29 and p-value = 0.57), while weed seed predation increased insignificantly (p-value = 0.98) (Figure 11). The weak trends between seed predation and distance from refuge on Farm 1 and 3 may be explained by the interaction between organic management, which would be expected to boost overall seed predation activity, and the young, small refuge, which would be expected to support less seed predator activity than the more established refugia.

For more detail see the image Seed Predation by Distance from Refuge attached.
Next, linear and nonlinear regression were used to assess how proximity to the ecological refuge and nitrogen fertilizer rates impacted crop yield. A nonlinear regression indicated that every pound of nitrogen fertilizer initially increased yield by 0.78 bushels per acre, but that the effects of nitrogen fertilizer plateaued when 38.17 pounds of nitrogen were applied. Without considering the effect of nitrogen application, linear regression indicated that crop yield significantly declined approximately 1.2 bushels per acre with every 20 meters from the refuge (p-value < 0.0001) (Figure 12).
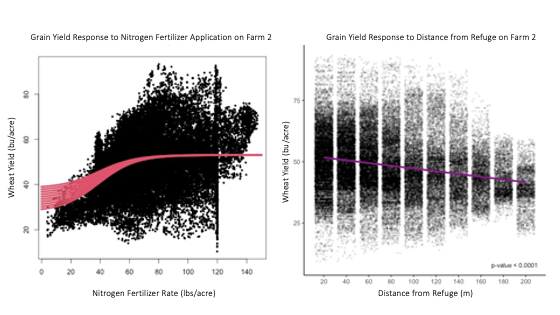
For more detail see the image Yield Decreased with Distance From Refuge on Farm 2 attached.
The nonlinear regression also indicated that distance from refuge negatively impacted yield even after accounting for the effects of nitrogen fertilizer. Yield declined approximately 0.115 bushels per acre every meter from the refuge, or approximately 2.4 bushels every 20 m from the refuge while the maximum fertilizer effect plateaued at 53.06 bushels per acre (Figure 13). As a result, both the linear and non-linear characterizations of yield indicated significant declines in yield with distance from the ecological refuge on Farm 2.
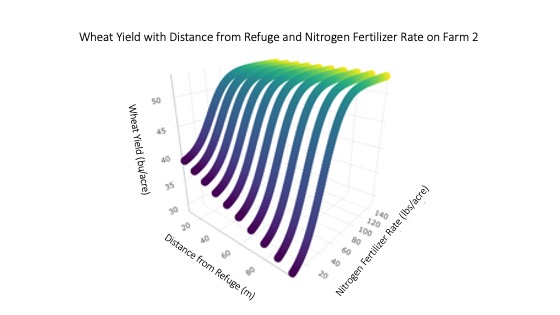
For more detail see the image Wheat Yield with Distance from Refuge and Nitrogen Fertilizer Rate.
However, the opposite trend occurred on Farm 3, as yield significantly increased about 0.6 bushels per acre with every 20 meters from the edge of the refuge (p-value < 0.0001) (Figure 14). No effects of nitrogen fertilizer were accounted for as the farm was managed organically. As noted previously, the length of time required to establish native plant species and associated ecosystem services may explain the difference in yield trends surrounding the newly created refuge on Farm 3 versus those surrounding the well-established, naturally occurring refugia on Farm 2.
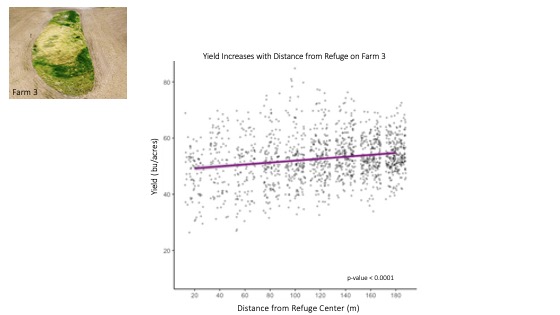
For more detail see the image Yield Increased with Distance From Refuge on Farm 3 attached.
Next, a random forest model was built using distance from refuge, soil characteristics, topography and weather data as explanatory variables for crop yield response. The x-axis of the variable importance plot indicated the decrease in accuracy the model would experience if a particular variable was removed from the model. The y-axis ranked the most important variables from top to bottom. The variable importance plot indicated that distance from refuge was the most important explanatory variable in the model, followed by nitrogen application and then NDVI (Figure 15). In addition, R-squared values were calculated for the model with and without distance from refuge as a variable to quantify each model's ability to explain the variability in yield. A random forest model without distance from refuge as an explanatory variable explained only 57% of the overall variability (R-squared = 0.57) while a random forest model that included distance from refuge as a variable explained 70% of the variability (R-squared = 0.70) model. The vast improvement of the R-squared value and the high ranking of distance from refuge in the variable importance plot indicated that ecological refugia have a significant impact on crop yield.
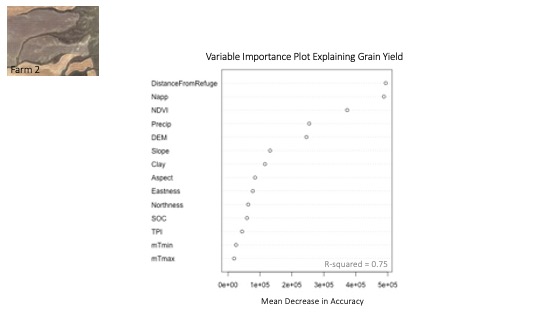
For more detail see the image Variable Importance Explaining Yield attached.
To clarify what sort of effects ecological refugia have on crop yield, multiple linear regression was used to characterize the relationship between each modeled variable and the yield response. Regression coefficients indicated that yield was negatively related to elevation, distance from refuge, sin of aspect, and minimum daily temperature (p-value < 0.0001) (Table 2). Yield was positively related to NDVI, nitrogen application and soil organic carbon content (p-value < 0.0001) (Table 2).
|
Table 2: Multiple Linear Regression Coefficients Explaining Yield |
||
|
Variable |
Estimate |
P-value |
|
Elevation |
-0.569 |
< 0.0001 |
|
Distance from Refuge |
-1755 |
< 0.0001 |
|
Sin of Aspect |
-0.7304 |
0.0008 |
|
Minimum Daily Temperature |
-156.6 |
< 0.0001 |
|
Nitrogen Application |
0.1316 |
< 0.0001 |
|
NDVI |
169.3 |
< 0.0001 |
|
Soil Organic Carbon |
8.426 |
< 0.0001 |
Table 2. Multiple linear regression coefficients indicated that crop yield was negatively related to elevation, distance from refuge, sin of aspect, and minimum daily temperature.
Next, the impact of ecological refugia on crop quality were assessed using winter wheat grain analysis results from 2021 for Farm 2 and 3. Barley samples were collected from Farm 1 but could not be analyzed due to drought-induced lack of grain formation. When comparing field types on Farm 2 and 3, winter wheat protein content was significantly higher and moisture content was insignificantly lower in the field with a refuge on Farm 2 (p-value < 0.001 and p-value = 0.3) (Figure 16). These trends were reversed on Farm 3, where winter wheat grain moisture content was significantly higher while grain protein was significantly lower in the field with a refuge (p-value < 0.0001 and p-value = 0.014) (Figure 16). Typically, grain protein content is strongly influenced by environmental factors such as nitrogen application, temperature and water availability. Higher precipitation at the beginning of the grain-fill phase can positively affect protein formation, as it tends to improve the uptake of nitrogen. However, water stress during early grain development can reduce overall grain weight, and increase relative grain protein content. Thus, water stress effects might explain the inverse relationship between grain moisture and grain protein content reported on both farms.
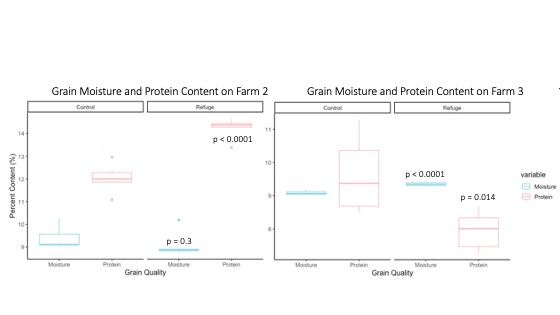
For more detail see the image Grain Moisture and Protein Content attached.
On both Farms 2 and 3, grain polyphenol content was significantly lower in the field with a refuge and grain iron content was significantly higher in the field with a refuge on Farm 2 (p-value = 0.003 and p-value = 0.039) (Figure 17). Grain iron content was significantly higher in the field with a refuge on Farm 2 (p-value = 0.011) while grain iron content did not significantly differ between field types on Farm 3 (Figure 17).
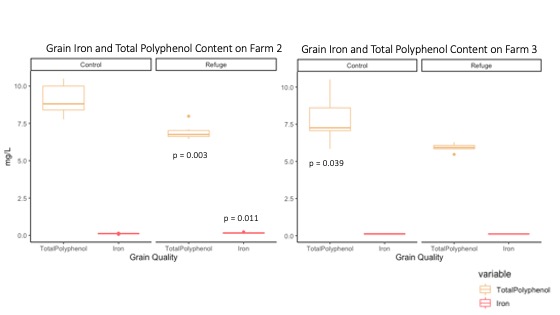
For more detail see image Grain Iron and Polyphenol Content attached.
On Farm 2, grain total polyphenol content significantly increased with distance from the refuge (p-value = 0.04) while grain moisture, protein and iron content did not change significantly with distance from the refuge (Figure 18). On Farm 3, grain quality metrics did not differ with distance from the refuge, likely due to the low sample size and lack of grain development. As for differences in grain polyphenols, the synthesis and bioaccumulation of phenolic compounds often depend on environmental factors such as temperature and precipitation during grain kernel development. The phenolic pathway in plants can also be stimulated by stressful conditions, such as herbivory or drought. Consequently, crops grown in organic or low-input systems often contain more phenolic compounds than those grown in conventional systems with high inputs. Thus, higher concentrations of plant polyphenols tend to appear in stressed plants. One explanation of the increase in grain polyphenols with distance from refuge is that plants near the refuge underwent less stress than plants far from the refuge. Less stress near the refuge may be due to beneficial services associated with the refuge such as beneficial insects reducing pests that could stress and damage crops, seed predators reducing crop competition with weeds or even ground-dwelling insects providing bioturbation that reduced crop stress by improving soil water holding capacity.
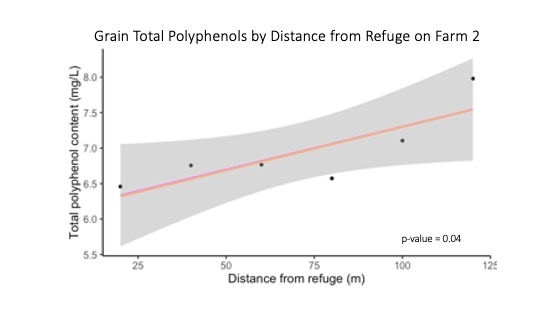
For more detail see the image Grain Total Polyphenol Content with Distance from Refuge on Farm 2 attached.
Using the additional 60 plant tissue samples, a linear regression on Farm 2 indicated that grain protein and iron content significantly decreased with distance from the refuge (p-value < 0.0001) while grain polyphenol content increased with distance from the refuge (p-value < 0.0001) (Figure 19). Grain protein decreased by 0.16% every 20 meters from the edge of the refuge, while grain iron content decreased by 0.011 mg/L every 20 meters from the edge of the refuge (p-value <0.0001) (Figure 19). Grain polyphenols increased by 0.224 mg/L every 20 meters from the edge of the refuge. One explanation for the higher grain protein content near the refuge may be due to an interaction between environmental factors and nitrogen application. The lower topography and potentially increased soil water holding capacity near the refuge could lead to enhanced nitrogen uptake near the refuge, subsequently enhancing grain protein formation in crops closer to the refuge. However, the relationship between precipitation, temperature, nitrogen uptake and grain protein formation are complex and difficult to parse out without an empirical study of how they specifically interacted on Farm 2. The increase in grain polyphenol concentration with distance from the refuge offers further evidence that plants near the refuge underwent less stress than plants far from the refuge. This could suggest that beneficial ecosystem services proximal to the refuge created conditions that are more conducive to crop growth.
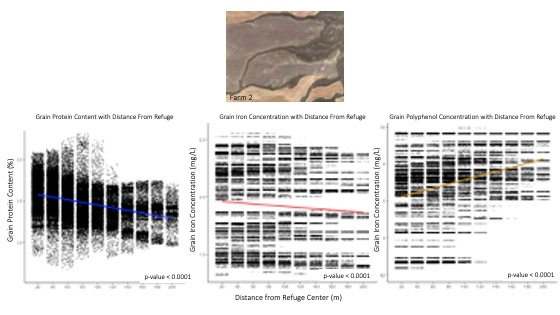
For more detail see the image Grain Protein, Polyphenol, and Iron Content attached.
To explain the relationship underlying growth conditions and grain quality metrics, a variable importance plot for the random forest model indicated that distance from refuge, followed by nitrogen application, were the most import variables in explaining grain protein, iron and polyphenol concentration (Figure 20). R-squared values were calculated to quantify each model's ability to explain variation in grain quality. A random forest model explained 54% of the overall variability in grain protein content (R-squared = 0.54), 72% of the variability in grain iron content (R-squared = 0.72) and 58% of the variability in grain polyphenol content (R-squared = 0.58) (Figure 20). While the models captured some of the variability underlying grain quality, these R-squared values indicate that interactions between environmental conditions and other variables such as management practices that affect grain quality should be studied in more depth in future research.
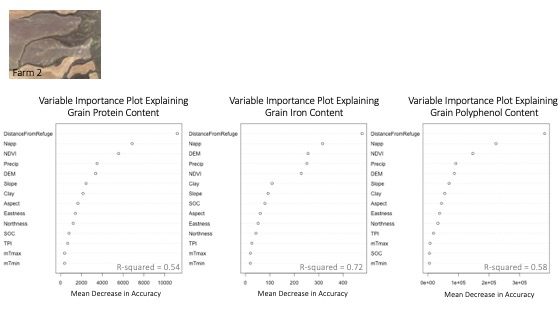
For more detail see the image Variable Importance Explaining Grain Quality attached.
To clarify what sort of effects ecological refugia have on each metric of grain quality, multiple linear regression was used to characterize the relationship between each modeled variable and grain protein, iron and polyphenol content. A multiple linear regression indicated that grain protein content was negatively related to soil clay content, slope, and soil organic carbon content (p-value < 0.0001 and p-value = 0.0025) (Table 3). Protein content was positively related to elevation, distance from refuge, maximum daily temperature, nitrogen fertilizer application, NDVI, cos of aspect and topographic positioning index p-value < 0.0001, p-value = 0.0086 and p-value = 0.0001) (Table 3).
|
Table 3: Multiple Linear Regression Coefficients Explaining Grain Protein Content |
||
|
Variable |
Estimate |
P-value |
|
Soil clay content |
-0.3254 |
<0.0001 |
|
Elevation |
0.0288 |
<0.0001 |
|
Distance from Refuge |
165.8 |
<0.0001 |
|
Maximum daily temperature |
2.133 |
<0.0001 |
|
Nitrogen Application |
0.0118 |
<0.0001 |
|
NDVI |
9.779 |
<0.0001 |
|
Cos of Aspect |
0.1395 |
0.0086 |
|
Slope |
-4.309 |
0.0025 |
|
Soil Organic Carbon |
-0.8526 |
<0.0001 |
|
Topographic Positioning Index |
0.2787 |
0.0001 |
Table 3. Multiple linear regression coefficients indicated that grain protein content was negatively related to soil clay content, slope and soil organic carbon and positively related to elevation, distance from refuge, maximum daily temperature, nitrogen fertilizer application, NDVI, cos of aspect and topographic positioning index.
Multiple linear regression indicated that grain iron content was negatively related to elevation, nitrogen fertilizer application and slope (p-value < 0.0001) (Table 4). Grain iron content was positively related to soil clay content, distance from refuge, cos of aspect, soil organic carbon content and topographic positioning index (p-value < 0.0001) (Table 4).
|
Table 4: Multiple Linear Regression Coefficients Explaining Grain Iron Content |
||
|
Variable |
Estimate |
P-value |
|
Soil Clay Content |
9.9495 |
<0.0001 |
|
Elevation |
-0.0455 |
<0.0001 |
|
Distance from Refuge |
86.3832 |
<0.0001 |
|
Nitrogen Application |
-0.0013 |
<0.0001 |
|
Cos of Aspect |
0.0624 |
<0.0001 |
|
Slope |
-0.8671 |
<0.0001 |
|
Soil Organic Carbon |
0.3085 |
<0.0001 |
|
Topographic Positioning Index |
0.0545 |
<0.0001 |
Table 4. Multiple linear regression coefficients indicated that grain iron content was negatively related to elevation, nitrogen fertilizer application and slope and positively related to soil clay content, distance from refuge, cos of aspect, soil organic carbon content and topographic positioning index.
A multiple linear regression indicated that grain polyphenol content was negatively related to elevation, nitrogen fertilizer application and slope (p-value < 0.0001 and p-value = 0.0301) (Table 5). Grain polyphenol content was positively related to distance from refuge, sin of aspect, NDVI, cos of aspect, soil organic carbon content and topographic positioning index (p-value < 0.0001, p-value = 0.038, p-value = 0.0147, p-value = 0.0222, p-value = 0.0001 and p-value < 0.0001) (Table 5).
|
Table 5: Multiple Linear Regression Coefficients Explaining Grain Polyphenol Content |
||
|
Variable |
Estimate |
P-value |
|
Elevation |
-0.1599 |
<0.0001 |
|
Distance from Refuge |
689.0788 |
<0.0001 |
|
Sin of Aspect |
0.3498 |
0.038 |
|
Nitrogen Application |
-0.07735 |
<0.0001 |
|
NDVI |
12.5877 |
0.0147 |
|
Cos of Aspect |
0.6800 |
0.0222 |
|
Slope |
-17.1468 |
0.0301 |
|
Soil Organic Carbon |
1.4166 |
0.0001 |
|
Topographic Positioning Index |
1.4222 |
<0.0001 |
Table 5. Multiple linear regression coefficients indicated that grain polyphenol content was negatively related to elevation, nitrogen fertilizer application and slope and positively related to distance from refuge, sin of aspect, NDVI, cos of aspect, soil organic carbon content and topographic positioning index.
In conclusion, ecological refugia were characterized as a proxy for habitat heterogeneity and assessed for their capacity to support biodiversity, enhance beneficial ecosystem services, and benefit food production on three farms in Montana. A combination of field surveys, precision agriculture technology and remote sensing data was used to quantify the tradeoff between the conservation benefits and food production impacts that refugia provided. Contrary to common assumptions, native plant species richness was highest in the crop field and lowest in the refugia, indicating that ecological refugia were not sources of weedy species but hosts of native plant diversity. Plant diversity declined significantly with distance from naturally occurring refugia into the crop field and from a newly created refuge in the third year of data collection. Insect diversity declined significantly with distance from refugia for all refugia. In addition, fields with naturally occurring refugia had a higher abundance of beneficial insects while the created refuge and control field without naturally occurring refugia had a significantly higher abundance of pest insects. Seed trap data indicated that beneficial weed seed predation services were higher on organic farms while crop seed predation disservices were higher on a conventionally managed farm. Crop yield declined significantly with distance from a naturally occurring refugia and increased significantly with distance from a created refuge. A variable importance plot indicated that distance from refuge was the most importance predictor of yield in a random forest model and that incorporating distance from refuge in the model raised the R-squared value from 0.57 to 0.70. Lastly, grain protein concentration had an inverse relationship with grain moisture content, though the relationship between proximity to an ecological refuge, moisture retention, nitrogen uptake and grain protein formation remained uncertain. Grain phenolic compounds tended to decrease with distance from the refuge, signaling that crops proximal to ecological refugia may undergo less stress than plants growing far from them. In addition, plants grown near ecological refugia contained a higher concentration of phenolic compounds, which contain antioxidants and tend to have positive human health outcomes.
Future implementation of ecological refugia as an on-farm conservation practice will depend on site-specific evidence that refugia can maintain or increase crop yields, decrease inputs, increase beneficial biodiversity, enhance ecosystem services, and increase farmers' net return. To do so, future research must clarify the relationship between on-farm biodiversity and habitat fragments at multiple scales, test the association between on-farm biodiversity and specific ecosystem services, and explore ways to increase affordability and application of on-farm technology like yield monitors that can provide farm-specific data to aid decision making. The adoption of ecological refugia as an on-farm conservation strategy provides a novel opportunity to optimize conservation and food production objectives at the agroecosystem scale.
Research outcomes
Education and Outreach
Participation summary:
The agroecology lab at Montana State University has been conducting on-farm precision experimentation (OFPE) with producers from the Precision Agricultural Research Association (PARA) of Montana since 2015. PARA functions as a Participatory Research Network to promote farmer-to-farmer education. Multiple farm visits are conducted throughout the year for the purpose of site touring, farmer consultation and data collection. The three producers in this project (Gary Broyles, Ole Norgaard and Casey Bailey) shared their on-farm results with the other participating farmers in PARA. This type of farmer-to-farmer sharing helps participating farmers to utilize technologies and generate tailored data for their own farms. Presentations of this work at other farmer-centric conferences such as the Montana Organics Association and Alternative Energy and Resources Organization annual exposition centered on practical findings of how sustainable farming could benefit farmers in terms of net return and ecosystem services. In addition, results of this project were shared at the Data Intensive Farm Management workshop and Precision Agriculture Bootcamp at Montana State University to promote the application of precision agriculture technology to on-farm conservation and sustainable crop production. Presentations of this work at ecological conferences such as the Ecological Society of America aimed to bridge the gap between ecology and agronomy as distinct academic disciplines and promote creative agroecological solutions. The ArcGIS Story Map of this project provided free, easily accessible information about the tradeoffs of ecological refugia and on-farm conservation with the general public.